Home Blog Page 914

Market Veteran Brandt Identifies When Bitcoin Could Break Out of the Ongoing Consolidation

0

Bitcoin is currently trading within consolidation phase, but veteran trader Peter Brandt has identified when the asset could secure a breakout.

In his latest analysis, the market veteran highlighted the importance of this structured price action and pointed to an upcoming critical moment for Bitcoin between Feb. 24 and 26. Notably, his analysis suggests that this period could determine the next major move in Bitcoin’s price.

Brandt’s Symmetrical Chart Pattern

The accompanying daily chart confirms Bitcoin’s range-bound movement. For context, the price has consistently oscillated between highs of around $106,000 and lows near $90,500. 

Citing data from the chart, Brandt stressed that the market structure exhibits what he calls “internal symmetry.” This suggests that price movements have mirrored each other in a balanced manner.
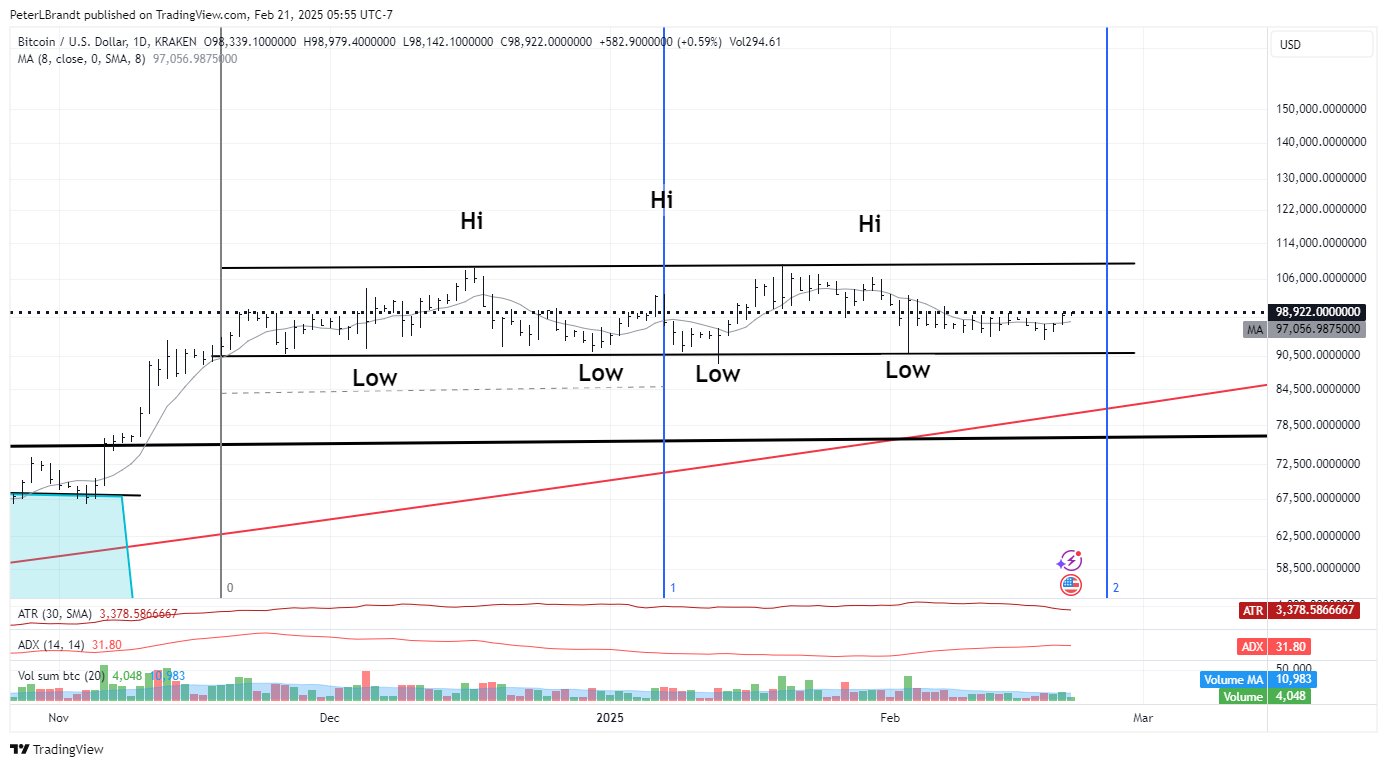
BTC 1D Chart Peter Brandt

Particularly, the chart shows three clear peaks and four lows, forming a predictable pattern, and suggests Bitcoin is preparing for a breakout in either direction.

Brandt expects the period around Feb. 24 to 26 to be a decisive moment when Bitcoin could either break above resistance or fall below support. However, the analyst chose not to favor any direction, whether upward or downward.

Bullish and Bearish Cases for Bitcoin 

However, data from his chart indicates some bullish and bearish cases for Bitcoin. On the bullish part, Bitcoin has held above support multiple times, showing strength in the current range. Notably, a sustainable breakout above the $106,000 resistance could trigger a strong rally toward new highs. 

Meanwhile, for the bearish case, Bitcoin has failed to break the resistance at $106,000 multiple times, signaling possible exhaustion. Moreover, the ADX indicator at 31.80 shows weak trend momentum. If Bitcoin falls below $90,500, it could result in a sharp sell-off.

Analysts Expect Bitcoin Breakout Soon

Amid the ongoing consolidation, several prominent analysts have also shared their perspectives on Bitcoin’s price action and potential breakout scenarios. Crypto analyst Miles Deutscher noted today that Bitcoin’s 30-day realized volatility is now lower than it was during most of last summer. 

The Crypto Basic recently highlighted this trend of declining volatility. Bitcoin has historically remained in range-bound trading during such low-volatility periods until a catalyst triggers the next major price shift. He suggests that the market is waiting for a significant event to push Bitcoin out of its current phase.

Further, trader Don Alt has expressed a bullish outlook, emphasizing that $99,000 to $101,000 is the last major resistance before Bitcoin enters price discovery. 
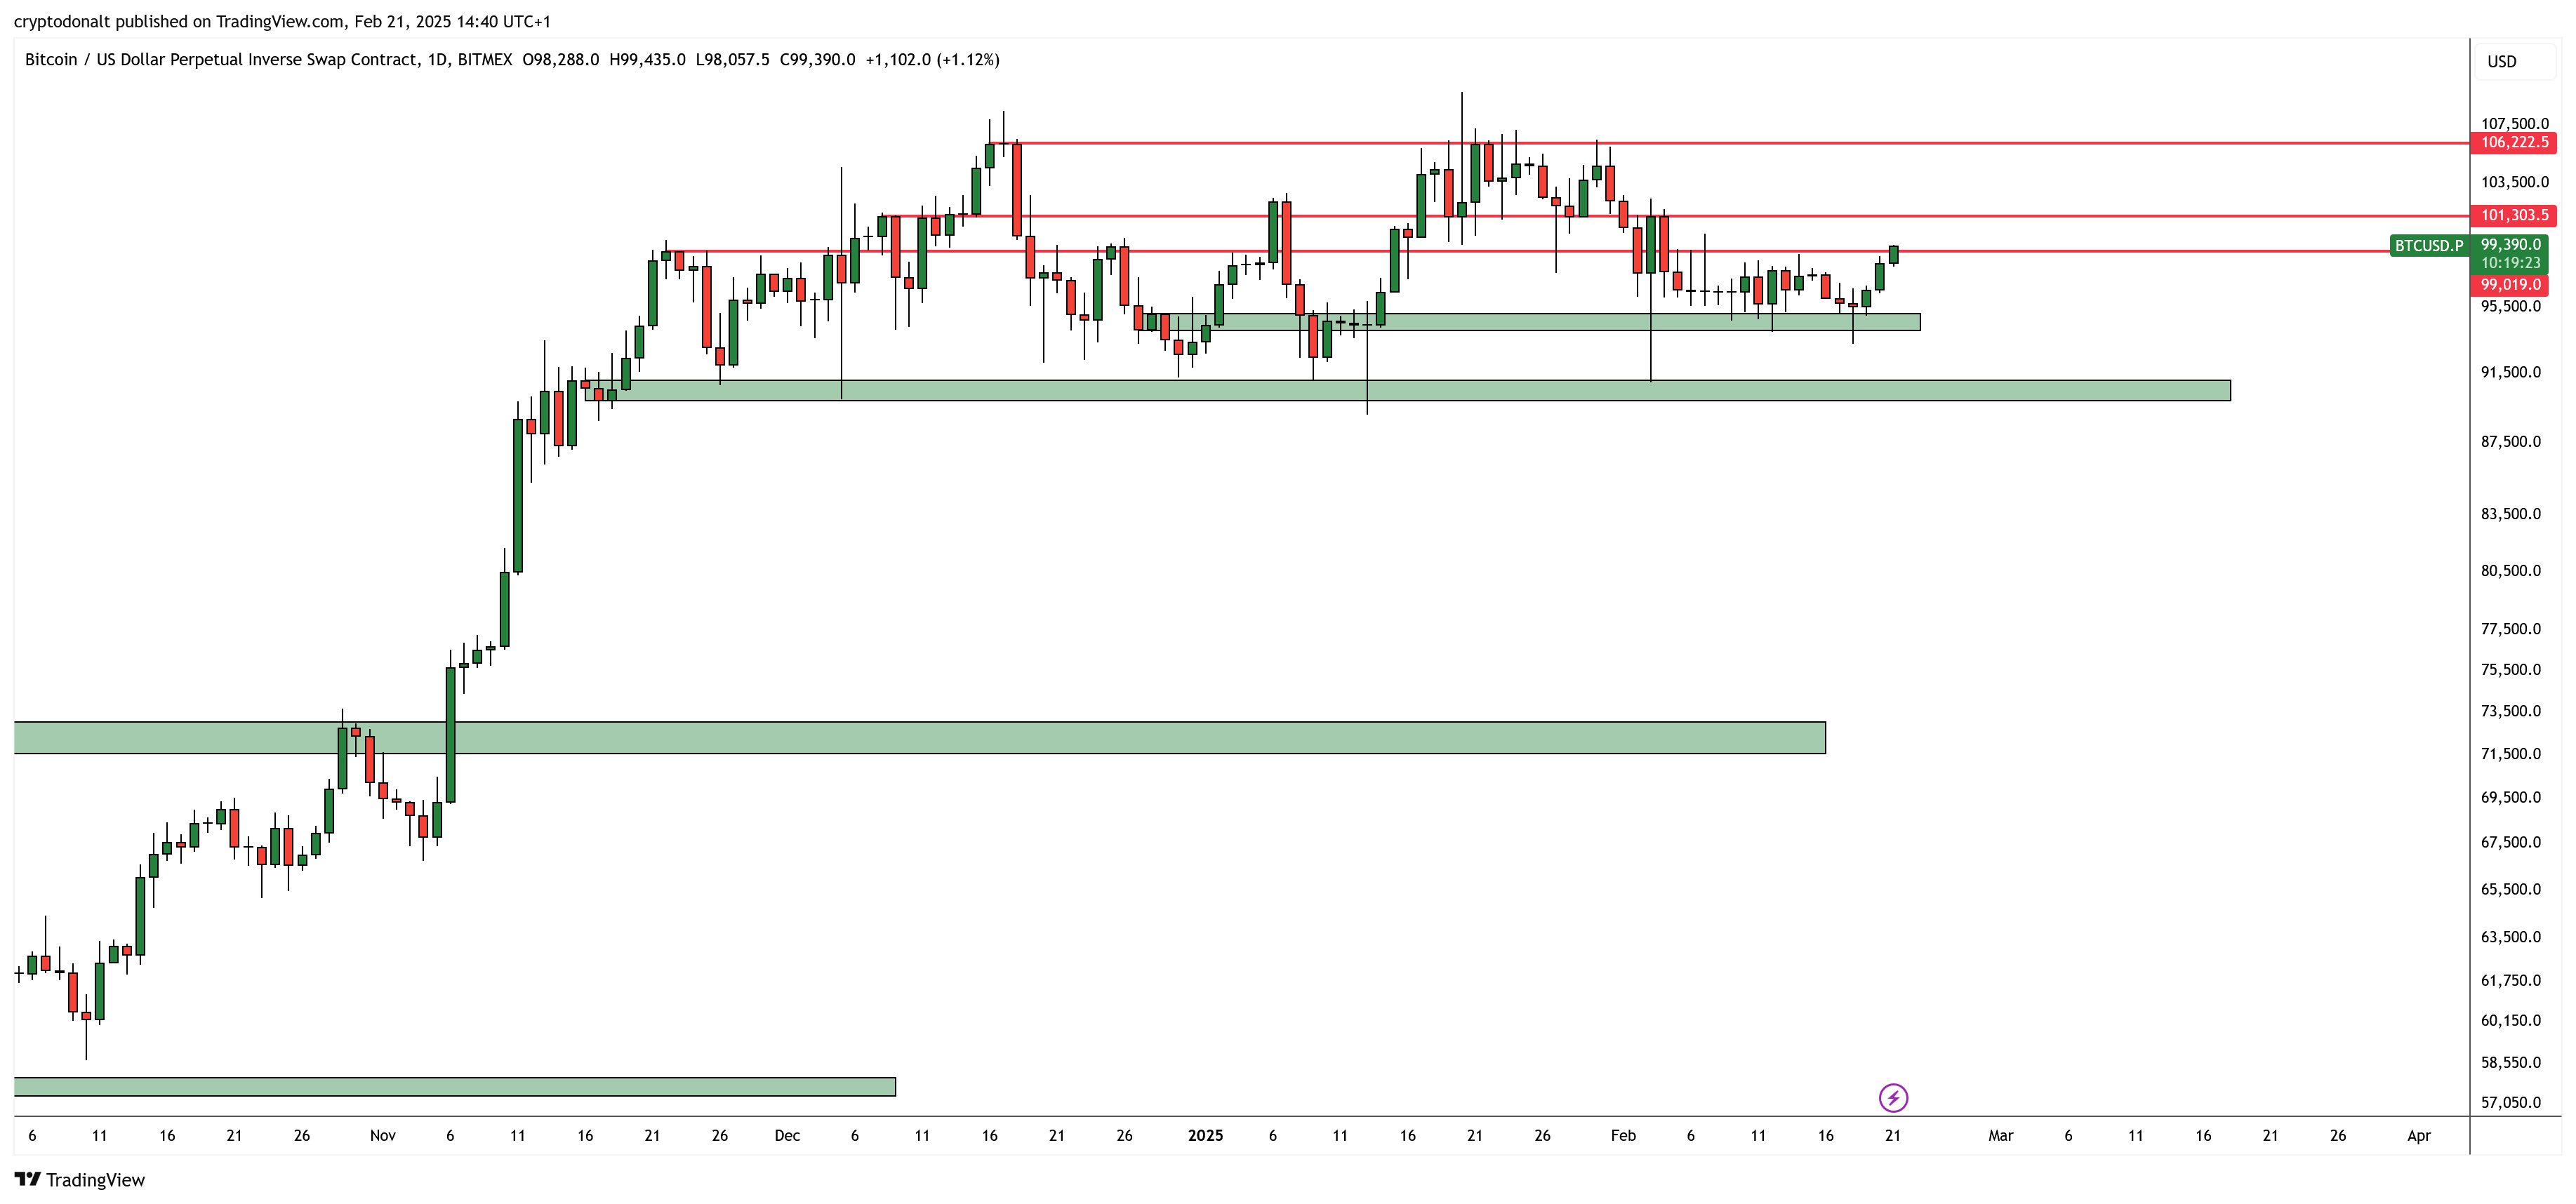
Bitcoin 1D Chart Don Alt
Bitcoin 1D Chart | Don Alt

He pointed out that it only takes a few strong daily candles to shift the sentiment in Bitcoin’s favor. If Bitcoin successfully breaks this resistance, Don Alt expects a strong upward move toward new all-time highs.

Meanwhile, Cas Abbé, a notable analyst, believes Bitcoin is in a Wyckoff Distribution phase, which historically precedes a temporary peak before further market fluctuations. 

His projection places Bitcoin’s short-term target at $120,000, potentially marking a local top before another consolidation phase. He predicts Bitcoin will experience choppy price action for four to six months, with a final blow-off top in Q4 2025. Bitcoin already shows signs of a breakout, currently trading for $97,784 at press time.

Altcoin Season Has Begun According to CryptoQuant, But There is a Catch

0

The long-awaited altcoin season is finally here, at least according to prominent crypto analytics firm CryptoQuant.

Altcoin season is when alternative cryptocurrencies (altcoins) experience substantial price increases and outperform Bitcoin. This is largely due to investors taking out their profits from Bitcoin and investing in these altcoins for more gains.

Since the crypto market kicked off its resurgence from the 2022 bear market, market participants have continued to anticipate this phase of the market to no avail. It is highly anticipated because altcoins tend to offer higher returns than Bitcoin in a bull market due to their smaller market caps that allow room for greater volatility.

Meanwhile, in an X post on Friday, February 21, CryptoQuant CEO Ki Young Ju asserted that this long-awaited phase of the market was finally here. However, he noted that the dynamics had changed.

Typically, altcoin season is marked by a decrease in Bitcoin’s market share dominance, implying a rotation of profits from Bitcoin to altcoins as speculators seek higher returns.

According to Young Ju, however, this is no longer the case. Instead of a rotation of capital from Bitcoin to altcoins, the market phase is now driven by direct stablecoin inflows.

Sharing the trading volume ratio of Bitcoin to altcoins on centralized exchanges, he noted that altcoin volumes were now almost thrice that of Bitcoin, suggesting stablecoin holders were now favoring altcoins.

CEX volume ratio of Bitcoin to altcoins
CEX volume ratio of Bitcoin to altcoins. Source: Ki Young Ju

“BTC Dominance no longer defines alt season—trading volume does,” the analyst stressed.

Ki Young Ju had theorized this shift in December 2024. He argued that with the emergence of Bitcoin proxies like exchange-traded funds and MicroStrategy, altcoins were being starved of fresh liquidity as capital could not rotate from these vehicles to other crypto assets.

“Bitcoin is drifting away from the crypto ecosystem. Altcoins used to move together based on their correlation with BTC, but that pattern has now broken,” he wrote at the time.

A Selective Altcoin Season

With this changing market dynamic, Young Ju has warned that only altcoins with paper-wrapped versions like ETFs or real internet money ecosystems supported by stablecoins or Bitcoin will survive.

“Find a coin that can do one of the two and hold it long-term,” he stressed.

Young Ju’s recent post comes as the crypto market appears to be staging a relief rally. At the time of writing, Bitcoin is trading just over the $99,000 mark, representing a 2% gain on the day. Meanwhile, most altcoins in the top ten by market cap like Ethereum, Solana, and Cardano are posting over 3% gains.

Kanye West Moves to Launch YZY Token Amid Controversy, Aims to Bypass Censored Platforms

0

Prominent American rapper Kanye West, aka Ye, is venturing into the crypto space by introducing his new token, YZY. 

This move comes after West faced several controversies that led to major platforms severing ties with him. With YZY, he plans to circumvent these platforms while integrating the token into his Yeezy brand’s ecosystem.

Token Distribution and Role

The YZY token will be distributed in a manner that ensures Ye retains control over the project. A majority share, 70%, will be allocated directly to him, with 10% set aside for liquidity purposes and 20% for investors. 

YZY is designed to serve as the primary medium of exchange within the Yeezy brand. This means it will be a tenable form of payment on his official website. This allows Ye to take more control over the transaction process, bypassing traditional payment systems.

Launch Delay and Project Updates

The token’s initial release was slated for Thursday evening, but sources familiar with the project revealed that it had been postponed until Friday. 

The delay raises questions about the execution of the launch, though no further details have been provided. This setback comes amid the YZY token generating significant attention from the public.

Recent Trend of Meme Coin Launches

Ye’s cryptocurrency initiative follows a series of similar launches and promotions by other prominent figures. Argentine President Javier Milei recently promoted a Solana-based meme coin that briefly gained attention before plummeting in value. 

Milei later distanced himself from the coin. He stated that he was uninformed about its details before sharing it with his millions of followers. 

Similarly, U.S. President Donald Trump released the TRUMP meme coin in January, which saw an immediate spike but has since plummeted. First Lady Melania Trump also launched her own coin, MElANIA, around the same time.

Despite their popularity, both tokens have struggled to maintain the initial bullish momentum they set out with as the prices continue to lower.

Is Bitcoin Setting Up for a Major Move? Volatility Hits Historical Lows Again

0

The short-term volatility of Bitcoin has recently dropped to levels not seen in years, sparking speculation about potential upcoming market movements.

According to data from Glassnode, the Bitcoin 1-week realized volatility has fallen to 23.42%, approaching historical lows. Over the past four years, the metric has dropped below this level only a few times.

Notably, this occurred in October 2024, when it slumped to 22.88%, and in November 2023, it bottomed at 21.35%. Historically, significant uptrends have followed such periods of compressed volatility.

How Bitcoin Reacted in Previous Instances

For context, in November 2023, when Bitcoin’s 1-week realized volatility touched a low of 21.35%, the premier asset was trading at $27K. By the end of January 2024, its price had appreciated by nearly 100%, reclaiming the $50K mark.

Similarly, in October 2024, Bitcoin was around $63K but has since improved by a similar magnitude, peaking at $110K in January 2025.

Now, with Bitcoin’s short-term volatility revisiting its historical bottom, analysts wonder if another major move is on the horizon. This comes at a time when Bitcoin’s performance has been relatively stagnant around the upper $90K region.

However, as of today, Bitcoin is making another bold attempt at the $100K level, reaching an intraday high of $99,500 at press time.

BTC Implied Volatility Also Falls to Multi-Year Lows

Meanwhile, the 1-week implied volatility (IV) for Bitcoin options has similarly dropped to 37.39%, according to Glassnode data. This current figure suggests that traders are not anticipating major short-term price swings.

It marks a significant dip from earlier levels. The last time IV was this low was in 2023 and early 2024. Also, notable volatility spikes followed.

Despite the short-term calm, longer-term implied volatility remains elevated. Specifically, Bitcoin’s 3-month IV stands at 53.1%, and the 6-month IV is at 56.25%.

These higher levels suggest that, while the market remains uneventful in the short term, traders are still bracing for larger swings in the medium and long term.

Ultimately, the combination of low realized and implied volatility in the short-term and higher long-term implied volatility suggests a brewing storm. Bitcoin is hovering around $98,900 at press time, up 2% over the past day.

Top French Bank Launches MiCA-Compliant Stablecoin on Stellar Chain

0

SG-Forge, a subsidiary of top French commercial bank Société Générale, has launched its MiCA-compliant euro-pegged stablecoin on the Stellar blockchain. 

According to an announcement, the EUR CoinVertible stablecoin (EURCV) grants users access to a transparent, secure, scalable, and regulatory-compliant digital euro. 

The EURCV stablecoin has three major features: MiCA compliance, Stellar integration, and expanded accessibility. Per the announcement, EURCV is the first euro-pegged stablecoin to be fully compliant with the EU’s Markets in Crypto-Assets (MiCA) regulation.

Notably, its compliance with the MiCA regulation offers users unrivaled security and transparency, protecting them from fraudulent practices. 

Why SG-Forge Chose Stellar for Its Stablecoin Launch 

In addition, EURCV’s integration with the Stellar network makes it suitable for cross-border settlements, with easy incorporation into financial applications through the blockchain’s native decentralized exchange. Also, the stablecoin will leverage Stellar’s speed and cost-effective features to enhance users’ experience. 

Furthermore, launching EURCV in the Stellar ecosystem exposes the stablecoin to asset managers, financial institutions, and entities within the traditional financial space that have previously connected with the blockchain. 

Another reason why SG-Forge launched EURCV on Stellar was to leverage the network’s high scalability, low cost, speed, and asset tokenization advantages. The announcement notes that while transactions on the Stellar blockchain are completed within seconds, users get to pay less than a cent in fees. 

Stellar and SG-Forge Execs React 

Guillaume Chatain, Chief Revenue Officer (CRO) at SG-Forge, referred to EURCV’s integration with Stellar as a pivotal moment that bridges the realms of traditional finance and the digital asset ecosystem. 

Also, Denelle Dixon, CEO of Stellar Development Foundation (SDF), highlights the launch of EURCV as a significant step in the evolution of digital payments. She pointed out that combining the Stellar blockchain with a MiCA-compliant stablecoin offers businesses and individuals a reliable way to store and transfer value.

In the meantime, EURCV is currently available on Luxembourg-based cryptocurrency exchange Bitstamp. It has a market cap of €42.21 million ($44.22 million), with a daily trading volume of €4,592 ($4,811). At the moment, EURCV has a circulating and total supply of 41.16 million tokens. 

For context, EURCV has been in existence since 2023, following its initial debut on the Ethereum blockchain. The stablecoin has debuted on other prominent blockchains ever since, including the XRP Ledger (XRPL).

Bitcoin Soars as US SEC Dismisses Case Against Coinbase

0

The US Securities and Exchange Commission (SEC) has dropped its years-long case against leading crypto exchange Coinbase.

In a blog release on Friday, Coinbase announced that the securities watchdog has decided to close the case after a unanimous agreement. Notably, the expected turn of events follows a conclusion on the futility of the lawsuit after careful consideration.

US SEC Righting a Wrong

Coinbase claims the case dismissal is righting an earlier wrong, as the lawsuit was never meant to be. For perspective, recall that the US SEC sued Coinbase in 2023 for offering unregistered securities to US investors.

The contentious lawsuit has dragged on since then despite several Coinbase attempts to dismiss the case. Notably, the exchange claims the case was an obvious war against cryptocurrency, which it, its US customers, and the broader digital asset sector have won today.

Coinbase Chief Legal Officer Paul Grewal also affirmed the dismissal. In a tweet, he disclosed that the SEC had outrightly dropped the case without seeking a compromise or a settlement.

War Not Over

Meanwhile, the exchange suggested the war is not over yet. While applauding the significant win, Coinbase noted it would be essential to ensure that the SEC establishes the premise on which it overruled the case for the industry’s greater good.

Furthermore, Coinbase urged the SEC and other concerned regulatory bodies to forge a clear regulatory guideline for the crypto industry to prevent the lack of clarity from being weaponized in the future. The pronounced rules of engagement will encourage investors to adopt the nascent sector and position the US at the forefront of technological innovation.

Meanwhile, the dismissal came a few days after the US SEC paused its case against Coinbase and Binance. The new-faced regulatory top dog cited the creation of the crypto task force, an organization tasked with proffering the best approach to settling the years-long conflict. However, cases like the Ripple lawsuit still remain in the court, with projections that the agency could drop it next.

Moreover, Bitcoin and the global crypto market reacted to the Coinbase case dismissal. The pioneering cryptocurrency pushed close to six figures following the announcement, trading at $99,401 at the time of writing.

Cardano Hits New User Milestone as Decentralized Governance Takes Off

0

The Cardano network has hit a new user milestone.

The positives keep coming hard and fast for Cardano. Amid strides like the network’s successful implementation of fully decentralized governance and recent hopes of an exchange-traded fund backed by the network’s native token ADA, the network has hit a new milestone.

Cardano Wallets Surpass 5.2 Million

The Cardano network has hit a new user milestone.

As of Wednesday, February 19, the number of wallets created on the Cardano network surpassed 5.2 million, according to Cardano Blockchain Insights, which combines data from two Cardano blockchain explorers: cexplorer.io and AdaStat. At the end of Thursday, February 20, the tally stood at 5,201,576. 

TapTools first disclosed the milestone on Thursday.

ADA wallet count
ADA wallet count. Source: Cardano Blockchain Insights

Interestingly, over 50,000 of these wallets were created in the past 30 days alone, suggesting significant interest in the network in recent times.

But beyond new wallets, Cardano has recently seen significant growth in other key areas. According to a recent Messari report, the average daily active addresses on the network surged 57.8% in Q4 2024 to 42,900.

In line with this rise in active addresses, average daily transactions have also spiked, jumping 65.4% to 71,500.

A Cycle for Cardano to Shine?

Last week, Cardano founder Charles Hoskinson asserted that ADA, Ethereum, and XRP will be the big winners in this market cycle.

He said this citing the perceived dominance of institutional investors in the market, arguing that he expected to see a flight to the blue chips, which are seen as more reliable and stable.

ADA currently changes hands at the $0.80 price level at the reporting time, marking a 1.2% increase over the past 24 hours.

Here is Predicted Price of Shiba Inu If It Matches XRP, BNB, or Solana Market Cap

0

Shiba Inu can eliminate a zero from its price if SHIB equals the market cap of XRP, BNB, or Solana in the future. 

Shiba Inu (SHIB) has remained in bearish territory this year despite its remarkable performance in late 2024, particularly between November and December. Recall that Shiba Inu witnessed outstanding growth within this period, with its market cap soaring 87% from $10.54 billion to $19.7 billion. 

However, Shiba Inu has lost most of its gains following a strong correction across the broader crypto market. Currently, SHIB stands as the 16th biggest cryptocurrency globally, with a market cap of $9.56 billion.

This represents a drawdown of 51.47% from Shiba Inu’s December 2024 peak valuation. Also, Shiba Inu’s price has plunged by 23.2% year-to-date (YTD) to $0.00001623.

SHIBUSDT 2025 02 16 11 30 49

Despite this correction, several investors are still optimistic about SHIB’s long-term potential. Consequently, some are wondering how much SHIB’s price could be worth if it equals the valuation of established cryptocurrencies like XRP, BNB, and Solana. 

Shiba Inu’s Future Price If It Matches XRP Market Cap 

At the moment, XRP is the third-biggest cryptocurrency by market cap. It boasts a valuation of $159.07 billion, putting its price at $2.75 per coin. 

For Shiba Inu to match XRP’s market cap, its valuation must soar by 1,564% from the current figure of $9.56 billion. If this happens and Shiba Inu clinches a market cap of $159.07 billion, it would take SHIB’s price to $0.0002699.

For clarity, this analysis assumes that Shiba Inu’s circulating supply remains relatively stable at 589.25 trillion tokens. Essentially, Shiba Inu’s price could soar to $0.0002699 per token if it matches XRP’s current market cap of $159.07 billion. 

Potential SHIB Price If It Equals BNB Market Cap 

BNB ranks as the fifth-biggest cryptocurrency globally, with a market cap of $95.25 billion and a unit price of $667. 

Given Shiba Inu’s current valuation of $9.56 billion, the canine-themed token must stage a rally of 896% to attain BNB’s market cap of $95.25 billion. Applying this growth rate to Shiba Inu’s current price will see SHIB trade at $0.000161 per coin, assuming the asset’s circulating supply remains unchanged.

Therefore, if Shiba Inu potentially equals BNB’s current valuation of $95.25 billion, its price will soar to $0.000161 per coin. 

SHIB Price If It Equals Solana Valuation 

At the time of writing, Solana is sitting directly behind BNB, making it the sixth-biggest cryptocurrency on CoinMarketCap. It has a market valuation of $94.39 billion, with a unit of SOL currently trading at $193.27 per coin. 

Considering Shiba Inu’s current valuation of $9.56 billion, it must rally by 887% to match Solana’s $94.39 billion valuation. If Shiba Inu eventually hits this milestone, its price could rise to $0.00016 per token, so long as SHIB’s circulating supply remains stable at the current level of 589.25 trillion. 

Can Shiba Inu Attain This Feat? 

Matching the market cap of XRP, BNB, or Solana could be challenging for Shiba Inu, given the cryptocurrency’s hefty supply of over 589 trillion tokens. Hence, it is imperative for Shiba Inu to undergo a massive burn to drastically reduce this supply and potentially boost its value. 

Other factors, such as widespread retail and institutional adoption of SHIB and favorable market conditions, could also play significant roles in helping Shiba Inu achieve this milestone. 

Nonetheless, there is no guarantee that Shiba Inu could match XRP, BNB, or Solana’s market cap in the future. Hence, this article should not be relied upon for financial advice. 

Solana Aims for $180 Breakout: Will It Propel SOL to $260?

Solana recovers with broader market tailwinds. Will a Morning Star pattern help SOL price bounce back above $200?

With a new bullish spree in the crypto market, Solana recovered 4.24% yesterday. Creating a bullish engulfing candle, Solana has surpassed the $175 mark. 

With newfound momentum, technicals are gradually turning optimistic for Solana. Will this recovery surpass the $180 supply zone to reinstate the bullish trend?

Solana Nears $180 Zone: Potential Breakout Ahead?

In the daily chart, the SOL price trend reveals a significant fall from the $260 supply zone, nearly retesting the 23.6% Fibonacci level at $159.47. This marks a 35% correction, reflecting the bearish pressure on Solana.

Solana Price Chart
Solana Price Chart

With lower price rejection from the 23.6% Fibonacci level, Solana has formed a Morning Star pattern, indicating a potential reversal. The bullish engulfing candle of the pattern was formed yesterday with a 4.24% surge.

Currently, the SOL token trades at $175.70, struggling near the 38.20% Fibonacci level. Slightly above this level, the crucial volume zone at $180 acts as an immediate resistance.

Technicals Reveals Upcoming Reversal Run

The short-term recovery appears to be a potential retest of the broken zone. However, the recovery signals a potential comeback for Solana as the Chaikin Money Flow Index nears the zero line.

With a significant recovery within the negative territory, the Chaikin Money Flow Index is on the verge of turning positive. Furthermore, the technicals on the hourly timeframe are showing a bullish signal.

These signals are based on moving averages and oscillators. However, the daily timeframe continues to indicate a selling opportunity.

Whale Accumulation Strengthens the Bullish Case

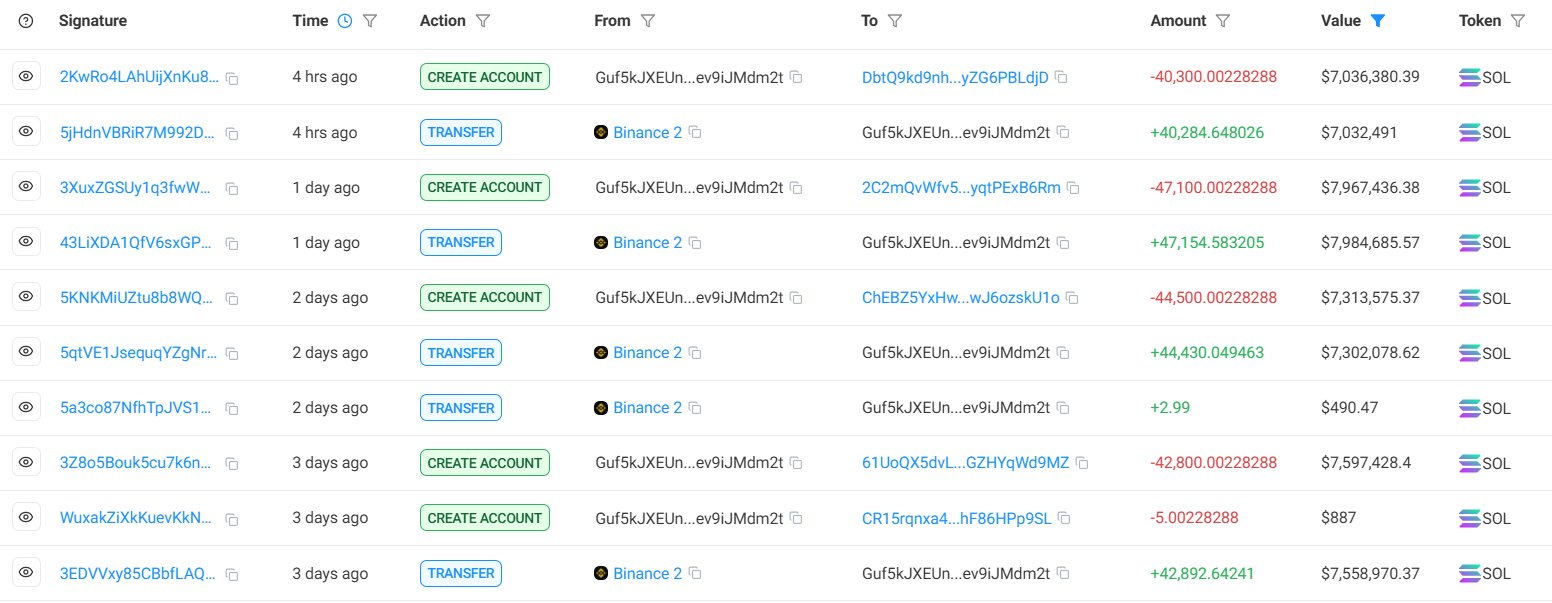
Amid the positive recovery, a crypto whale has showcased strong confidence in Solana. The entity has purchased 174,767 SOL tokens over the past four days.

Image

The purchase is worth $29.87 million from Binance. Furthermore, the whale has staked 174,705 SOL tokens, reducing the available supply and potentially strengthening Solana’s price.

Can SOL Breakout and Reclaim $200?

With growing optimism, the short-term recovery in Solana hints at a potential breakout rally. According to the Fibonacci levels, a breakout above $180 will likely challenge the 61.80% Fibonacci level at $204.

This increases the possibility of SOL surpassing the $200 psychological mark. Beyond that, a potential V-shaped recovery could push SOL towards the $260 supply zone, bringing bullish momentum back into play.

On the flip side, Solana must hold above $159.47, which serves as crucial support. Failure to sustain this level could lead to a dip toward the $150 psychological support, potentially extending the correction.

Ethereum Builds Momentum: Can ETH Price Reclaim $3,000?

Ethereum is nearing a $2,800 breakout to test the $3,000 neckline. With increasing bullish triggers, is ETH ready to surpass $3,000?

Bitcoin bouncing back to the $98,000 mark has boosted the trend momentum in Ethereum. The biggest altcoin in the market has risen to $2,755 with an intraday recovery of 0.61%.

This marks its third consecutive positive day in an attempt to challenge and close above the $2,800 mark. With the short-term recovery gradually gaining momentum and the short-term technicals hinting at a trend continuation, will Ethereum reclaim the $3,000 mark? Let’s find out.

Ethereum Price Nears $2,800 Breakout

In the daily price chart, Ethereum has declined from the swing high of $4,109 to retest the 23.60% Fibonacci level at $2,568.

With multiple lower price rejections, the ETH price trend now forms a consolidation range with the overhead ceiling at the 38.20% Fibonacci level. This crucial resistance is priced at $2,807. 

Ethereum Price Chart

Now, ETH’s price trend has formed three consecutive positive candles, marking a triple white soldiers pattern. This increases the possibility of a breakout rally to challenge the 50% Fibonacci level near the $3,000 psychological mark.

This will likely create a rounding bottom pattern with the 50% Fibonacci level acting as a neckline.

Supporting the chances of a bullish recovery, the daily RSI line has bounced off from the oversold boundary level and is nearing the halfway line. This marks a significant shift in trend momentum.

Along with the RSI, overall technical signals are bullish, with buy signals appearing in the hourly and 4-hour price charts. Although the moving averages still indicate a sell signal on the daily chart, they show a strong buy on the hourly and 4-hour time frames.

The oscillators remain neutral overall, with a buy signal present in the 4-hour price chart. In conclusion, the short-term price trend indicates a buying opportunity, provided the uptrend surpasses the 38.20% Fibonacci level.

Ethereum Whale Returns After 500 Days

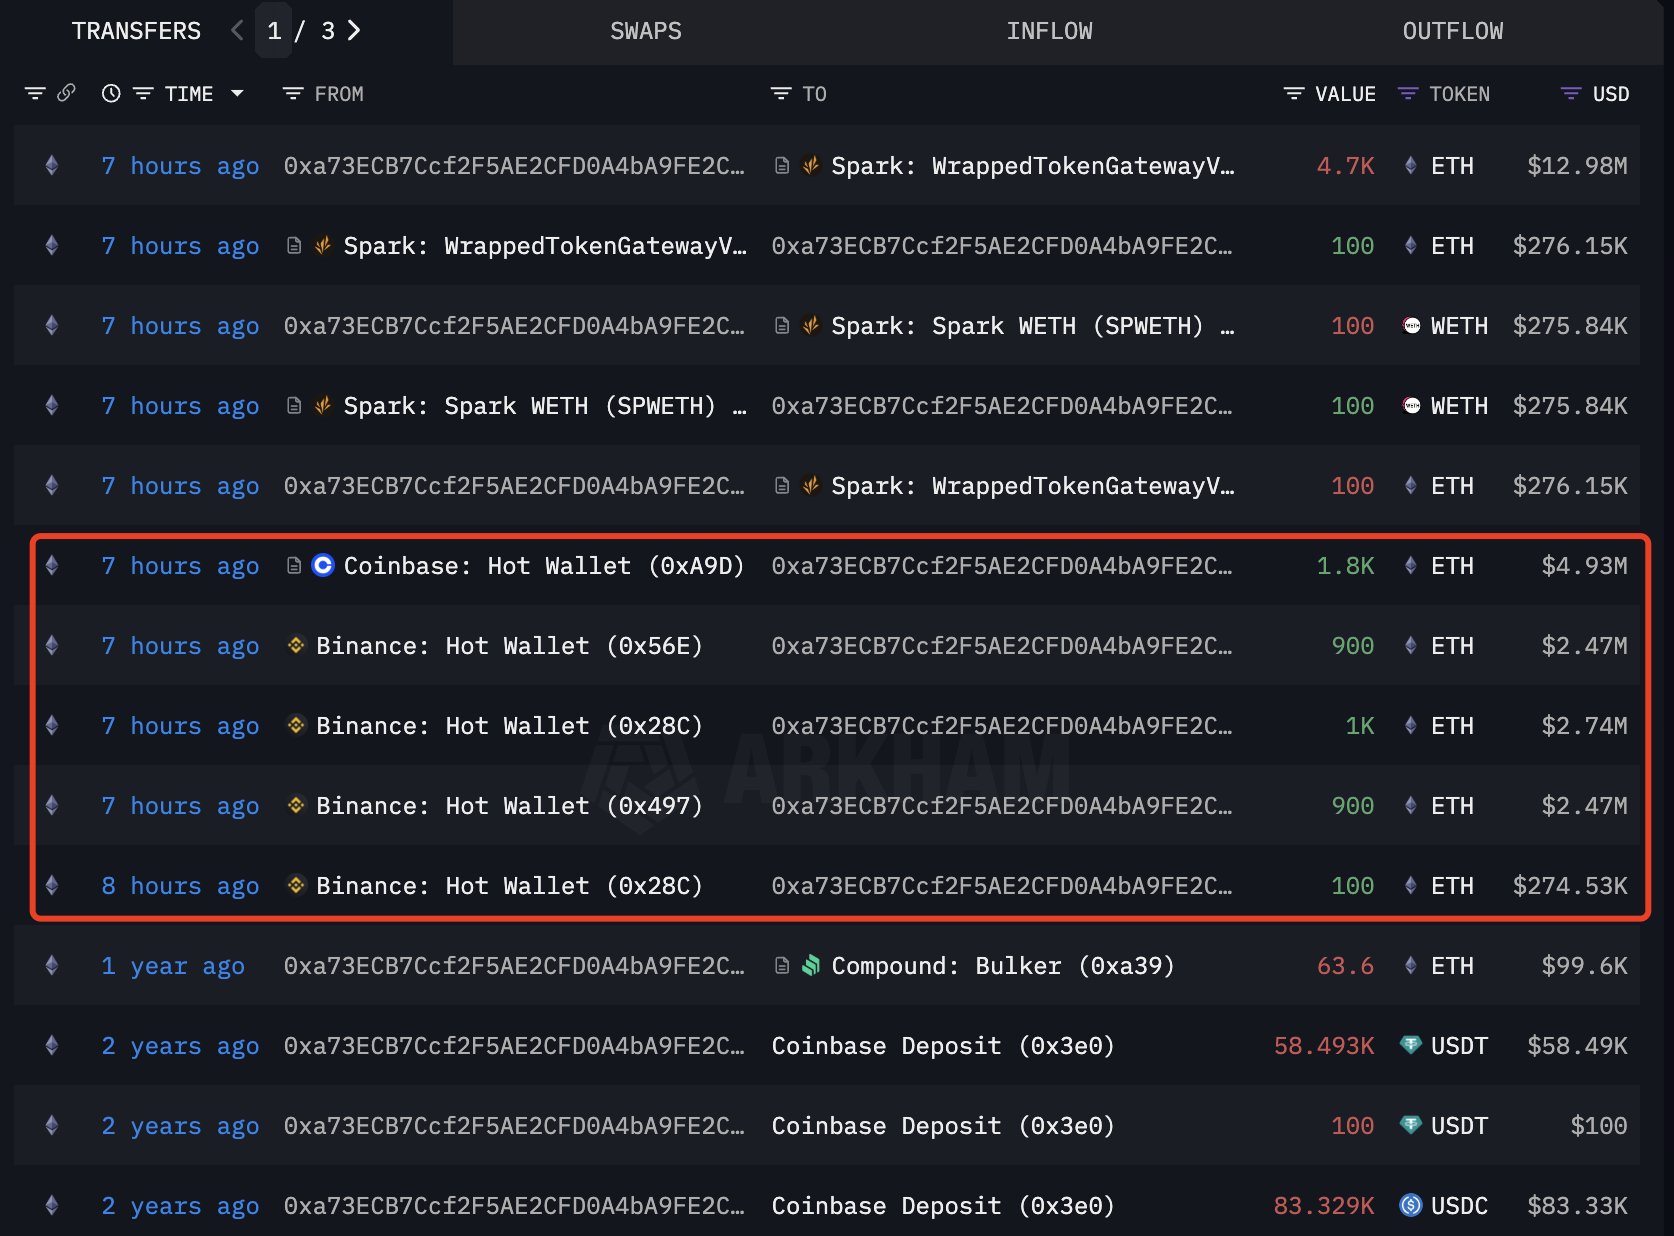
Amid the possibility of a new rally, Ethereum whales are returning to the market. A recent tweet from LookOnChain reveals that a dominant whale has returned to buy more Ethereum after nearly 500 days of inactivity.

The entity withdrew 4,700 ETH, worth nearly $13 million, from exchanges. The transfer of Ethereum to a new hot wallet reflects the whale’s confidence in the upcoming ETH price trend.

Image

Ethereum Network Activity on the Rise

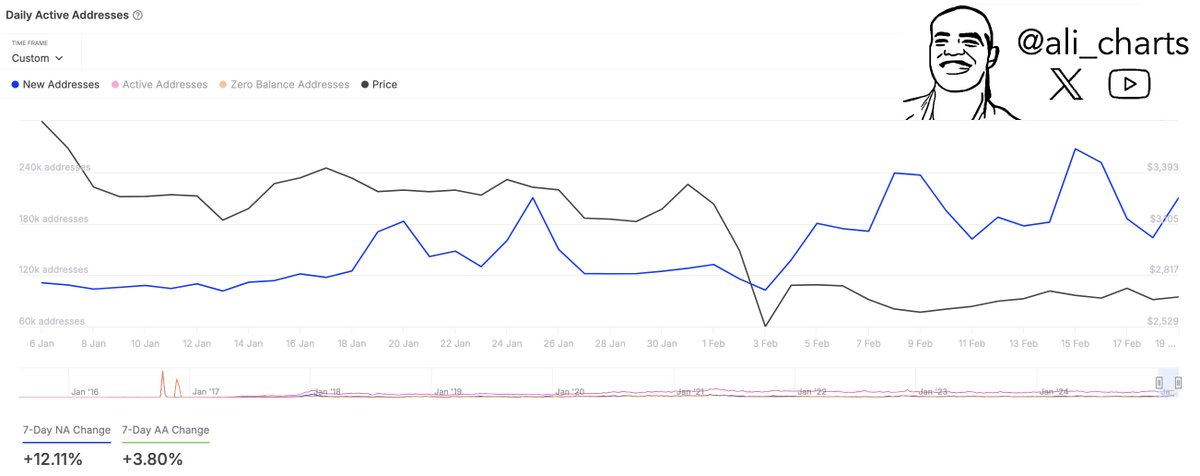
Meanwhile, Ethereum’s network activity is also improving significantly. A recent post by crypto analyst Ali Martinez shows that the number of new addresses on the Ethereum network has been rising steadily over the past week.

Daily active addresses have increased by 12.10% in the last week, surpassing 200,000.

Image

Institutional Demand Takes a Hit

Despite the rising bullish signals, institutional investments remain low. On February 20, the daily net flow for U.S. Ethereum spot ETFs was negative $13.09 million.

The key sellers were Grayscale and Fidelity. The Grayscale Ethereum Trust sold $10.34 million in Ethereum, while Fidelity offloaded $2.75 million.

Ethereum Price Targets: Can Bulls Push Beyond $3,000?

As positive signs support the possibility of a new bull run for Ethereum, the Fibonacci levels set new price targets.

If the uptrend surpasses the $3,000 mark, bullish targets extend from $3,241 to $3,591. On the flip side, the crucial support remains at $2,568.