Home Blog Page 954

Bitcoin Volatility Hits Record Lows: Here’s What This Means for the Market

0

Bitcoin volatility has dropped to record lows, a development that could attract more institutional interest.

Bitcoin’s price swings have long been a defining feature of the market. However, new data suggests that its volatility is now at record lows. This comes as institutional investors increasingly enter the space, leading to a more mature and resilient market.

Bitcoin’s Declining Volatility Shows Market Maturity

According to a report from Glassnode, Bitcoin’s three-month realized volatility has fallen to historically low levels. Unlike previous bull runs, where price swings regularly exceeded 80% to 100%, the current cycle has seen volatility stay below 50%. 
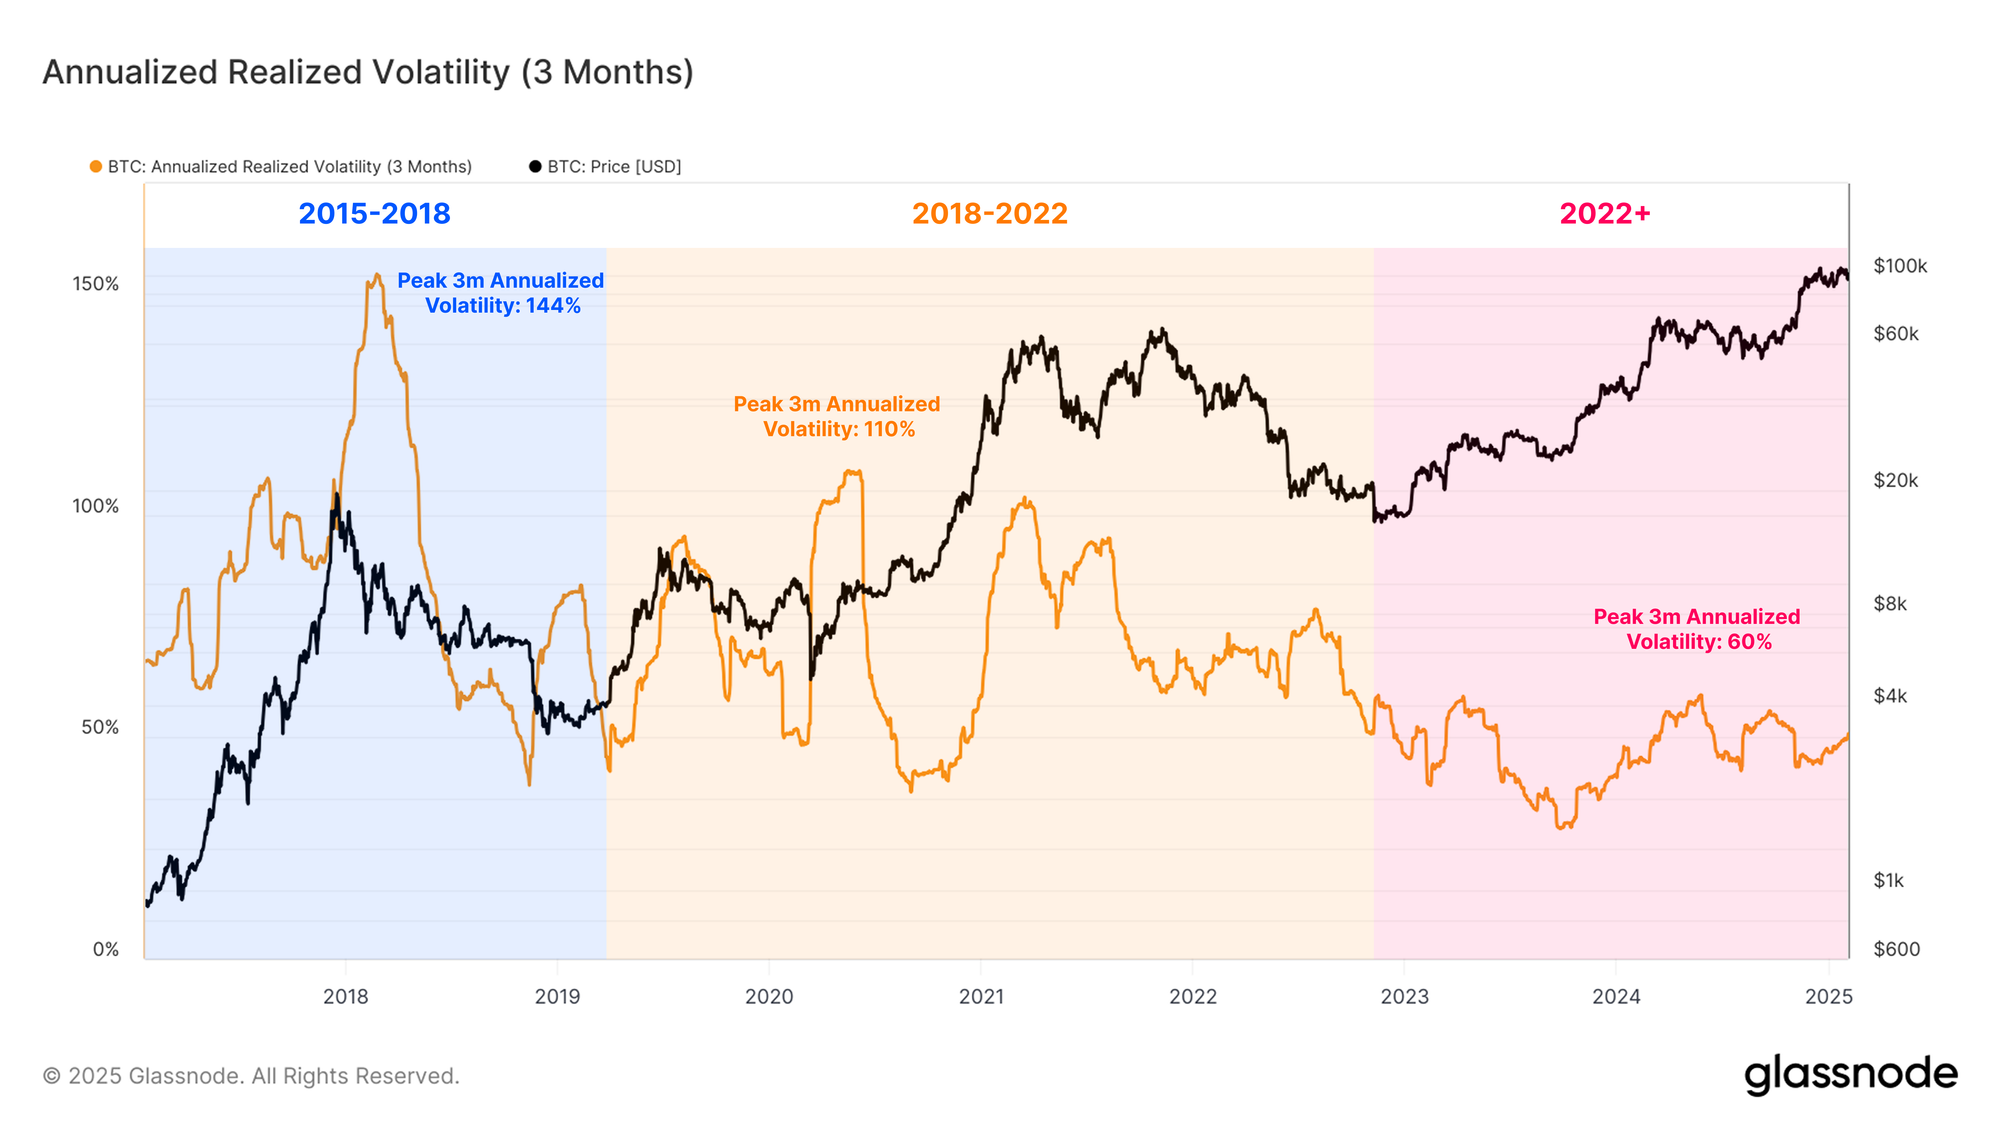
Bitcoin Annualized Realized Volatility Glassnode
Bitcoin Annualized Realized Volatility | Glassnode

This suggests that Bitcoin is stabilizing as an asset, making it more attractive to institutional investors who previously viewed its extreme price fluctuations as a risk.  

This drop in volatility syncs with another major trend suggesting that more sophisticated investors are dominating Bitcoin’s market. Glassnode noted that large entities are absorbing more BTC, leading to a more controlled market structure. 

Unlike previous cycles, where panic selling caused sharp drawdowns, this cycle has seen a more measured price correction process.  
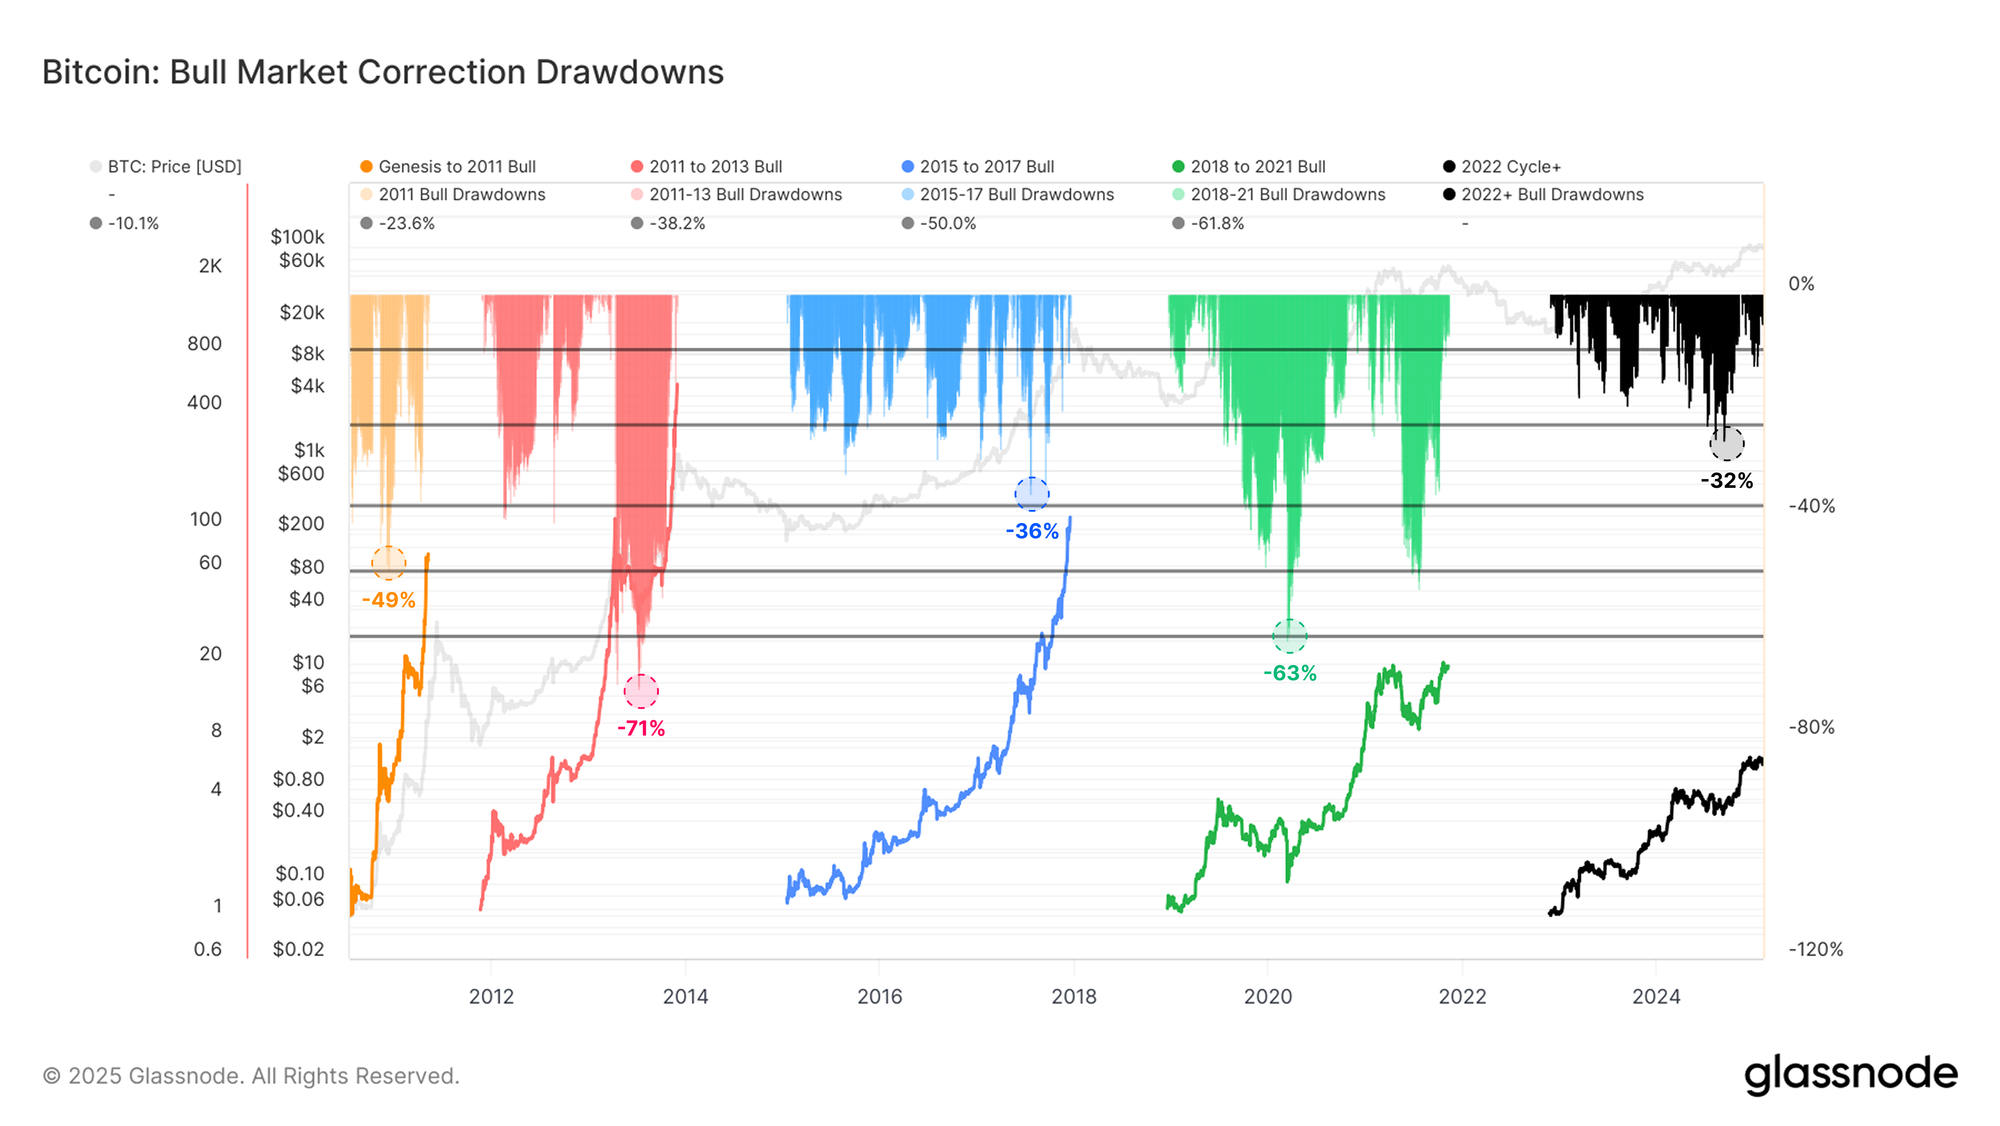
Bitcoin Bull Market Correction Drawdowns Glassnode
Bitcoin Bull Market Correction Drawdowns | Glassnode

Bitcoin’s reduced volatility has also contributed to a new price pattern. Instead of extreme highs followed by deep crashes, the market is experiencing “stair-stepping” growth. 

Notably, this means price rallies are now preceding periods of consolidation rather than sudden collapses. This stability could help Bitcoin gain further recognition as a legitimate store of value.  

Institutional Investors Driving the New Bitcoin Trend

The entrance of institutional investors has played a role in Bitcoin’s changing volatility profile. Glassnode highlighted that the launch of U.S. spot Bitcoin ETFs has provided regulated exposure to Bitcoin, allowing institutions to invest in a more structured way. 

These ETFs have already attracted over $40 billion in net inflows, contributing to a more stable market. Notably, BlackRock’s iShares Bitcoin Trust (IBIT) has led this charge.

Spot Bitcoin ETFs Trends Glassnode
Spot Bitcoin ETFs Trends | Glassnode

Additionally, Bitcoin’s role as a macroeconomic asset is expanding. Countries like El Salvador and Bhutan are investing heavily in Bitcoin, while the U.S. government is exploring its potential as a strategic reserve asset. 

Further, Bitcoin’s demand dynamics are different from past cycles. While the asset reached the $100,000 milestone, the inflow of new retail investors has been slower than in previous bull markets. Instead, large-scale investors have taken the lead, accumulating Bitcoin at a steady pace.  

Analysts Confirm Whale Accumulation Trend

Also, other market analysts have noted Bitcoin’s evolving investor base. Crypto behavior analytics firm Santiment observed that whales have been accumulating more coins amid the latest price dip. 

Their data showed that over 135 wallets holding at least 100 BTC were added in February, while the number of smaller wallets decreased by over 138,000.  

This indicates that experienced investors see Bitcoin’s dip as a buying opportunity, while newer traders—many of whom entered in the past six months—are selling due to short-term volatility. Historically, when whales accumulate BTC during a market decline, it often shows an upcoming price rebound.  

Meanwhile, crypto analytics firm Unfolded reported that Bitcoin’s annual volatility has dropped to its lowest level ever. Despite this, its risk-adjusted returns remain higher than most major asset classes. This strengthens the case for Bitcoin as a viable long-term investment. Currently, BTC trades for $97,407, down 0.92% in the past 24 hours.

Bitcoin Volatility
Bitcoin Volatility

Whales Scoop 750,000,000 Dogecoin at Dip Price: Will a 300% Pump Follow?

0

The most recent price slump in Dogecoin (DOGE) has seen whales massively loading their bags ahead of what could come.

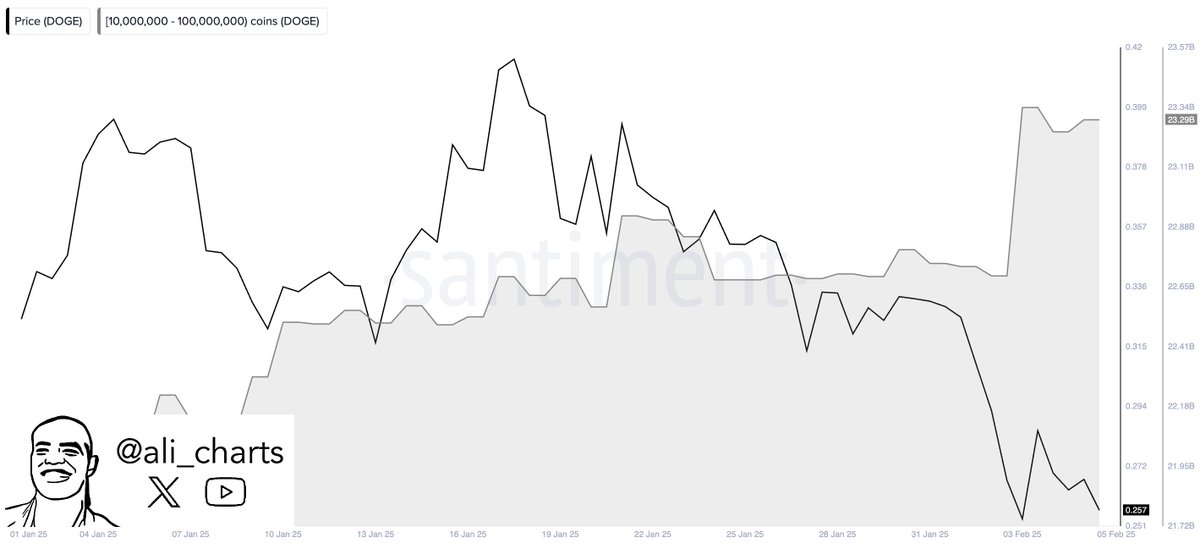
In a tweet today, market watcher Ali Martinez disclosed that whales took advantage of the recent dip and purchased 750 million DOGE tokens. He stressed that this move is a clear indication of strong confidence in the market.

Whales Scooping Dogecoin Dip

For context, on Tuesday, the price of Dogecoin tanked to $0.2017, coming dangerously close to losing the $0.2 psychological level, which it has traded above since November 2024. 

Notably, this downtrend began three weeks ago when Dogecoin reached a new 2025 high of $0.4335. It continued with consistent lower lows until the trend worsened on February 4.

During this time, whales holding between 10 million and 100 million DOGE coins increased their holdings. Specifically, their portfolios grew from around 22.5 billion to 23.34 billion DOGE, adding approximately 750 million tokens.

This accumulation took place in a single day, immediately after Dogecoin retested the $0.2 lows on February 4. Essentially, the whales saw the drop to $0.2 as an ideal entry point, positioning themselves for the next major rebound.

The immediate impact of the buying pressure saw Dogecoin briefly bounce back to $0.2885 the same day before retracement continued.

Image
chart showing Dogecoin whales accumulating amid dip

Recall that higher tier Dogecoin whales, those holding 100 million to 1 billion tokens, had liquidated 270 million tokens two days ahead of the landslide crash. Their perfectly timed exit played out well, as they sold Dogecoin while it was trading in the $0.3 range.

Now, they are buying back at the bottom around $0.2, suggesting a trend reversal could be imminent.

DOGE Still Selling at Discount

Meanwhile, at press time, Dogecoin has yet to fully recover from the Tuesday dip. At $0.2597, Dogecoin is selling at a 22% discount from the higher threshold it reached last week. Moreover, the current price reflects a more significant discount of 33% from its monthly high.

How Soon Will Dogecoin Rebound?

While Martinez is confident that the whale accumulation implies confidence in a turnaround, he offered no insight into where Dogecoin could target in the short term.

Meanwhile, Analyst Cas Abbé suggested that the ongoing pattern looks very similar to Q3 2024, where a big crash was followed by a few weeks of consolidation. 

He suggested that the ongoing ranging pattern could last a few weeks before a parabolic rally, where Dogecoin could pump 300% over a 4- to 6-week window, as seen late last year.

“I think this time it won’t be any different,” he said.

Bitcoin to $500K and Ethereum to $20K This Cycle? Why This Analyst Thinks So

0

MN Consultancy founder Michaël van de Poppe sees Bitcoin and the broader crypto market running significantly higher this cycle.

Amid stalling prices and recent market uncertainty, speculation continues to grow that Bitcoin and the broader crypto market have peaked or are near their cycle peak. According to one prominent analyst, however, there may not be a better time to be in the market. 

“The Perfect Storm”

MN Consultancy founder Michaël van de Poppe sees Bitcoin and the broader crypto market running significantly higher this cycle.

In an X post on Wednesday, February 5, the analyst asserted that current market conditions created “the perfect storm” for Bitcoin to hit $500,000 and Ethereum to reach $20,000, despite recent significant price corrections due to trade war fears.

The analyst expressed this view, citing the recent pro-crypto pivot of the U.S. government under the Donald Trump administration, institutional adoption, and pathways for bank custody.

“we’re currently in an ecosystem that has the most bullish government ever standing behind the whole perspective of tokenizing all assets, decentralized ecosystems and the adoption of Bitcoin into governments balance sheets,” van de Poppe wrote.

“It’s actually within the perfect storm of a bull market we’ve not seen before,” he added.

Specifically, the analyst suggests that the current cycle will be on par with the 1995 to 1999 dot com bubble or the 2017 crypto bull market, where valuations will rise far above expectations. For context, the 2017 crypto market rally saw Bitcoin do a 20x from around the $1,000 price point to close to $20,000.

The analyst believes that there are two possible outcomes amid current market conditions. 

The first is that the bubble will occur this year in line with the standard four-year cycle, and the market will peak at the end of the year, with Bitcoin trading between $300,000 and $500,000. On the other hand, he suggested that the altcoin bear market could drag on for longer, leaving room for two more years of bull markets with Bitcoin headed to $1 million.

Meanwhile, he contended that those who believe that the market has peaked or will peak when Bitcoin hits $150,000 are too focused on the concept of diminishing returns without considering the bullish momentum from the U.S. government’s recent pivot.

Moreover, the analyst argued that even the U.S. looming trade war with China would benefit the crypto market. He anticipates that China will shift focus to its internal market and try to strengthen its currency by selling dollars to repurchase it. The analyst says this will weaken bond yields and the dollar, likely favoring altcoins.

Despite van de Poppe’s bullish long-term stance, the market may still face volatility in the short term.

50K BTC on the Move

On Wednesday, crypto analytics firm CryptoQuant warned of impending downward market volatility as it disclosed that nearly 50,000 BTC worth almost $5 billion was on the move for the first time in six to 12 months.

According to the report, most of these assets would likely be sold in the coming days, triggering a short-term sell-off. At the time of writing, however, Bitcoin is trading at the $99,000 price point, up 1% on the day.

Cardano ETP Goes Live on Nasdaq Helsinki Stock Exchange

0

Leading Sweden-based digital asset manager Virtune has launched a Cardano (ADA) exchange-traded product (ETP) in Finland. 

According to a press release, the Virtune Staked Cardano ETP fund was listed on the Nasdaq Helsinki Stock Exchange yesterday under the ticker VIRADAE. Following its listing, VIRADAE’s trading began immediately on February 5, 2025. 

Virtune Staked Cardano ETP Features 

Notably, the newly launched Cardano ETP offers retail and institutional investors a direct 1:1 exposure to ADA. Also, investors will enjoy an additional 2% annual return from staking rewards on the financial instrument, which will be added continuously and reflected in the ETP’s daily price. 

Per the press release, the Cardano ETP is 100% physically backed by ADA, offering a 1.49% management fee. The ADA coins backing the ETP are stored in Coinbase’s cold storage. 

Virtune tailored the Cardano ETP for European investors, focusing on those residing in Finland by denominating the product in euros (EUR). 

Virune’s Crypto ETP Offerings  

In addition to the Cardano ETP, Virtune launched another crypto exchange-traded product tied to Avalanche (AVAX) yesterday. 

Like the Cardano ETP, the Virtune Avalanche ETP (VIRAVAXE) is fully backed by AVAX. It also offers investors a 1:1 exposure to the underlying coin. Likewise, VIRAVAXE comes with a 1.49% management fee, with an additional 2% annual return from staking rewards. 

Following the launch of Virtune’s Cardano and Avalanche ETPs, the company now offers seven crypto-related exchange-traded products in Finland. 

The other five ETPs include Virtune Bitcoin ETP, XRP ETP, Staked Solana ETP, Staked Ethereum ETP, and Crypto Altcoin Index ETP. 

Virtune launched these financial products two weeks ago, exposing investors to their underlying crypto assets. 

Analyst Predicts Monster Parabolic Rally for ADA

In the meantime, Cardano ranks as the ninth-biggest cryptocurrency, with a market cap of $26.22 billion. Priced at $0.7482, ADA is down 2.87% in the past 24 hours and 22.5% in one week. 

ADAUSDT 2025 02 06 15 01 30
ADAUSDT | TradingView

Despite ADA’s recent underperformance, prominent market observer Ali Martinez referenced the asset’s historical data to forecast a ‘monster parabolic rally.’ According to Martinez, this monster rally could take Cardano’s price to $15 per token, marking a surge of 1,904% from the current price. 

Here’s the Bitcoin Cycle Top According to These Indicators

0

Prominent crypto analyst “EGRAG CRYPTO” is the latest to try to answer the question of where the Bitcoin top could be.

Since Bitcoin first surged over the $100,000 price point in December 2024, the key question on the mind of most investors has been whether the asset still has room for more upside and, if so, where it could go. Yet another analyst has lent their voice to this debate.

Likely Bitcoin Top Based on Fibs and MAs

Prominent crypto analyst “EGRAG CRYPTO” is the latest to try to answer the question of where the Bitcoin top could be.

According to the analyst, the leading digital asset is likely to top out between the $170,000 to $200,000 price range, with a highly bullish case seeing the asset top out between the $250,000 to $350,000 price range.

EGRAG CRYPTO arrives at these targets using several indicators. These indicators include Fibonacci retracements, Fibonacci arcs, Fibonacci circles, and the 10-period moving average, which he expects price tends to respect on the monthly time frame.

Fibonacci retracements, Fibonacci arcs, and Fibonacci circles are indicators based on the enigmatic Fibonacci sequence used to predict levels where prices could bounce or reject depending on the trend. Moving averages, on the other hand, help traders identify the market trend by taking the average closing price for a given number of periods.

According to EGRAG CRYPTO, the closely watched 1.618 Fibonacci level and the 1.888 Fib Circle point to $171,000 and $170,000, respectively, as the possible cycle top. The analyst also gets the same reading with the Fibonacci arc.

The analyst measures the price difference between cycle tops and their last touch of the 10-period MA on the monthly chart to obtain the blow-off top scenario. In the first cycle, the asset enjoyed a further 460% rally after bouncing off the 10 MA; in the second cycle, it was 1,000%, and in the last cycle, this upside amounted to 500%.

Taking the current last touch of the 10 MA with a 460% increase, EGRAG CRYPTO predicts a maximum blow-off top price of $365,000.

At the time of writing, Bitcoin continues to trade just shy of the $100,000 price point at around $98,500, presenting at least 73% upside potential in the analyst’s base case and an over 255% upside in the best case.

Standard Chartered Gives 3-Year Bitcoin Outlook, Predicts Surge to $500,000

0

Crypto-friendly banking giant Standard Chartered has predicted that Bitcoin will surge multiple times to half a million dollars in three years.

In an emailed analysis, the Standard Chartered head of crypto research, Geoffrey Kendrick, speculated a meteoric rise in Bitcoin’s price, specifically predicting a surge to $500,000. The seasoned market expert hinged his bold prediction on growing access and diminishing volatility on the flagship crypto asset.

Factors to Drive Price Appreciation

Kendrick asserted that the staggering uptrend would come from increased access to Bitcoin. The Standard Chartered exec highlighted Donald Trump’s impact in opening the asset up for global exposure.

The U.S. president has continually flirted with the sector since he declared interest in running for a second term in the White House. Under his administration, Trump promised to allow digital assets to thrive by creating clear regulations and a strategic Bitcoin reserve.

Meanwhile, Kendrick also pointed to the January 2024-launched US Bitcoin spot exchange-traded funds (ETFs) as an incredible exposure source. The traditional investment vehicle quickly gained traction after its market debut, raking in a cumulative net inflow of $40.67 billion so far.

He believes spot ETFs have attracted institutional investors to the Bitcoin market and expects more from the products. Comparatively, he predicted that Bitcoin would see a similar effect as gold when an ETP tracking the precious metal’s performance debuted.

For context, gold grew 4.3 times in seven years after the launch of exchange-traded products mirroring the asset class in 2004. As a result, Kendrick inferred that the maturing Bitcoin ETF would contribute to a similar surge in two years.

Bitcoin’s Dwindling Volatility to Sustain Uptrend

Meanwhile, the Standard Chartered executive also predicted that reduced Bitcoin volatility would contribute immensely to the meteoric rise. The pioneering cryptocurrency is notorious for its intense price fluctuation, as seen on Monday.

However, Kendrick expects the price volatility to cool as the Bitcoin ETFs mature. He insinuated that as large capital flows into Bitcoin, the asset could gain more stability, which is necessary for a sustainable long-term upward trajectory.

Trump’s Friendly Stance to Drive Upsurge

Moreover, the report stated that Trump’s warm embrace would steer Bitcoin in the right direction. The president recently signed an executive order to create a digital asset working committee that would make America the crypto capital of the world.

Furthermore, he has freshened things in the regulatory sphere, appointing Paul Atkins as the new Securities and Exchange Commission (SEC) chair and Mark Uyeda to act in the capacity pending his assumption of office.

Under the new administration, the SEC has repealed the Staff Accounting Bulletin (SAB121), giving financial institutions access to hold digital assets in their balance sheets.

Meanwhile, the growing momentum that the United States would create a national Bitcoin stockpile is drawing global attention. Kendrick noted that the initiative will steer other countries to look Bitcoin’s way, expanding adoption.

Based on these points, Standard Chartered predicted that Bitcoin will reach $200,000 by the end of 2025, $300,000 next year, $400,000 the year after, and $500,000 by the year-end of 2028.

135 New Bitcoin Wallets Holding 100+ BTC Emerge as Retailers Cut Losses: Here’s What It Means

0

Santiment has reported that 135 new Bitcoin wallets have emerged in February, each holding 100 or more BTC, as retail traders exit the market amid ongoing volatility.

Recently, Bitcoin experienced significant price swings. It surged by over $10,000 within 12 hours, briefly reaching over $102,000 before retracing to around $96,000 and stabilizing at approximately $99,000.

Amid these fluctuations, on-chain data reveals increased accumulation activity among large holders while smaller investors have been trimming their positions.

Bitcoin Whales Accumulate as Retailers Exit

Market intelligence platform Santiment has highlighted these shifts in Bitcoin ownership. The report reveals that large holders have acquired more BTC tokens amid recent price swings. 

In February, there were 135 new wallets holding at least 100 BTC, while the number of wallets holding less than 100 BTC dropped by 138,680.

This trend suggests that traders who joined the Bitcoin market within the last six months have been exiting their positions amid volatility.

Santiment notes that this is an ideal setup for crypto market to rise. However, the generally bullish impact of coins being absorbed by whales may take a few more weeks or even months to materialize.

Image
Image of Bitcoin whale accumulation by Santiment

Categorizing Bitcoin Holders

Another analysis from IntoTheBlock adds weight to the data from Santiment. Over the past 30 days, Bitcoin whale holdings have remained unchanged, while investor holdings increased by 0.71%. Meanwhile, retail traders recorded a slight decrease of 0.01% in Bitcoin holdings.

The numbers in the whale segment suggest that the largest holders have remained positive, while mid-sized investors have been accumulating more BTC.

Bitcoin Historical Concentration

Inflows Into Accumulation Addresses

Data from CryptoQuant further emphasizes rising accumulation activity among large Bitcoin holders. On February 4, whale accumulation wallets received 31,226 BTC, valued at approximately $3 billion at current market prices. These inflows align with an ongoing trend of acquisitions by these addresses over the past week.

According to CryptoQuant’s Ki Young Ju, these transactions indicate the transfer of Bitcoin into custody wallets following over-the-counter (OTC) trades. He noted that such movements often suggest strategic accumulation by large holders seeking to exploit market fluctuations.

Solana Bulls Target $350 as Double Bottom Takes Shape

As Solana struggles near the $200 psychological mark, is a bullish comeback to $350 possible?

With the crypto market bouncing back to $3.24 trillion, Solana is aiming for a bullish reversal. As SOL sustains above the $200 psychological mark despite the 1.12% fall over the past 24 hours, the altcoin looks to reclaim its $100 billion market cap.

Solana Aims For Double Bottom Reversal

In the daily chart, the SOL price trend reveals the possibility of a double-bottom reversal. This bullish pattern arises as Solana takes support from the 23.6% Fibonacci level at $196.48.

Solana Price Chart
Solana Price Chart

Supporting the upside chances, the daily RSI line reveals a bullish divergence in the double-bottom pattern. The neckline of the bullish pattern stands near the $216 mark. However, the recovery to the neckline might be slow as the super trend indicator reflects a bearish trend at play.

Analyst Puts Solana on a Wedge

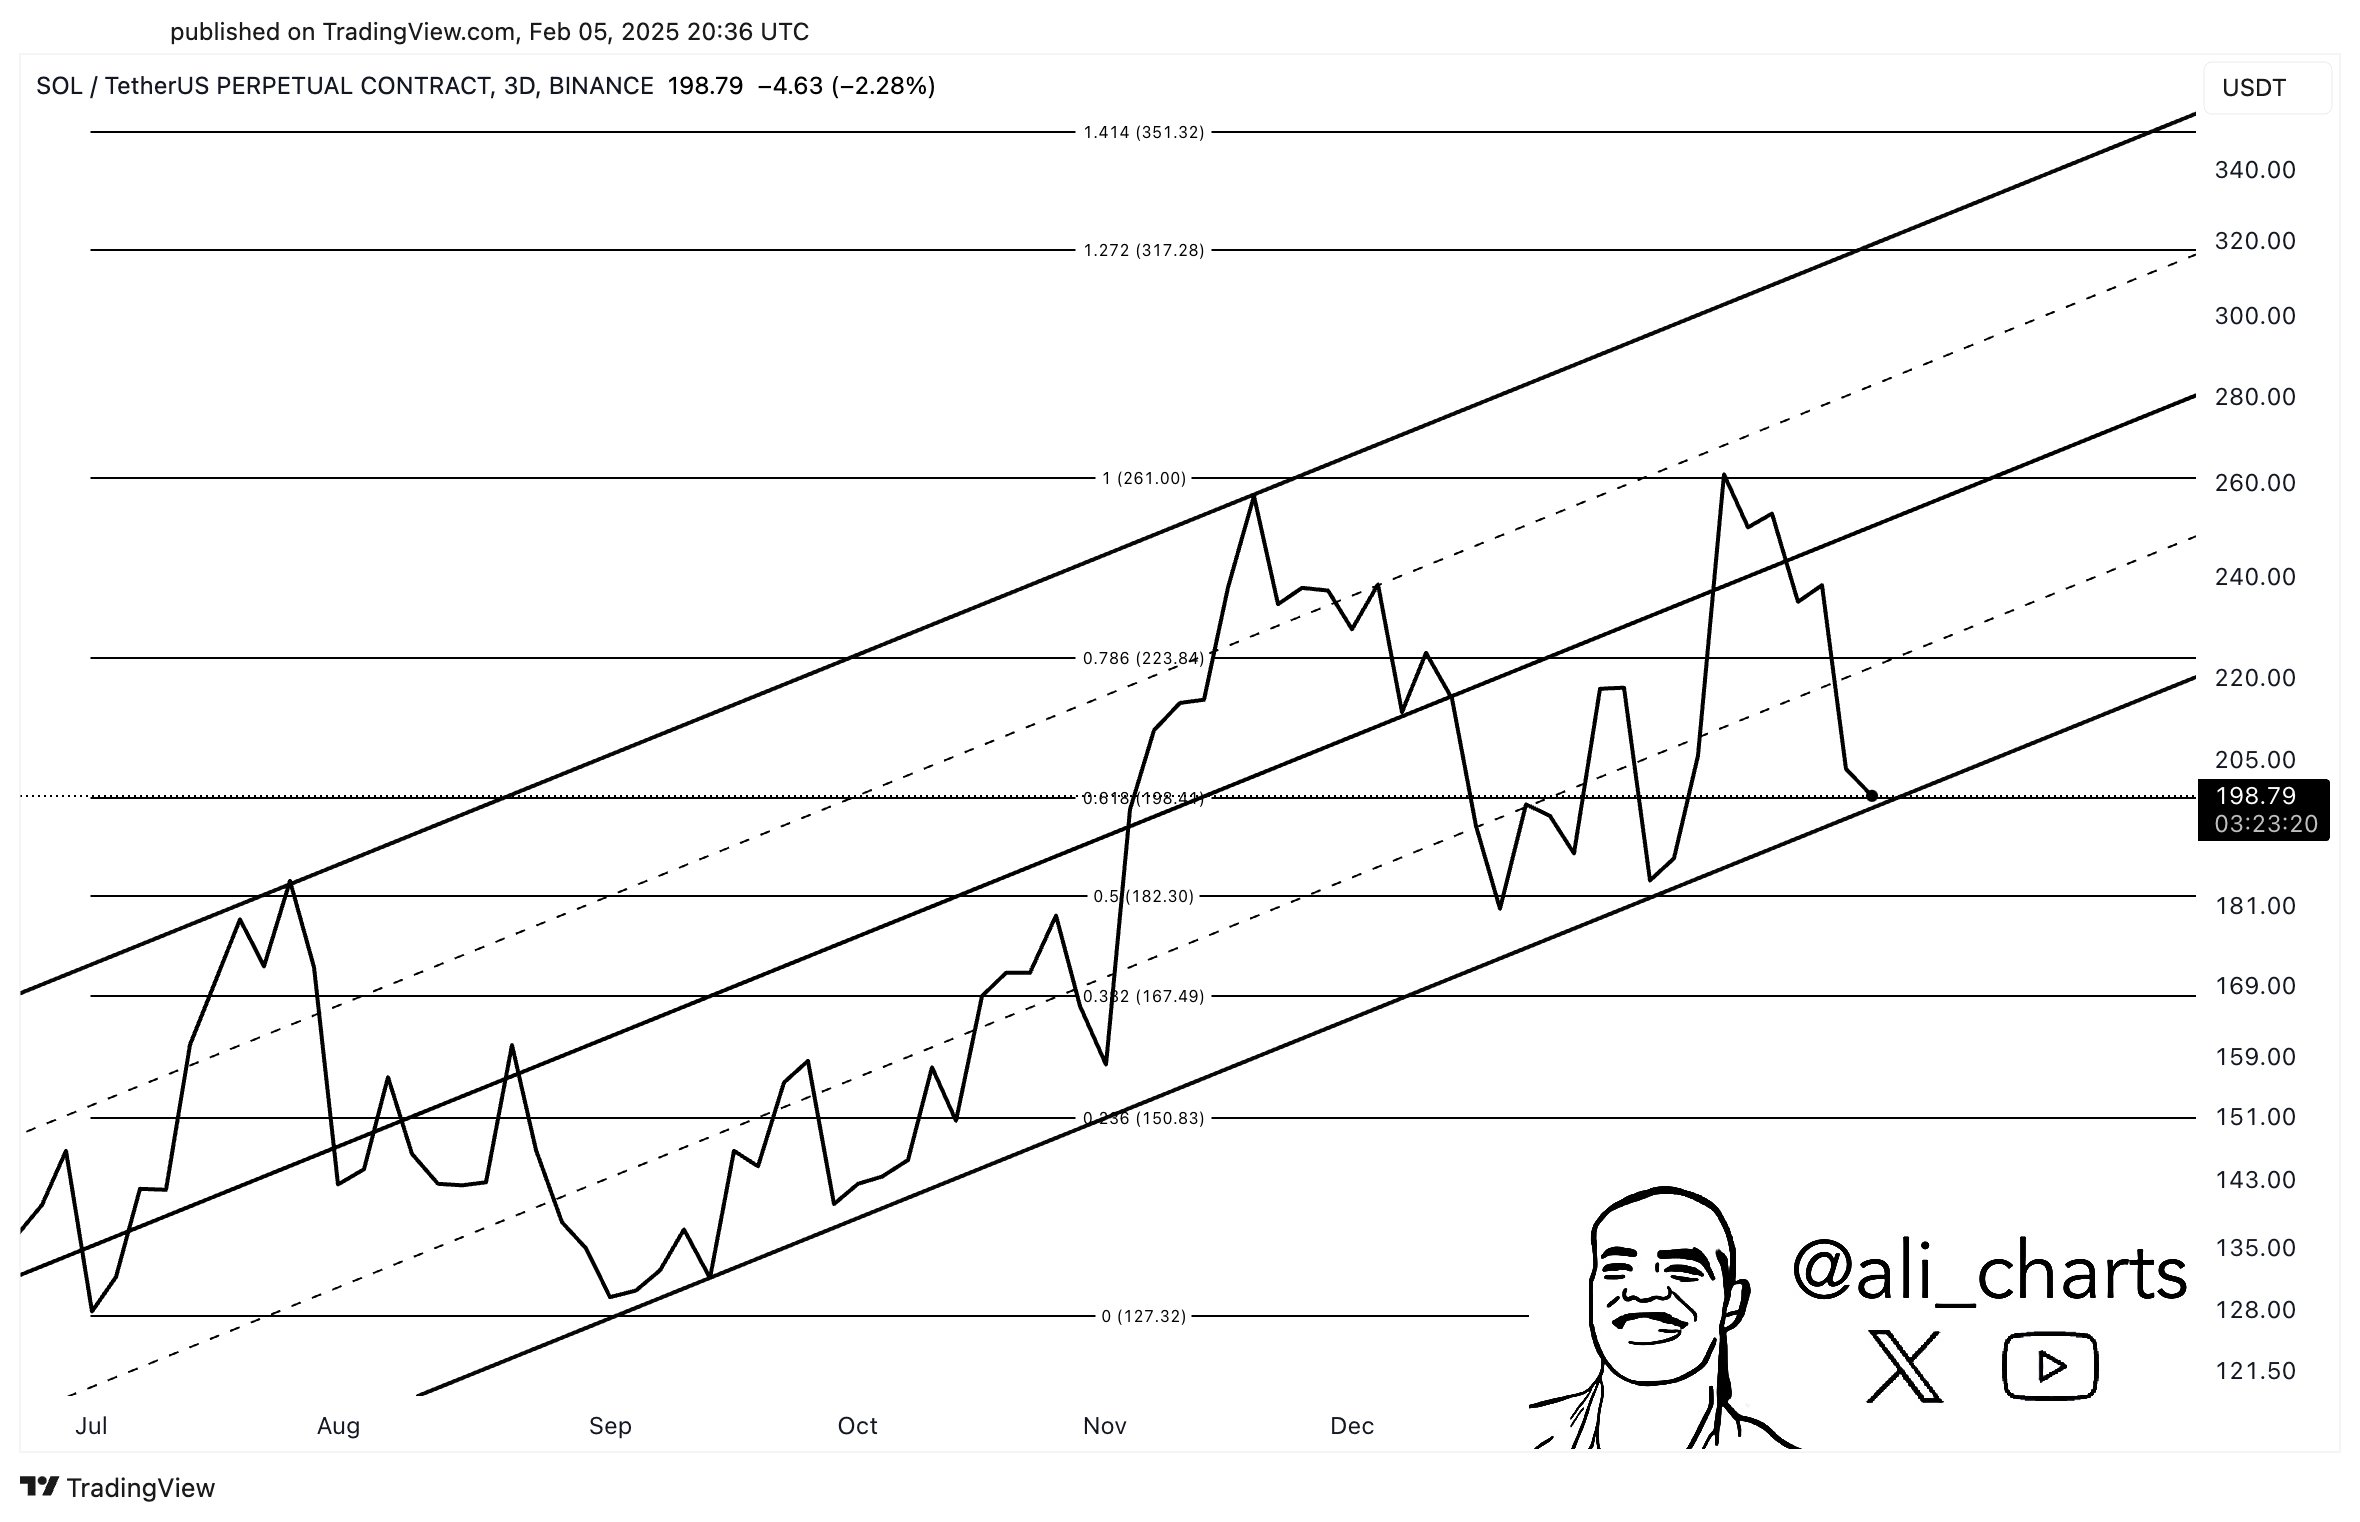
In a recent post on X, Ali Martinez highlighted that Solana stands at a crucial crossroads. The analyst highlighted a rising channel pattern in the Solana price trend over the three-day chart.

“This is the moment for absolute conviction,” he said. Martinez highlights the crucial point for Solana at the $198 support. This coincides with the $61.80 Fibonacci level and tests the local support trendline.

A bearish closing under this will likely test the $150 psychological support. However, a bullish comeback might lead SOL to test the 1.414 Fibonacci level near the $350 milestone.

Image

Is Solana Ready For A Comeback?

As Solana prepares for a double-bottom reversal, the uptrend will likely continue within Martinez’s rising channel pattern. In the short term, the double-bottom breakout will likely challenge the $250 psychological mark, followed by the critical resistance at $285.

Optimistically, with the broader market recovery, the $350 milestone is a potential price target on the bullish radars. On the flip side, the $175 mark and the $150 psychological level remain crucial support for Solana.

Leading Crypto Exchange Encourages XRP Holders Not to Sell Their Bags

0

In a recent disclosure, the top crypto exchange Bitstamp has urged XRP holders not to sell their bags.

Bitstamp, one of the world’s leading and oldest crypto exchanges, captured the XRP community’s attention with its recent social media campaign aimed at promoting the crypto asset. 

The exchange’s latest effort involves a creative version of the popular UNO game meme, where players are often humorously depicted choosing extreme options over easier alternatives.

Bitstamp’s UNO Meme Shows XRP Loyalty

In its post on X, Bitstamp shared an image of the popular UNO game meme. However, this time, the message on the meme reads: “Sell your XRP or draw 25.”

Notably, the second section of the image shows a person holding a massive stack of cards, symbolizing their refusal to sell XRP, instead opting to draw 25. Interestingly, the humorous portrayal resonated strongly within the crypto community, as it encouraged investors to hold onto their XRP bags.

The depiction comes at an opportune time as the crypto market turbulence has impacted altcoins like XRP severely. For context, XRP is down 21% over the past week, having given up the pivotal $3 psychological mark on the back of the recent crash.

Amid this price turbulence, it can be natural for investors to consider panic selling. Nonetheless, several analysts have discouraged this approach, suggesting that XRP could record more impressive price upswings after this downturn. Bitstamp’s latest disclosure also seeks to discourage investors from selling off their XRP bags.

Bitstamp and Gemini Bullish on XRP

This recent campaign is not Bitstamp’s first attempt at engaging the XRP community. The exchange has a history of promoting the token and rallying its supporters through social media campaigns.  

For instance, on Dec. 20, 2024, Bitstamp posted an optimistic message about XRP, suggesting it would make history in 2025. The post quickly amassed 1.8 million views, triggering speculations of significant developments for XRP this year.

Further, in November 2024, as XRP’s value surged dramatically following Donald Trump’s election victory, Bitstamp shared a video of a rocket adorned with XRP’s logo. 

The video depicted the rocket soaring skyward with a caption celebrating XRP’s upward trajectory. Moreover, in July 2024, prior to XRP’s meteoric rise, Bitstamp shared an image of the moon embedded with the XRP logo. 

Meanwhile, Bitstamp is not the only exchange championing XRP. Gemini, another leading exchange, has also shown strong support for the token. The exchange listed XRP in August 2023, following the landmark court ruling in the Ripple vs. SEC case, which clarified that XRP was not inherently a security.  

Shortly after the listing, Gemini launched a daily XRP faucet, allowing a user to claim 20 XRP tokens daily for one week. At the time, these tokens were worth $10 but have since risen in value to $48 at press time.  

In January 2024, Gemini continued its promotional efforts by sharing an enthusiastic post on X about its support for XRP. A day later, the crypto exchange introduced XRP perpetual contracts on its platform.

Ethereum Bulls Charge Forward: Can ETH Break $3,000?

With Ethereum breaking past $2,800, will buyers restart the bull run to surpass the $3,000 psychological mark?

As Bitcoin struggles to reclaim the $100,000 mark, Ethereum faces resistance above $2,800. Currently, Ethereum trades at $2,840, marking a 4.52% surge in the past 24 hours.

However, the bullish recovery faces strong resistance, hinting at a potential failure. Is Ethereum bound for another rejection, or is a breakout rally imminent?

Ethereum Price Trend Analysis

In the 4-hour price chart, Ethereum reveals a breakdown rally from a local support trendline. However, with a quick V-shaped reversal and a rounding bottom pattern, ETH is on the verge of reinstating its bullish trend.

Ethereum Price Chart

As the reversal rally re-challenges the broken resistance trendline, the 23.60% Fibonacci level near $2,900 is a key resistance. Ethereum bulls must surpass this level to confirm a bullish comeback.

The 4-hour RSI is on the verge of crossing above the halfway level. With no signs of bearish divergence, the uptrend remains intact.

Additionally, the Keltner channel reveals a sharp uptrend in the lower band. Ethereum is now trading above the 20-day moving average, further supporting the bullish momentum.

Institutional Ethereum Demand Grows

Furthermore, institutional interest in Ethereum is rising. On February 5, U.S. spot Ethereum ETFs recorded a daily net inflow of $11.11 million. Fidelity acquired $20.06 million, while Grayscale saw a $5.21 million inflow.

Ethereum ETFs
Ethereum ETFs

Meanwhile, Grayscale saw a $7.16 million outflow. Aside from the ETF market, institutional accumulation is also observable. Institutional market maker Cumberland recently bought 62,381 ETH worth nearly $174 million and transferred it to Coinbase Prime.

On-Chain Data Suggests a Smooth Path to $3,000

As the institutional demand grows, Ethereum is likely to scale higher. Adding to the bullish thought, the on-chain indicator In/Out of money around price reveals a potentially smooth pathway.

Ethereum Onchain
Ethereum Onchain

Based on the volumes, the price band between $2,488 and $3,257 reflects a low volume area. The incoming supply zone between $2,832 and $2,913 holds a supply of 3.58 million ETH.

While the current at-the-money zone between $2,827 and $2,832 holds a mere 38.81K ETH, the crucial support between $2,746 and $2,827 holds more than 3 million ETH volume.

Hence, with the short-term changes in the Ethereum landscape, the bulls will likely overcome the immediate supply to challenge the $3,000 psychological zone.

Ethereum Next Move: Breakout to $3,000?

With institutional support growing and on-chain metrics favoring demand, Ethereum appears poised to overcome the immediate supply zone. If successful, ETH could challenge the key $3,000 psychological level.