
VeChain six hours price chart shows that the Golden Cross is quickly approaching, which suggests higher prices.
VeChain rebounded from the 50-week SMA. It posted a 15.22% increase last week and ended July with a slight decline of -1.65%.
VeChain price has increased 45.88% since July 21. This brings the cryptocurrency closer to the resistance of $0.099, where 200-day SMA is waiting to act as resistance $ 0.097.
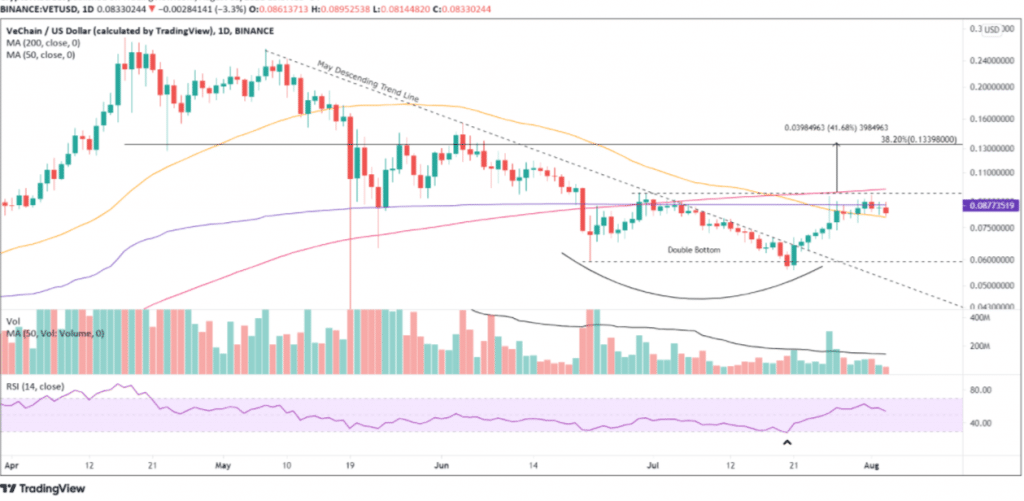
VET is expected to make a sharp turn in the next few days. The upside move will attempt to overcome the 200-day SMA. If VET can break 200 SMA moving average resistance It will then test the 38.2% Fibonacci level at $ 0.133. This is a 58% increase. Due to price congestion in May and June, the 38.2% Fibonacci level will likely act as a strong resistance.
Read: Why So Many Multi Billion Dollar Business Chose VeChain To Build Their Blockchain Solutions?

The bullish Golden Cross:
The bullish Golden Cross displayed on the six-hour VeChain chart, will occur When the 50 six-hour SMA crosses over the 200 six-hour SMA. The November 2020 Golden Cross was the last on the six-hour chart, which resulted in a significant advance that made April’s high.
On the other side if resistance gains strength, and bears takes control, The downside is only protected by the 50-day SMA present at $ 0.08.
Read: Vechain CEO, Sunny Lu Interview By Fenbushi Capital
If the important moving average support brakes, This next major support levels are at $0.073. A more deeper correction could lead Vechain price to $0.059.
Michaël van de Poppe Vechain Analysis:
Michaël van de Poppe, The well-know trader, and technical analysis expert from Amsterdam Stock Exchange, gave his Vechain analysis.
He said on Twitter:
“VeChain is following the path.
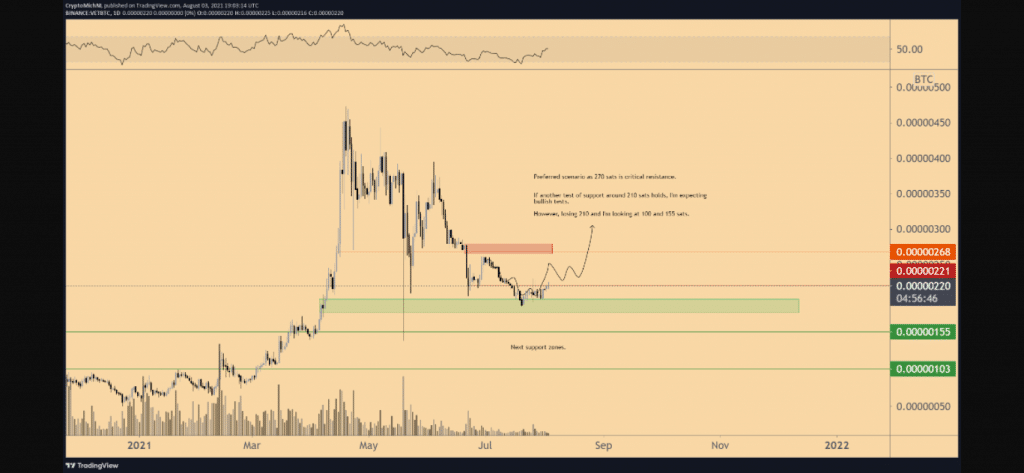
For VET/BTC pair, Preferred scenario as 270 sats is critical resistance.
If another test of support around 210 sats holds, i am expecting bullish tests.
However loosing 210, i am looking at 100 and 155 sats.”