

Renowned market analyst Ali Martinez recently shared a Bitcoin (BTC) strategy that traders could leverage to time the market appropriately using the RSI indicator.
In his short analysis, Ali pointed out that over the past month, Bitcoin on the 4-hour chart has been displaying a Relative Strength Index (RSI) figure that has proven to be a reliable indicator of local tops and bottoms.
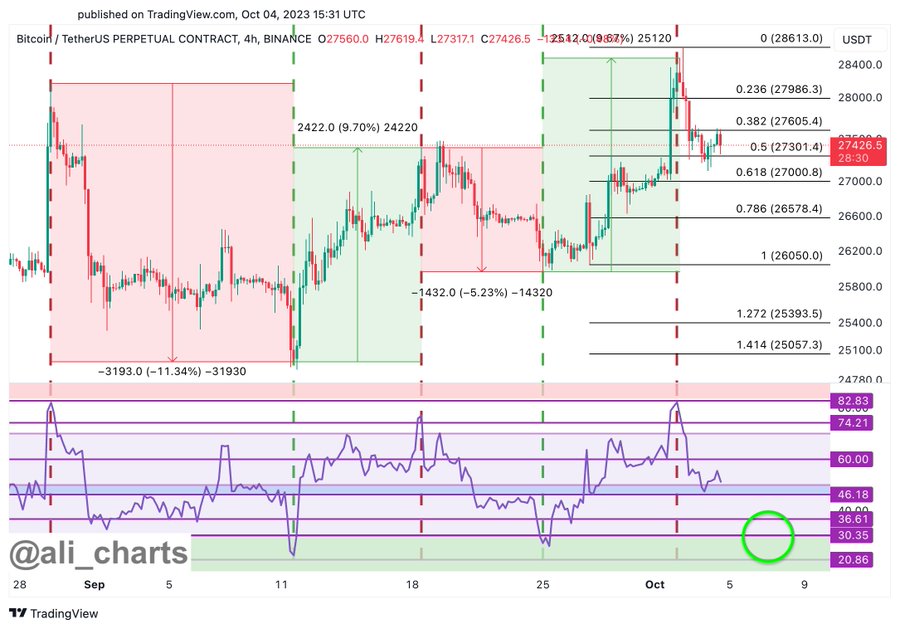
As one of the most referenced technical indicators, the RSI exhibits three distinct readings: a high of 75, a low of 30, and a neutral point of 50.
If an asset’s RSI is reading 75, this means the asset is overbought, while an RSI reading of 30 means oversold. For each of these readings, the direct opposite of what the indicator signals is what should be done.
This means when the coin is overbought, selling becomes the natural strategy to stay safe, while at 30, buying aggressively will keep buyers in line.

According to Ali, traders can maintain a simple strategy of buying Bitcoin when the RSI exceeds 74.21. Conversely, he placed the sell-off point where the RSI dips below 30.35. With this template, Ali advocated for more patience from investors as the current Bitcoin RSI is reading 51, around the neutral range.
In actual trading setups, the RSI is typically used alongside another indicator confirming the plotted move. The Bollinger Bands are among the most favored, and as shown in the BTC/USD 4H chart below, the bands align with the neutral point of the RSI. This implies the patience call is the right one for now.

Growth Beyond Technical Indicators
Trends within the Bitcoin ecosystem are a significant determinant of the broader market momentum, and the coin is exhibiting many off-chain fundamentals now.
With Bitcoin spot ETF sentiment still high, many are optimistic that if the United States Securities and Exchange Commission (SEC) approves this product, it will mark a new era for the adoption of the asset.
The bullish calls ahead of the forthcoming Bitcoin halving are also a significant testament to the fact that the patience call from Ali Charts might pay off in the long run.
Meanwhile, Bitcoin (BTC) has been exhibiting a very intriguing price pattern recently, with a mildly bullish growth currently engulfing the coin, whose price is up 0.46% to $27,660.52 as of press time.
DisClamier: This content is informational and should not be considered financial advice. The views expressed in this article may include the author's personal opinions and do not reflect The Crypto Basic opinion. Readers are encouraged to do thorough research before making any investment decisions. The Crypto Basic is not responsible for any financial losses.