

XRP could rally beyond the $3 mark if it can breach a significant resistance level to break out of its multi-year symmetrical triangle.
Notably, XRP has been in a prolonged consolidation phase within the symmetrical triangle pattern for over six years, as noted by market analyst Ali Martinez. This formation typically suggests an imminent significant move, with the potential for a bullish breakout if key resistance levels give way.
The Multi-Year Triangle
The symmetrical triangle formed following the drop from XRP’s all-time high of $3.3170 in January 2018. XRP experienced a sharp decline from this peak, touching a low near $0.2285 in early 2020.
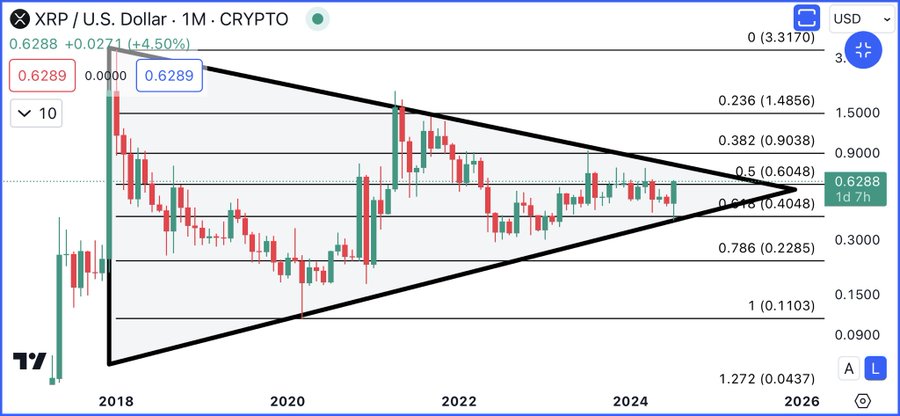
However, XRP started to recover in mid-2020, pushing towards the 0.382 Fibonacci retracement level around $0.9038. This recovery faced an interruption by periods of decline, but XRP managed to reach a high of $1.96 in April 2021. However, this was not enough to breach the triangle.

At the time of Martinez’s disclosure, XRP was changing hands at $0.6288, just above the 0.5 Fibonacci retracement level of $0.6048. A sustained move above this level is crucial for a potential bullish breakout.
The immediate resistance lies at $0.9038, the 0.382 Fibonacci level. According to Martinez, should XRP break this resistance, it could signal the start of a rally towards higher levels, potentially reaching the next major resistance at $1.4856 (0.236 Fibonacci retracement).
Beyond this, the next significant target would be the all-time high of $3.3170, representing a substantial upside from current levels. A push above the all-time high price would be instrumental for an XRP rally toward new heights.
XRP Current Price Position
Meanwhile, XRP has corrected from the initial $0.62 price level, slumping below the 0.5 Fibonacci retracement support. XRP currently trades for $0.5628, having experienced a 5.48% drop over the past 24 hours.

On the daily chart, the Ichimoku Cloud shows the current price below the cloud, suggesting a bearish trend. However, the price is close to the cloud’s upper boundary, indicating a potential for a bullish crossover if the price can break above the cloud. The Ichimoku Cloud’s leading span lines, $0.5691 and $0.5202, provide resistance and support levels.
The CCI, currently at -65.59, suggests that XRP is in a bearish phase but not yet oversold. A move above -100 would signal a potential buying opportunity, aligning with a possible price rise.
Notably, if this occurs, a decisive move above $0.9038 would mark the start of a new bullish phase. Conversely, a failure to break above the key resistance could result in continued consolidation within the symmetrical triangle, with the next support at $0.4048 providing potential downside protection.
DisClamier: This content is informational and should not be considered financial advice. The views expressed in this article may include the author's personal opinions and do not reflect The Crypto Basic opinion. Readers are encouraged to do thorough research before making any investment decisions. The Crypto Basic is not responsible for any financial losses.