
Historical data confirms Bitcoin price movements in 2024 mirror patterns witnessed in previous halving years such as 2016 and 2020.
This is according to a report from Julio Moreno, Head of Research at market intelligence platform CryptoQuant. Moreno disclosed this on X while citing insights from the “Cumulative Return Index on Halving Years,” a metric that tracks Bitcoin’s price action for every year it witnesses a halving.
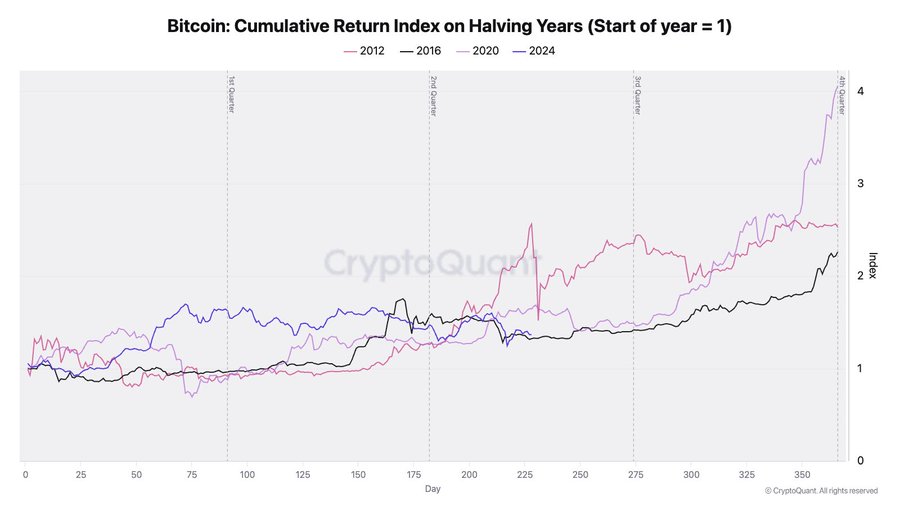
Bitcoin Follows Previous Patterns
Interestingly, the metric confirms that Bitcoin’s price movements were similar at the start of all four halving years. These include 2012, 2016, 2020 and most recently, 2024. However, a discrepancy observed this year was a rapid price surge witnessed by Bitcoin toward the close of the first quarter.
For context, Bitcoin’s uptrend for this cycle began as far back as September 2023. From this point, the premier crypto asset recorded seven consecutive months of persistent gains. This campaign culminated with a new all-time high above $73,000 in March 2024, a month before the 2024 Bitcoin halving.

This was unprecedented, as Bitcoin has always reached a new all-time high after each halving, not before. Analysts attributed the change in trend to the emergence of the spot Bitcoin ETFs, which pumped considerable capital into the market. At press time, the ETF products have gulped over $17 billion in net inflows within seven months.
Notably, after breaching the all-time high in March 2024, Bitcoin faced a correction, dropping by 15% in April. This marked its first monthly loss since September 2023. The losses persisted into Q2 2024, but data from the Cumulative Return Index metric indicates that this drop actually brought Bitcoin back on track to levels witnessed in past cycles.
A Persistent Performance
Essentially, despite concerns around the dump, Bitcoin is currently trading at the position it was in past halvings. This suggests that the firstborn cryptocurrency is exactly where it needs to be, per historical data on the 2016 and 2020 halvings. The only outlier is 2012, when Bitcoin spiked 220% from $5 to $16 between May and August.

However, in 2016 and 2020, BTC largely consolidated from March to August. This confirms that the bearish consolidation the market currently faces is not unique. Interestingly, further data suggests there might be light at the end of the tunnel. In 2016 and 2020, following the consolidation from Q2 to Q3, BTC recovered toward Q4.
Citing this pattern, Moreno emphasized that if Bitcoin will rebound from the ongoing bearish phase, such a push could come up in the fourth quarter of this year. At press time, Bitcoin currently trades for $58,405. Market veteran Peter Brandt expects an eventual spike to $92,579.
DisClamier: This content is informational and should not be considered financial advice. The views expressed in this article may include the author's personal opinions and do not reflect The Crypto Basic opinion. Readers are encouraged to do thorough research before making any investment decisions. The Crypto Basic is not responsible for any financial losses.