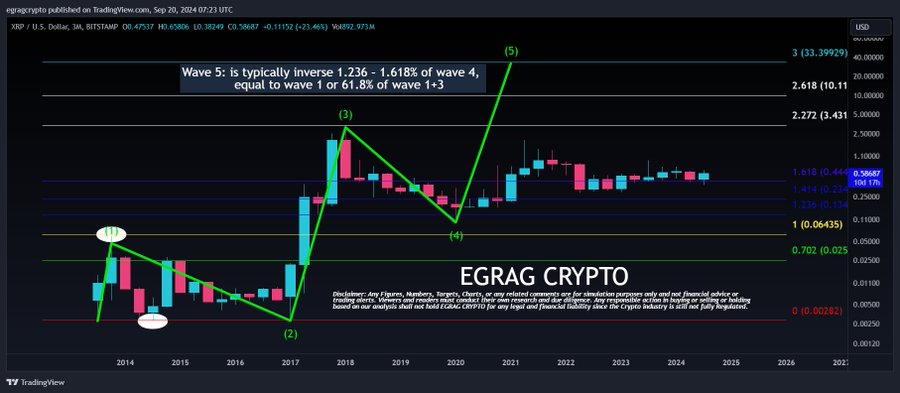
Market analyst EGRAG recently discussed XRP price outlook, predicting a price surge that could take it to double-digit values.
The analysis, which the market watcher revealed in a recent post on X, relied on the Elliott Wave Theory and Fibonacci retracement levels to predict XRP’s future movements.
XRP Wave 5 Potential
Notably, EGRAG’s report rests on understanding the extent of Wave 5 within the Elliott Wave Theory, which suggests that Wave 5 often measures between 1.236 and 1.618 times the size of Wave 4.
Alternatively, the analyst suggested that Wave 5 can match Wave 1 or cover 61.8% of the combined distance of Waves 1 and 3. In all scenarios, the target exceeds Fibonacci level 3, which indicates that XRP could see a massive upsurge.
EGRAG presented the first accompanying chart, observing XRP’s movements over a 3-month timeframe. The chart shows XRP’s price action in a classic Elliott Wave pattern, showing Wave 1 through Wave 4 and forecasting the magnitude of Wave 5.

The Fibonacci levels drawn in the chart reveal the expected retracements and expansions, with particular attention to the 1.236 to 1.618 levels. Based on this pattern, EGRAG indicates that XRP could potentially surpass the Fib 3 target of $33.
XRP Comparison with BTC and ETH
Meanwhile, EGRAG drew comparisons between XRP, Bitcoin (BTC), and Ethereum (ETH). He confirmed that Bitcoin has reached Fibonacci level 3 but has since struggled to sustain this level by failing to close three consecutive monthly candles above it.
In contrast, Ethereum has surged past Fibonacci level 3 and even reached Fib 4.272, a level much higher than Bitcoin’s peak.

EGRAG believes these comparisons bolster his optimism for XRP. The analyst suggests that XRP could not only surpass Fib 3 ($33) but could also be in a macro-Wave 5 scenario, signaling that the current market cycle may lead to further price expansion.
The significant resistance faced by BTC and ETH in past cycles further shows XRP’s potential to rise beyond those levels, should Wave 5 unfold as anticipated.
The Bigger Picture: XRP to $1,780
The market analyst also discussed the possibility of XRP reaching even loftier heights, comparing its potential to Ethereum’s previous market cycle.
In a second XRP chart, he identified a larger wave structure for the altcoin, where the blue wave count represents an alternative scenario with a higher target.

The larger Fibonacci structure and wave count suggest that XRP could aim for Fibonacci level 4.272, a potential price target of $1,780. This is in sync with Ethereum’s performance during its bull cycle, where it similarly exceeded expectations and surged past Fib 4.272.
If XRP mirrors Ethereum’s price movement, it could experience a dramatic rise in value, although this scenario is more speculative and tied to a long-term macro trend.
DisClamier: This content is informational and should not be considered financial advice. The views expressed in this article may include the author's personal opinions and do not reflect The Crypto Basic opinion. Readers are encouraged to do thorough research before making any investment decisions. The Crypto Basic is not responsible for any financial losses.


