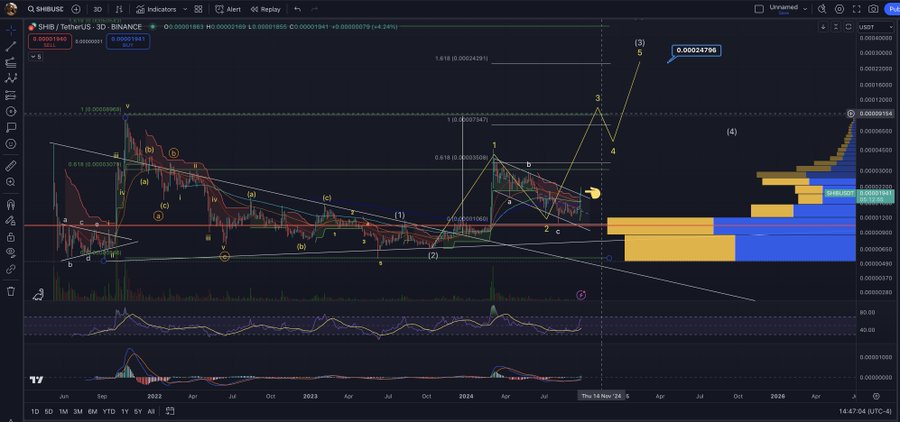
Analyst Michael has issued a forecast for Shiba Inu (SHIB), predicting it to erase another leading zero based on a complex Elliott Wave structure.
In a recent post on X, the market commentator confirmed that he believes the current price movement indicates the start of a bullish wave that could take SHIB to new highs.
Shiba Inu Elliott Wave Analysis Points to a Breakout
The accompanying chart identified Shiba Inu’s price as being in the middle of a five-wave impulse structure. The initial Wave 1 was completed when Shiba Inu surged to a peak of $0.000016117 on Aug. 24.
After this peak, SHIB collapsed, leading to the corrective Wave 2. This Wave 2 resulted in a retracement of the previous gains, with Shiba Inu completing it amid a collapse to $0.00001246 on Sept. 4.

According to data from Michael’s chart, SHIB has now entered the most powerful upward wave, Wave 3. In Elliott Wave Theory, Wave 3 is the lengthiest and most powerful wave in the sequence. Projections suggest that this wave could push Shiba Inu’s price toward $0.0002479 and beyond.
SHIB’s Bullish Market Position
Besides the Elliott Wave structure, Michael also calls attention to support and resistance levels. On the upside, SHIB eyes an important level near $0.00003747, which marks a previous high aligning with the Fibonacci 0.618 region.
Breaking above this level would confirm the Elliott Wave projection and potentially pave the way for a target of $0.0002 in the medium term. Meanwhile, on the downside, IntoTheBlock data confirms robust support between $0.000014 and $0.000018, where 120,930 addresses hold over 550 trillion SHIB.

The chart from Michael also calls attention to a falling wedge pattern, which has recently broken out to the upside. This breakout suggests that Shiba Inu could be starting its next upward move after a prolonged period of consolidation.
In addition, the MACD and RSI indicators confirm the bullish outlook. The RSI is positioned in the middle range. This indicates that there’s still room for price growth before reaching overbought territory, aligning with the Wave 3 potential.
Moreover, the MACD appears to be crossing into bullish territory, with bullish bars consistently forming over the past few days. At the reporting time, Shiba Inu changes hands at $0.00001866, down 3.52% this morning. From this level, SHIB would need to appreciate 1,228% to reach the $0.0002479 target.
DisClamier: This content is informational and should not be considered financial advice. The views expressed in this article may include the author's personal opinions and do not reflect The Crypto Basic opinion. Readers are encouraged to do thorough research before making any investment decisions. The Crypto Basic is not responsible for any financial losses.


