Bitcoin enters the scene as the relationship between government bond yields and prices of risk assets like gold continue to follow historical trends.
A decrease in the 13-week U.S. Treasury yield often leads to rising prices for assets like gold. Now, Bitcoin is also coming into the spotlight due to its potential to behave similarly to gold during periods of economic uncertainty.
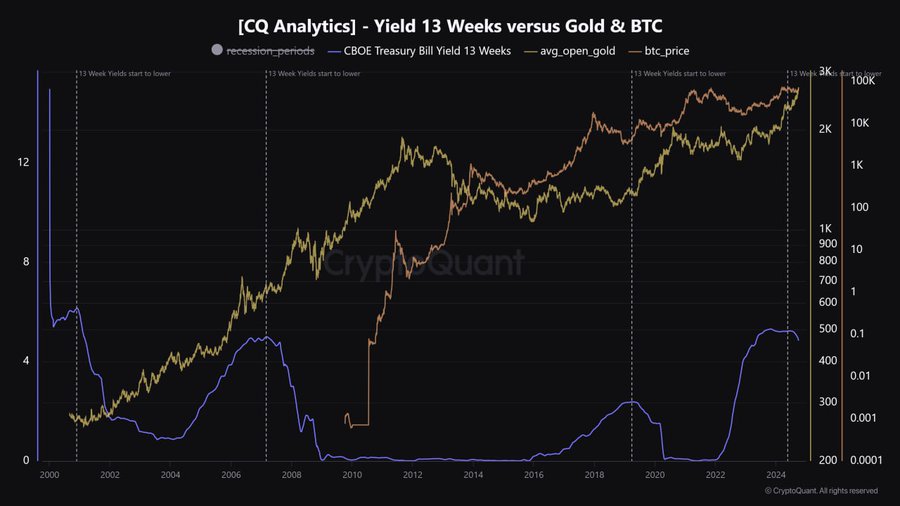
CryptoQuant, a leading crypto analytics resource, recently discussed the possible impact of the latest drop in the 13-week Treasury yield, citing correlations from historical data.
A Historical Perspective
In 2008, during a time of financial distress and monetary easing, the 13-week Treasury yield began to fall significantly. As a result, investors sought refuge in safe-haven assets like gold.
The precious metal climbed from approximately $590 per ounce in 2008 to nearly $1,900 by 2011, as noted by CryptoQuant. This rise occurred as interest rates dropped, making bonds less attractive and pushing capital toward non-yielding assets that perform well during inflation or economic uncertainty.

Now, this year, the market is witnessing a similar scenario. Treasury yields are on the decline once again, and gold prices have risen from $2,000 to around $2,700 per ounce.
Meanwhile, the CryptoQuant report argues that Bitcoin, often referred to as “digital gold,” could also benefit from these economic conditions. Most market participants see the premier crypto as a store of value, particularly in times of monetary easing, inflation, and currency depreciation.
Bitcoin has been gaining popularity as an alternative to traditional safe-haven assets like gold. As Treasury yields decline, Bitcoin may attract more capital as investors seek alternatives to low-yielding bonds and traditional assets.
Bitcoin Current Market Conditions
In the short-term, Bitcoin is facing a roadblock in its recovery, with prices slipping for three consecutive days. On Sept. 29, the firstborn crypto asset started its pullback, and the trend has persisted, with Bitcoin currently trading at $62,083.
On the daily DMI, the +DI is at 20.45 but is trending downward. This indicates weakening bullish momentum. Meanwhile, the -DI stands at 21.00 but is also sloping downward, suggesting that sellers are losing strength.

The Average Directional Index (ADX), which measures the strength of the prevailing trend, is currently at 21.34. This relatively low value suggests that the ongoing trend—whether bullish or bearish—is not particularly strong at this moment.
Further, Bitcoin is currently trading below the Conversion Line (Tenkan-sen) of the Ichimoku Cloud at $64,155 but above the Base Line (Kijun-sen) at $59,527. This reveals that while Bitcoin’s short-term momentum has weakened, it is still holding above a key support level (the Base Line).
Additionally, Bitcoin is above the Lagging Span A at $61,841, which means it is still in bullish territory, but the upside potential seems limited for now.
DisClamier: This content is informational and should not be considered financial advice. The views expressed in this article may include the author's personal opinions and do not reflect The Crypto Basic opinion. Readers are encouraged to do thorough research before making any investment decisions. The Crypto Basic is not responsible for any financial losses.


