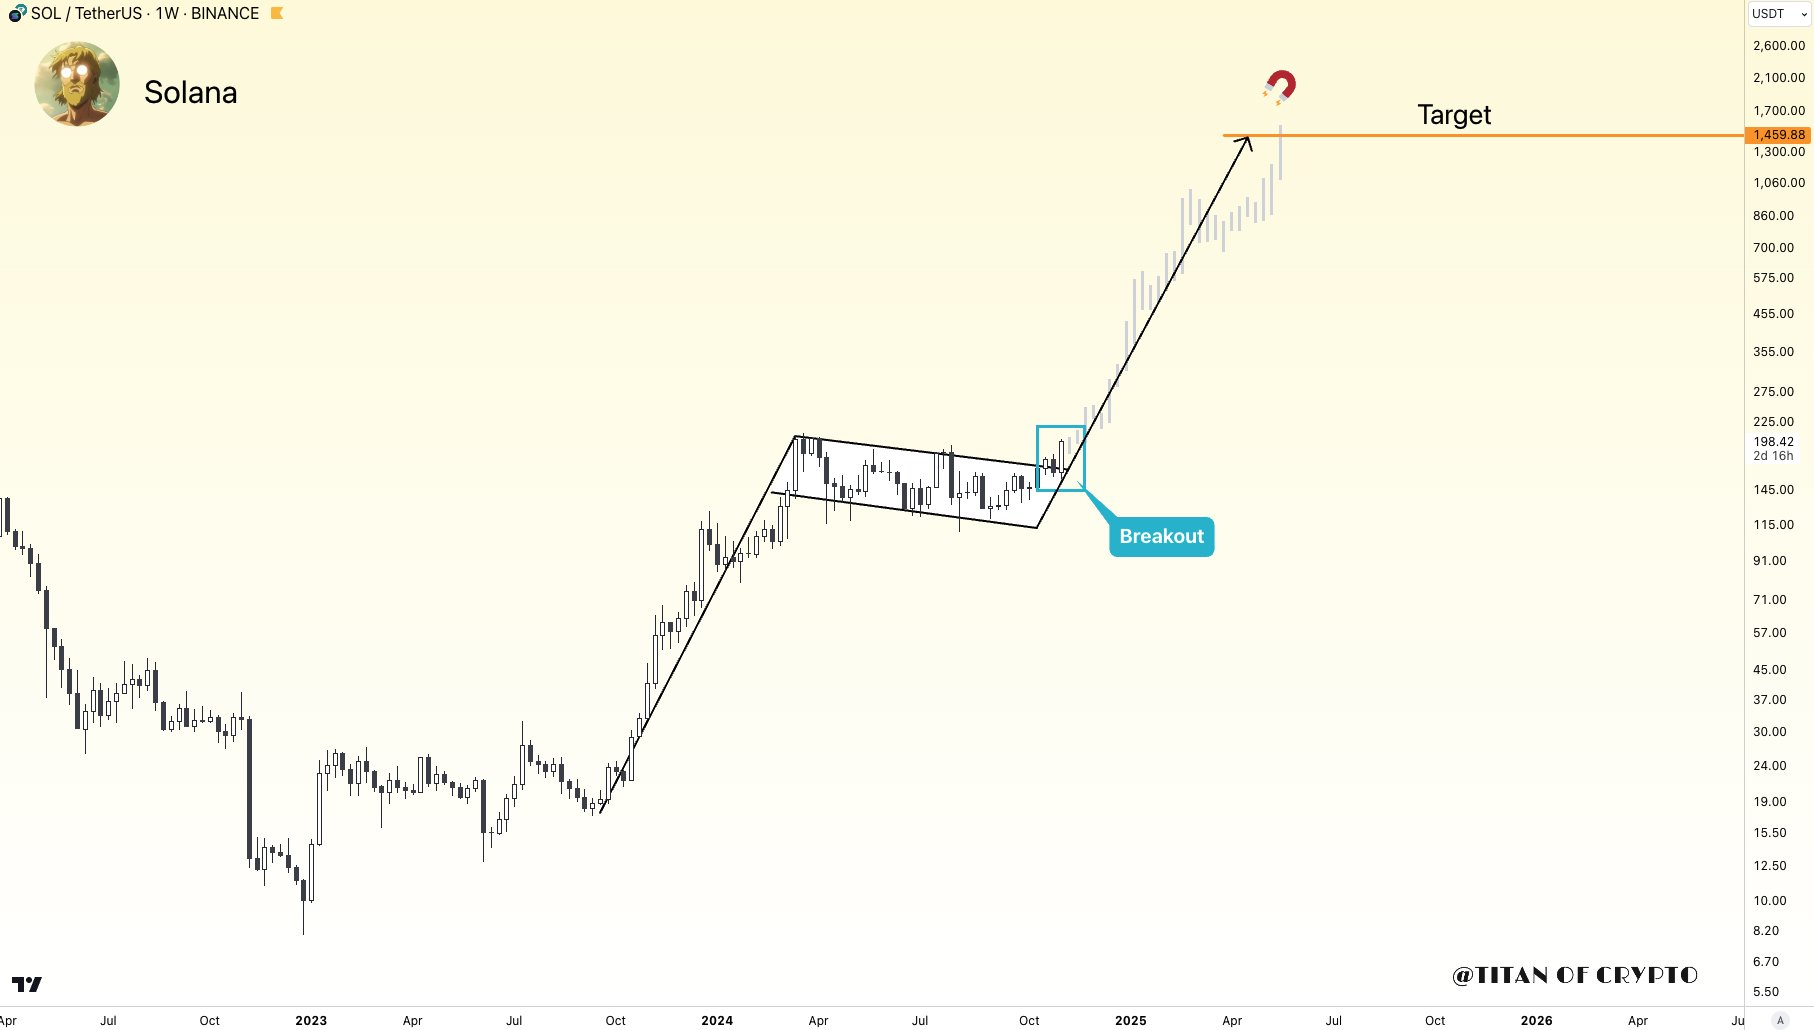
A widely followed analyst has observed a bull flag breakout on the weekly chart of Solana (SOL), projecting a potential rally to $1,400.
Solana is again capturing market attention, surging 8.4% today to break past the $200 resistance level. This follows a strong performance earlier in the week, where Solana overtook BNB to claim the fifth spot in the cryptocurrency rankings.
The recent rally coincided with the U.S. Federal Reserve’s announcement of a 25 basis points rate cut on November 7, which appears to have fueled the market’s momentum.
Solana Bull Flag Signals Further Gains
Now, analysts are pointing to bullish signals on Solana’s weekly chart, suggesting the possibility of continued gains.
For instance, analyst “Titan of Crypto” identified a Bull Flag pattern on Solana’s weekly chart, which is a breakout signal that follows a consolidation phase. This configuration emerged as Solana cracked the $200 resistance level.
Based on the height of the flagpole, the analyst suggests a potential price target for Solana near $1,400, reflecting strong market optimism.
Also, in an analysis shared today, Rekt Capital, a well-known market analyst, noted that Solana has already surpassed the $202 resistance level even before the close of the weekly candle.
The analyst emphasized that this development marks the end of a multi-month downtrend, with a confirmed weekly close above $202 potentially setting the stage for sustained rallies above this level.
In a separate disclosure, crypto trader Cyclop highlighted price predictions for leading tokens like Solana. The trader believes that during the anticipated 2025 supercycle, Solana’s destiny is a price range of $400-$600.
Rising Market Dominance
Notably, amid the ongoing Solana bull run, the asset’s market dominance has surged to a new all-time high of 3.81%. This metric reflects the growing share of Solana’s market cap relative to the broader crypto market.
Historically, Solana experienced periods of rapid dominance growth, particularly during its rise from $30 to $100 in mid-2021. However, 2022 presented significant challenges, including the collapse of FTX, which negatively impacted Solana’s performance.
DisClamier: This content is informational and should not be considered financial advice. The views expressed in this article may include the author's personal opinions and do not reflect The Crypto Basic opinion. Readers are encouraged to do thorough research before making any investment decisions. The Crypto Basic is not responsible for any financial losses.


