

Bitcoin is back under $96,000 as the crypto market starts the week on a bearish note. Is a downfall to $90k imminent this week?
Last week, Bitcoin faced massive fluctuations, with a 7-day low at $93,340 and a high at $99,508. Despite the massive fluctuation, BTC concluded the week at $96,262, with a surge of 0.14%.
Meanwhile, the uncertainty in the BTC price trend takes a bearish shift at the start of this week. With an intraday fall of 0.57%, Bitcoin trades at a market price of $95,714.
Furthermore, last week’s cumulative weekly flow in the Bitcoin ETF remained negative. Amid such conditions, will Bitcoin sustain above its crucial support near the $94,000 mark, or is a downfall imminent?
Bearish Pressure Intensifies on Daily Chart
In the daily chart, the BTC price trend reveals a significant bearish influence that dominates the price trend. Currently, Bitcoin is above the $95,000 mark after rejection from the overhead trend line.


Along with the overhead trend line, the crucial supply zone near the $98,500 and the 50% Fibonacci level influences the quick turnaround. With short-term sustenance near the $95,000 mark, the BTC price trend hints at a potential comeback.
Supporting bullish chances, the money flow index reveals a surge in inflow as it takes a bounce back from the oversold region. Currently, BTC prices show a 0.26% surge in the past four hours, with multiple low-price rejections near the $95,000 mark.
BTC is likely to rechallenge the 38.20% Fibonacci level at $96,703. If a bullish breakout occurs, the uptrend will first rechallenge the overhead trend line, resulting in four bearish reversals.
A successful breakout could push BTC toward the $98,500 supply zone near the 50% Fibonacci level.
Conversely, a breakdown of local support at the $95,000 mark will test the 23.60% Fibonacci level at $94,393. Further, it will increase the chances of a quick revisit to the $90k psychological support.
Bitcoin ETFs Witness Massive Outflows
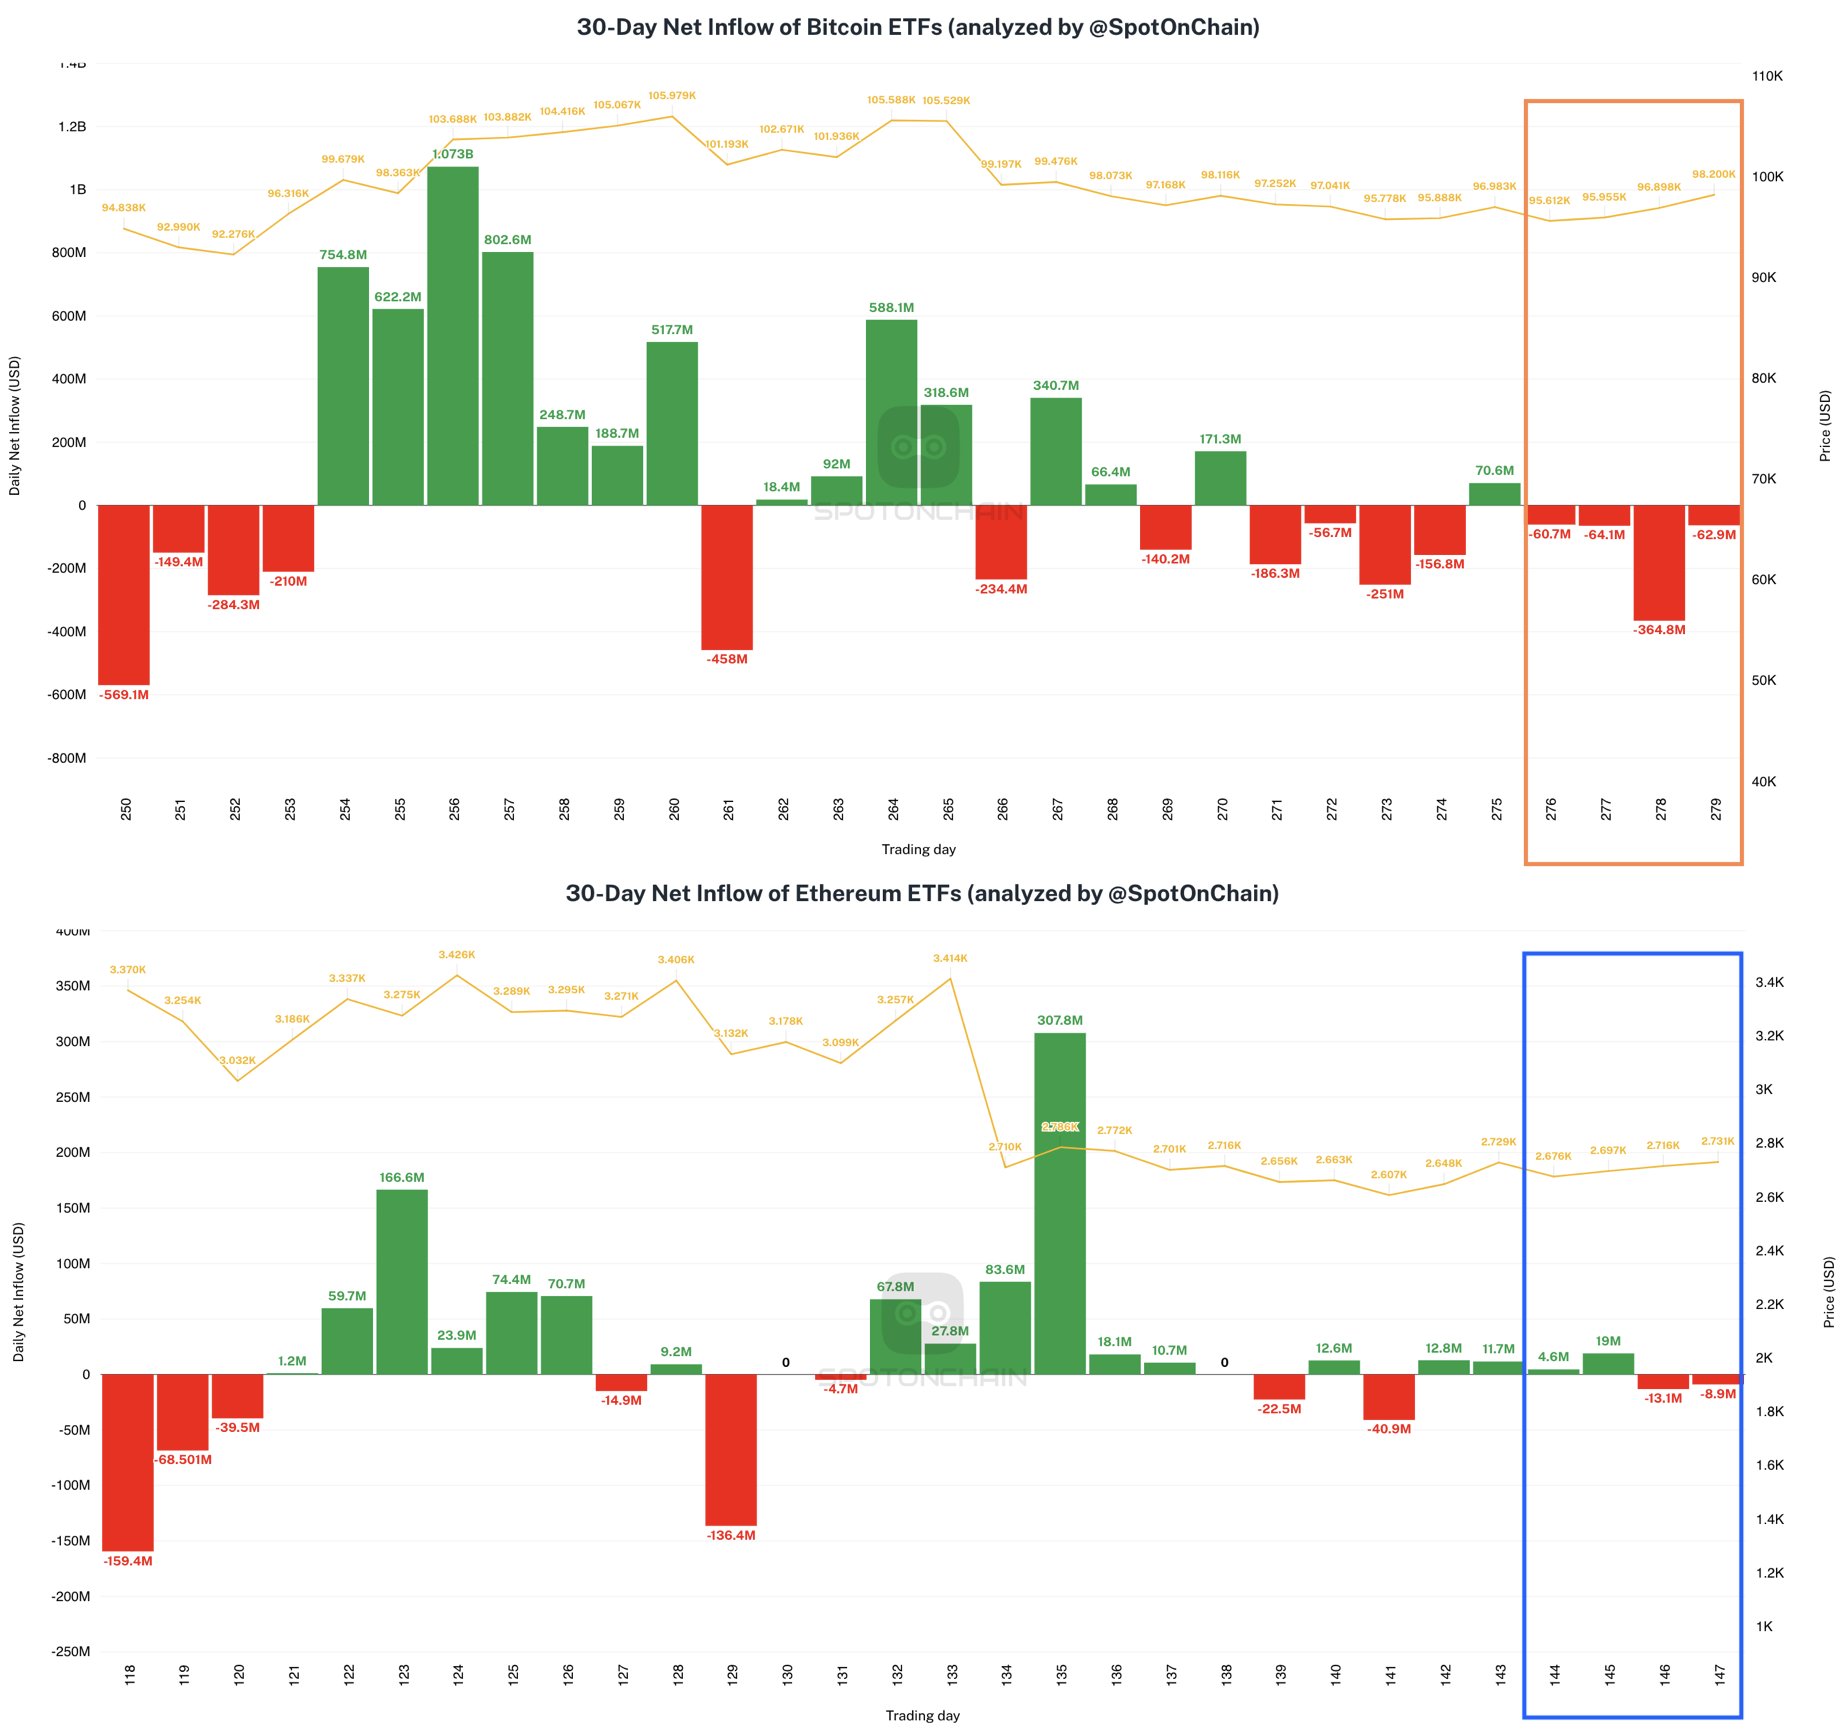
According to a recent tweet by SpotOnChain, U.S. spot Bitcoin ETFs saw a massive outflow of $552.5 million last week. There were outflows on all four trading days, during which BTC prices dropped by nearly 8%.
This decline resulted in a weekly Doji candle, indicating market uncertainty.
Will March Trigger a Bullish Comeback for Bitcoin?
Despite the ongoing downfall, Bitcoin’s price will likely make a bullish comeback next month. As per Coinglass, over the past four years, Bitcoin recorded significant returns in March.

If the bullish trend continues, the upcoming month could witness a bullish spree with a breakout of the 50% Fibonacci level. A breakout above the 50% Fibonacci level could open doors for further gains, targeting the 78.60% Fibonacci level at $103,393 and the supply zone near the $108,000 mark.
DisClamier: This content is informational and should not be considered financial advice. The views expressed in this article may include the author's personal opinions and do not reflect The Crypto Basic opinion. Readers are encouraged to do thorough research before making any investment decisions. The Crypto Basic is not responsible for any financial losses.