

Analyst Ali Martinez highlights a symmetrical triangle on the Dogecoin daily chart, pointing to a potential major move driven by technical patterns.
Dogecoin is drawing attention from on-chain analysts amid a 1.90% decline over the past 24 hours. The coin is trading at $0.1676, dipping 3.74% over the last seven days.
However, beyond short-term price fluctuations, analysts have identified a key pattern on the daily timeframe that could signal an imminent shift in trend. A symmetrical triangle that began forming in December 2024 is now approaching its apex, with market watchers closely eyeing critical levels for a possible breakout.
The Dogecoin Symmetrical Triangle Setup
According to Ali Martinez, the symmetrical triangle pattern on the DOGE/USDT daily chart has shaped the token’s price action since December 8, when it briefly surged to $0.48.
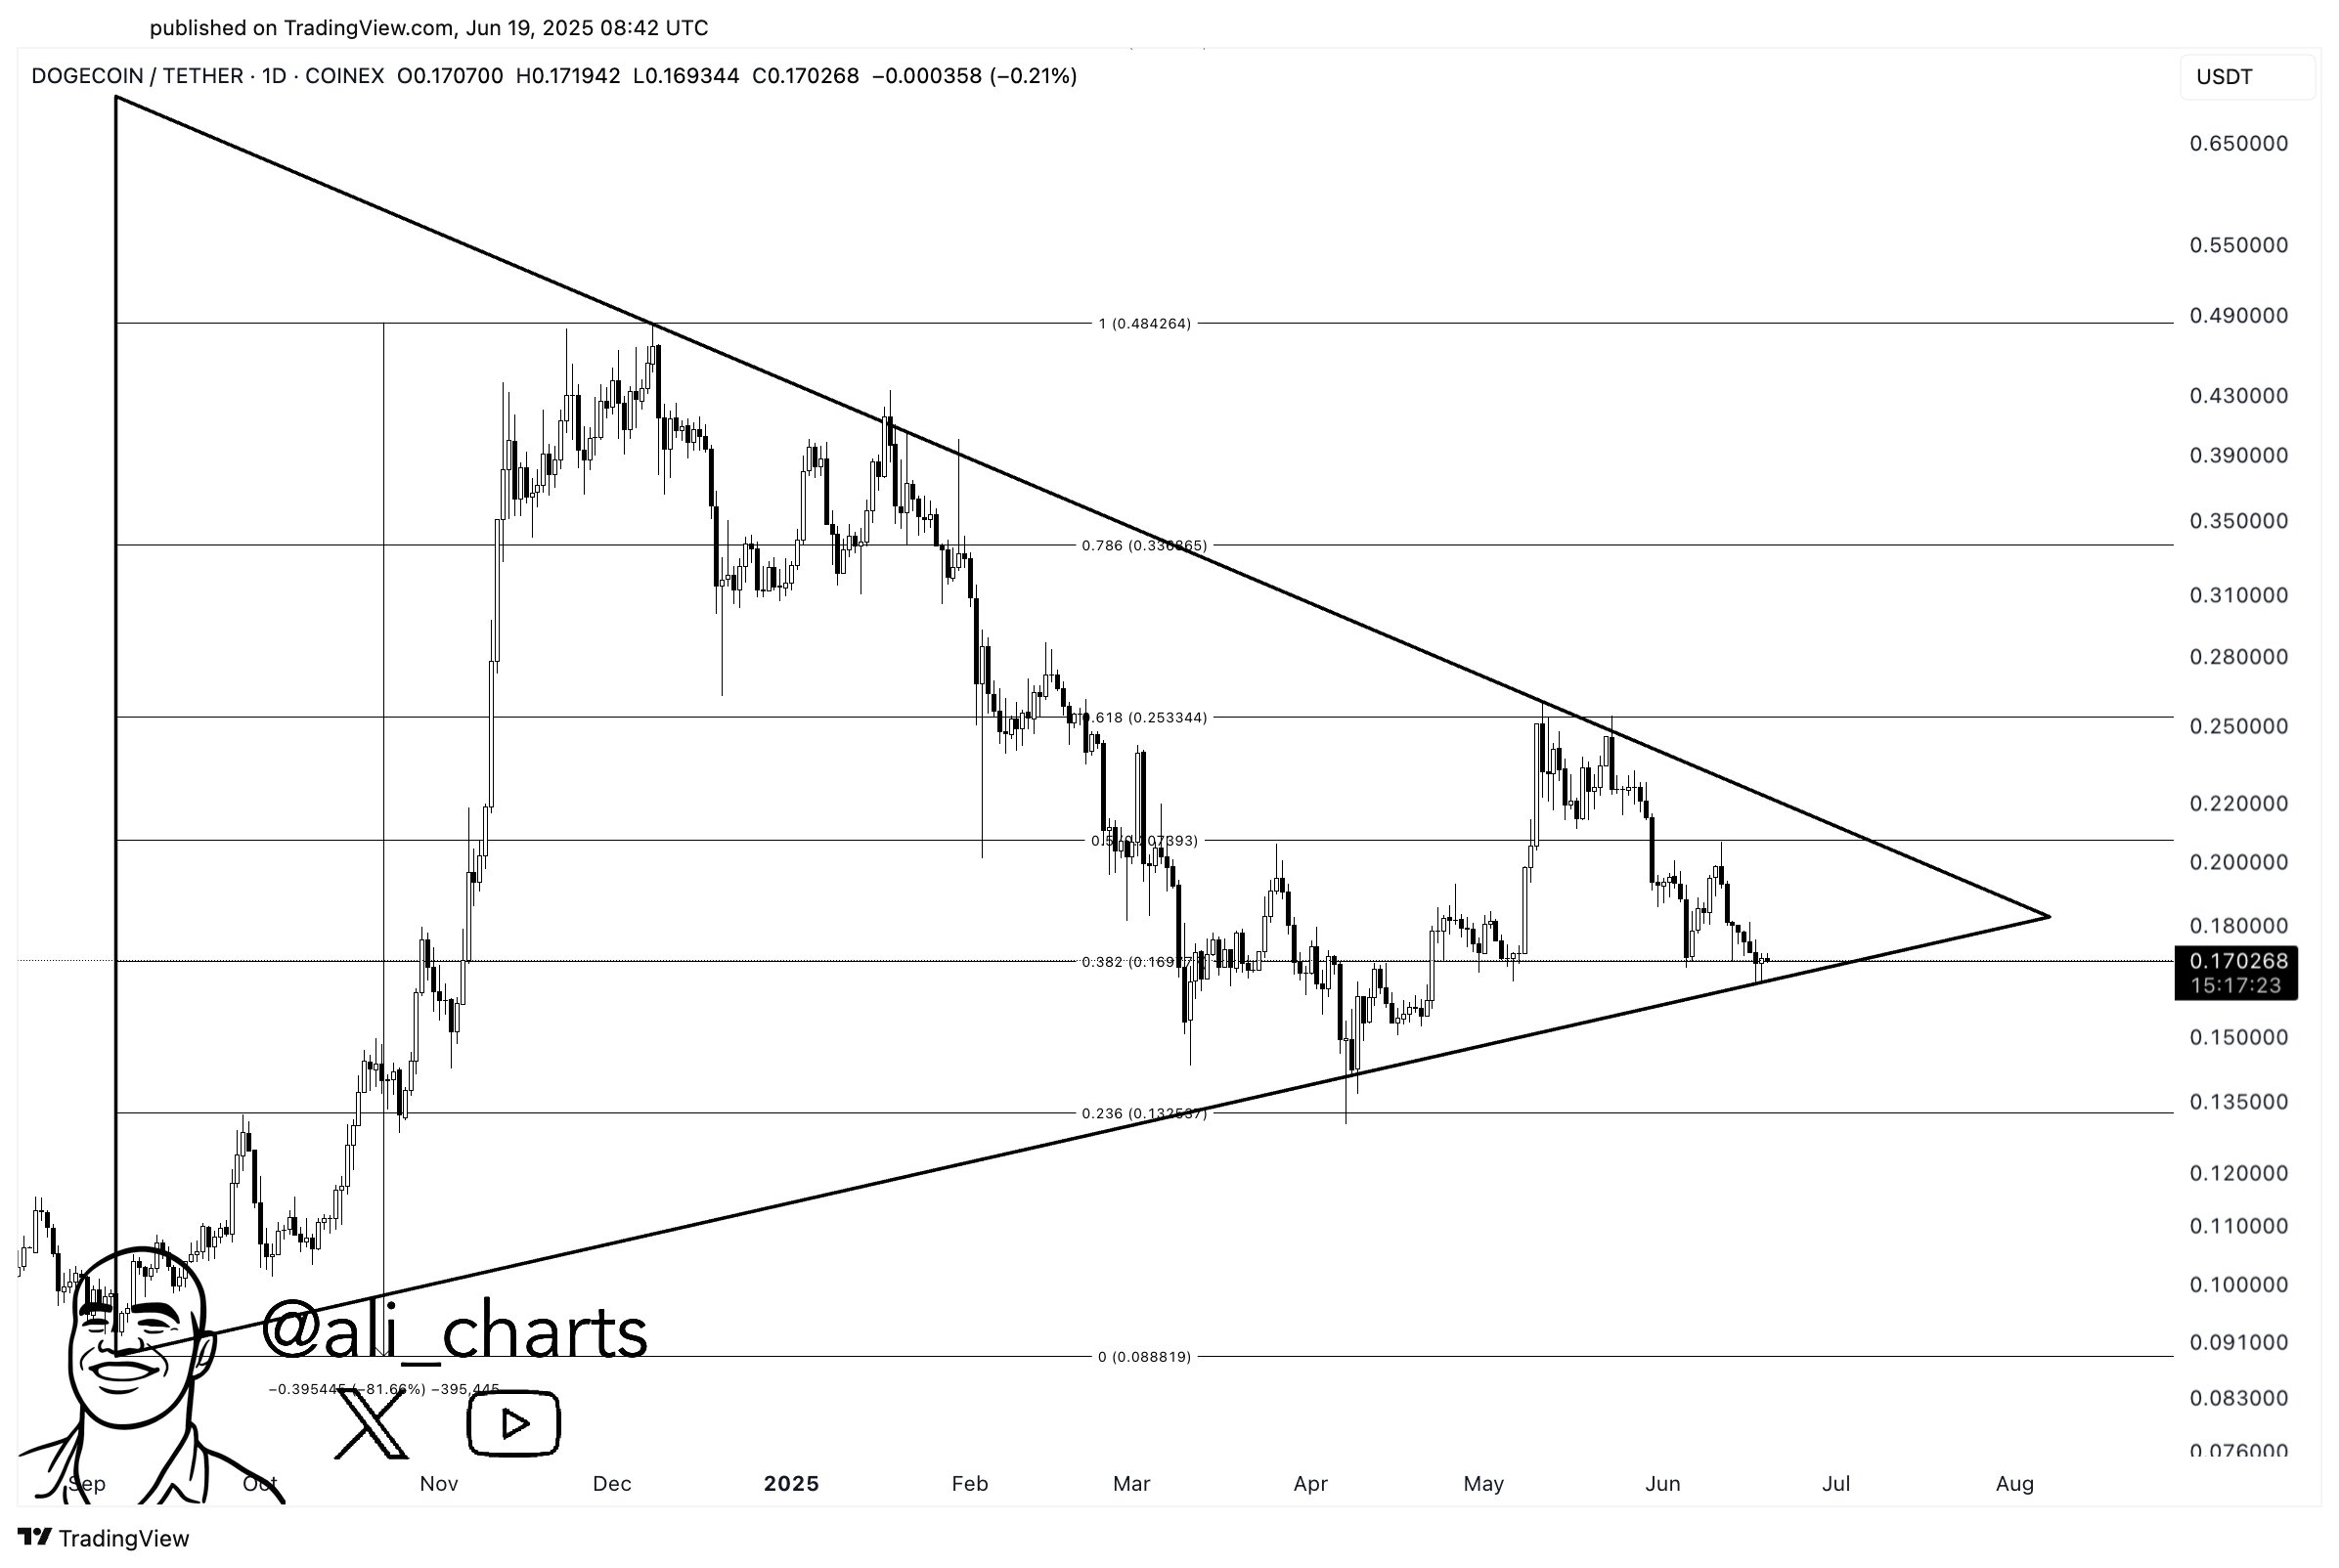

The upper trendline has consistently capped upward movement, rejecting bullish attempts at $0.43 on January 18 and again at $0.25 on May 11. Meanwhile, the lower trendline has provided support, holding at $0.12 on April 7 and near $0.16 on June 18.
Market watchers often view this pattern as a precursor to a significant breakout. Meanwhile, the direction remains uncertain until the price closes decisively above or below the triangle’s boundaries.
According to Martinez, Dogecoin is poised for a potential 60% move, but notes that a daily close outside the $0.16 to $0.22 range will confirm the breakout direction.
If Dogecoin breaks upward, a 60% rally from the current price of $0.1681 would place it near $0.269. Conversely, a 60% decline would drop it to approximately $0.0672.
Historical Patterns Reinforce the Technical Outlook
In a separate analysis, Crypto Elites examined past symmetrical triangle formations in Dogecoin’s history. The first triangle emerged in early 2016 when the price was around $0.0001. After consolidation, a breakout in late 2017 led to a move from $0.008 to $0.017 by January 2018.
Another pattern developed in December 2020 after the price fell below $0.002. A breakout followed in 2021, lifting Dogecoin to $0.080 by February and eventually to $0.73 by May 2021.
More recently, a third triangle began forming in mid-2022 around the $0.05 mark. A breakout occurred in early 2024, pushing the price to $0.22 in March and peaking above $0.48 by December 2024, before returning to its current level.
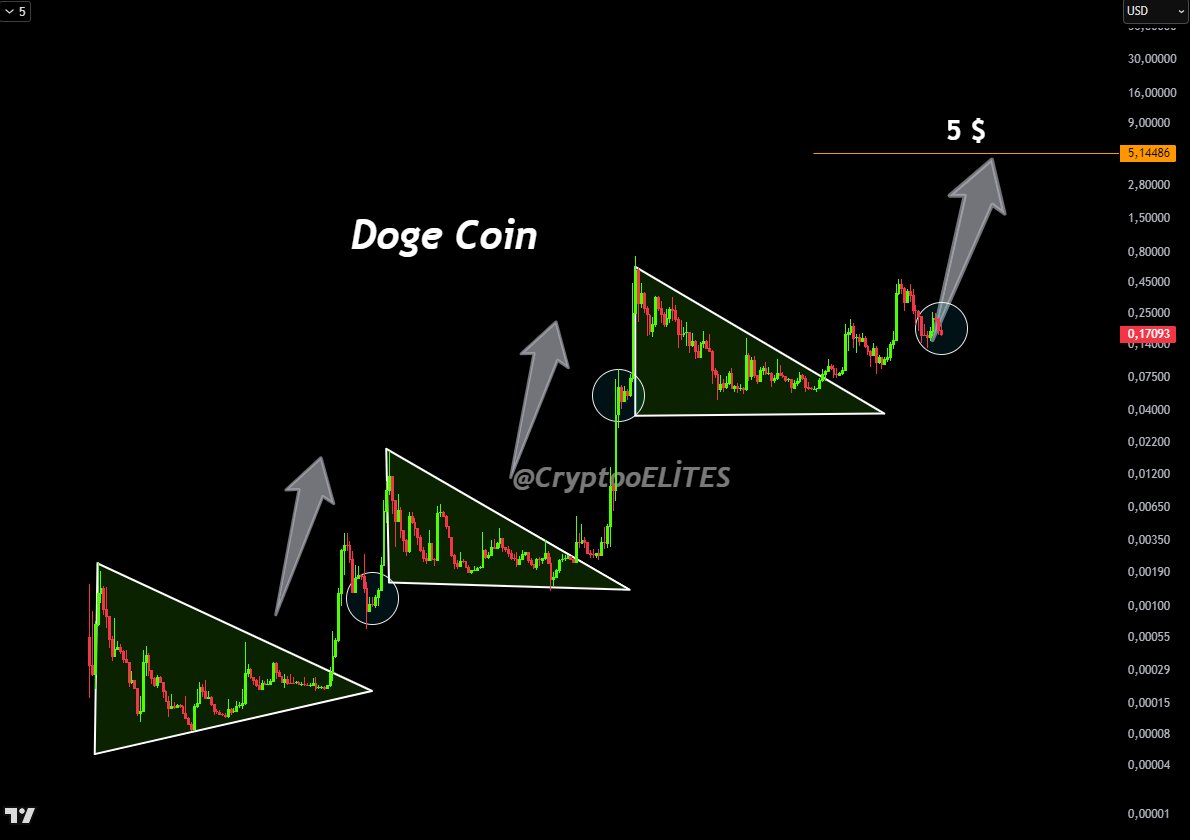
Based on these formations, Crypto Elites maintains a bullish stance on Dogecoin. He boldly argued a $5 target is a realistic expectation.
Heightened Network Activity
Meanwhile, data from IntoTheBlock provides additional insight into current market dynamics. Over the past week, Dogecoin’s network activity has surged across three major address metrics.
New Addresses jumped by 102.40%, while Active Addresses climbed by 111.32%. Zero Balance Addresses also rose by 155.52%.

These figures suggest growing user engagement and trading activity. Increased New Addresses typically indicate new user entry, while more Active Addresses imply higher transaction volumes. The rise in Zero Balance Addresses may reflect heightened wallet turnover or broader trading movement.
DisClamier: This content is informational and should not be considered financial advice. The views expressed in this article may include the author's personal opinions and do not reflect The Crypto Basic opinion. Readers are encouraged to do thorough research before making any investment decisions. The Crypto Basic is not responsible for any financial losses.