

According to a top market commentator, Bitcoin fell to $112,000 to hunt leveraged market traders; nothing more than that.
Bitcoin (BTC) experienced a significant decline on Monday, marking an unexpected turn of events. Many expected the premier asset to lead a broader market rally following the recent rate cuts. However, it instead dropped over 2% to a low of $111,809 yesterday before rebounding to its current market price of $113,120.
Bitcoin Dump a Liquidation Event, Nothing More
The price correction sparked a crypto bloodbath, which saw a spike in liquidations. Reports indicate that over $1.7 billion was wiped out of the cryptocurrency market within 24 hours on Monday, with more than 95% of the losses from long positions.
However, according to top market analyst “IncomeSharks,” there is no need to panic yet. Notably, he called the drop to $112,000 “nothing more than a liquidation event,” insisting that things will align for Bitcoin in the coming days.
His calm in the chaos comes from an understanding that Bitcoin is still holding a key support level. An accompanying chart shows that the retracement yesterday from around $115,300 saw it retest the support at $112,000. Despite its brief decline below, BTC has rebounded from the area, as it has previously done, to its current price.

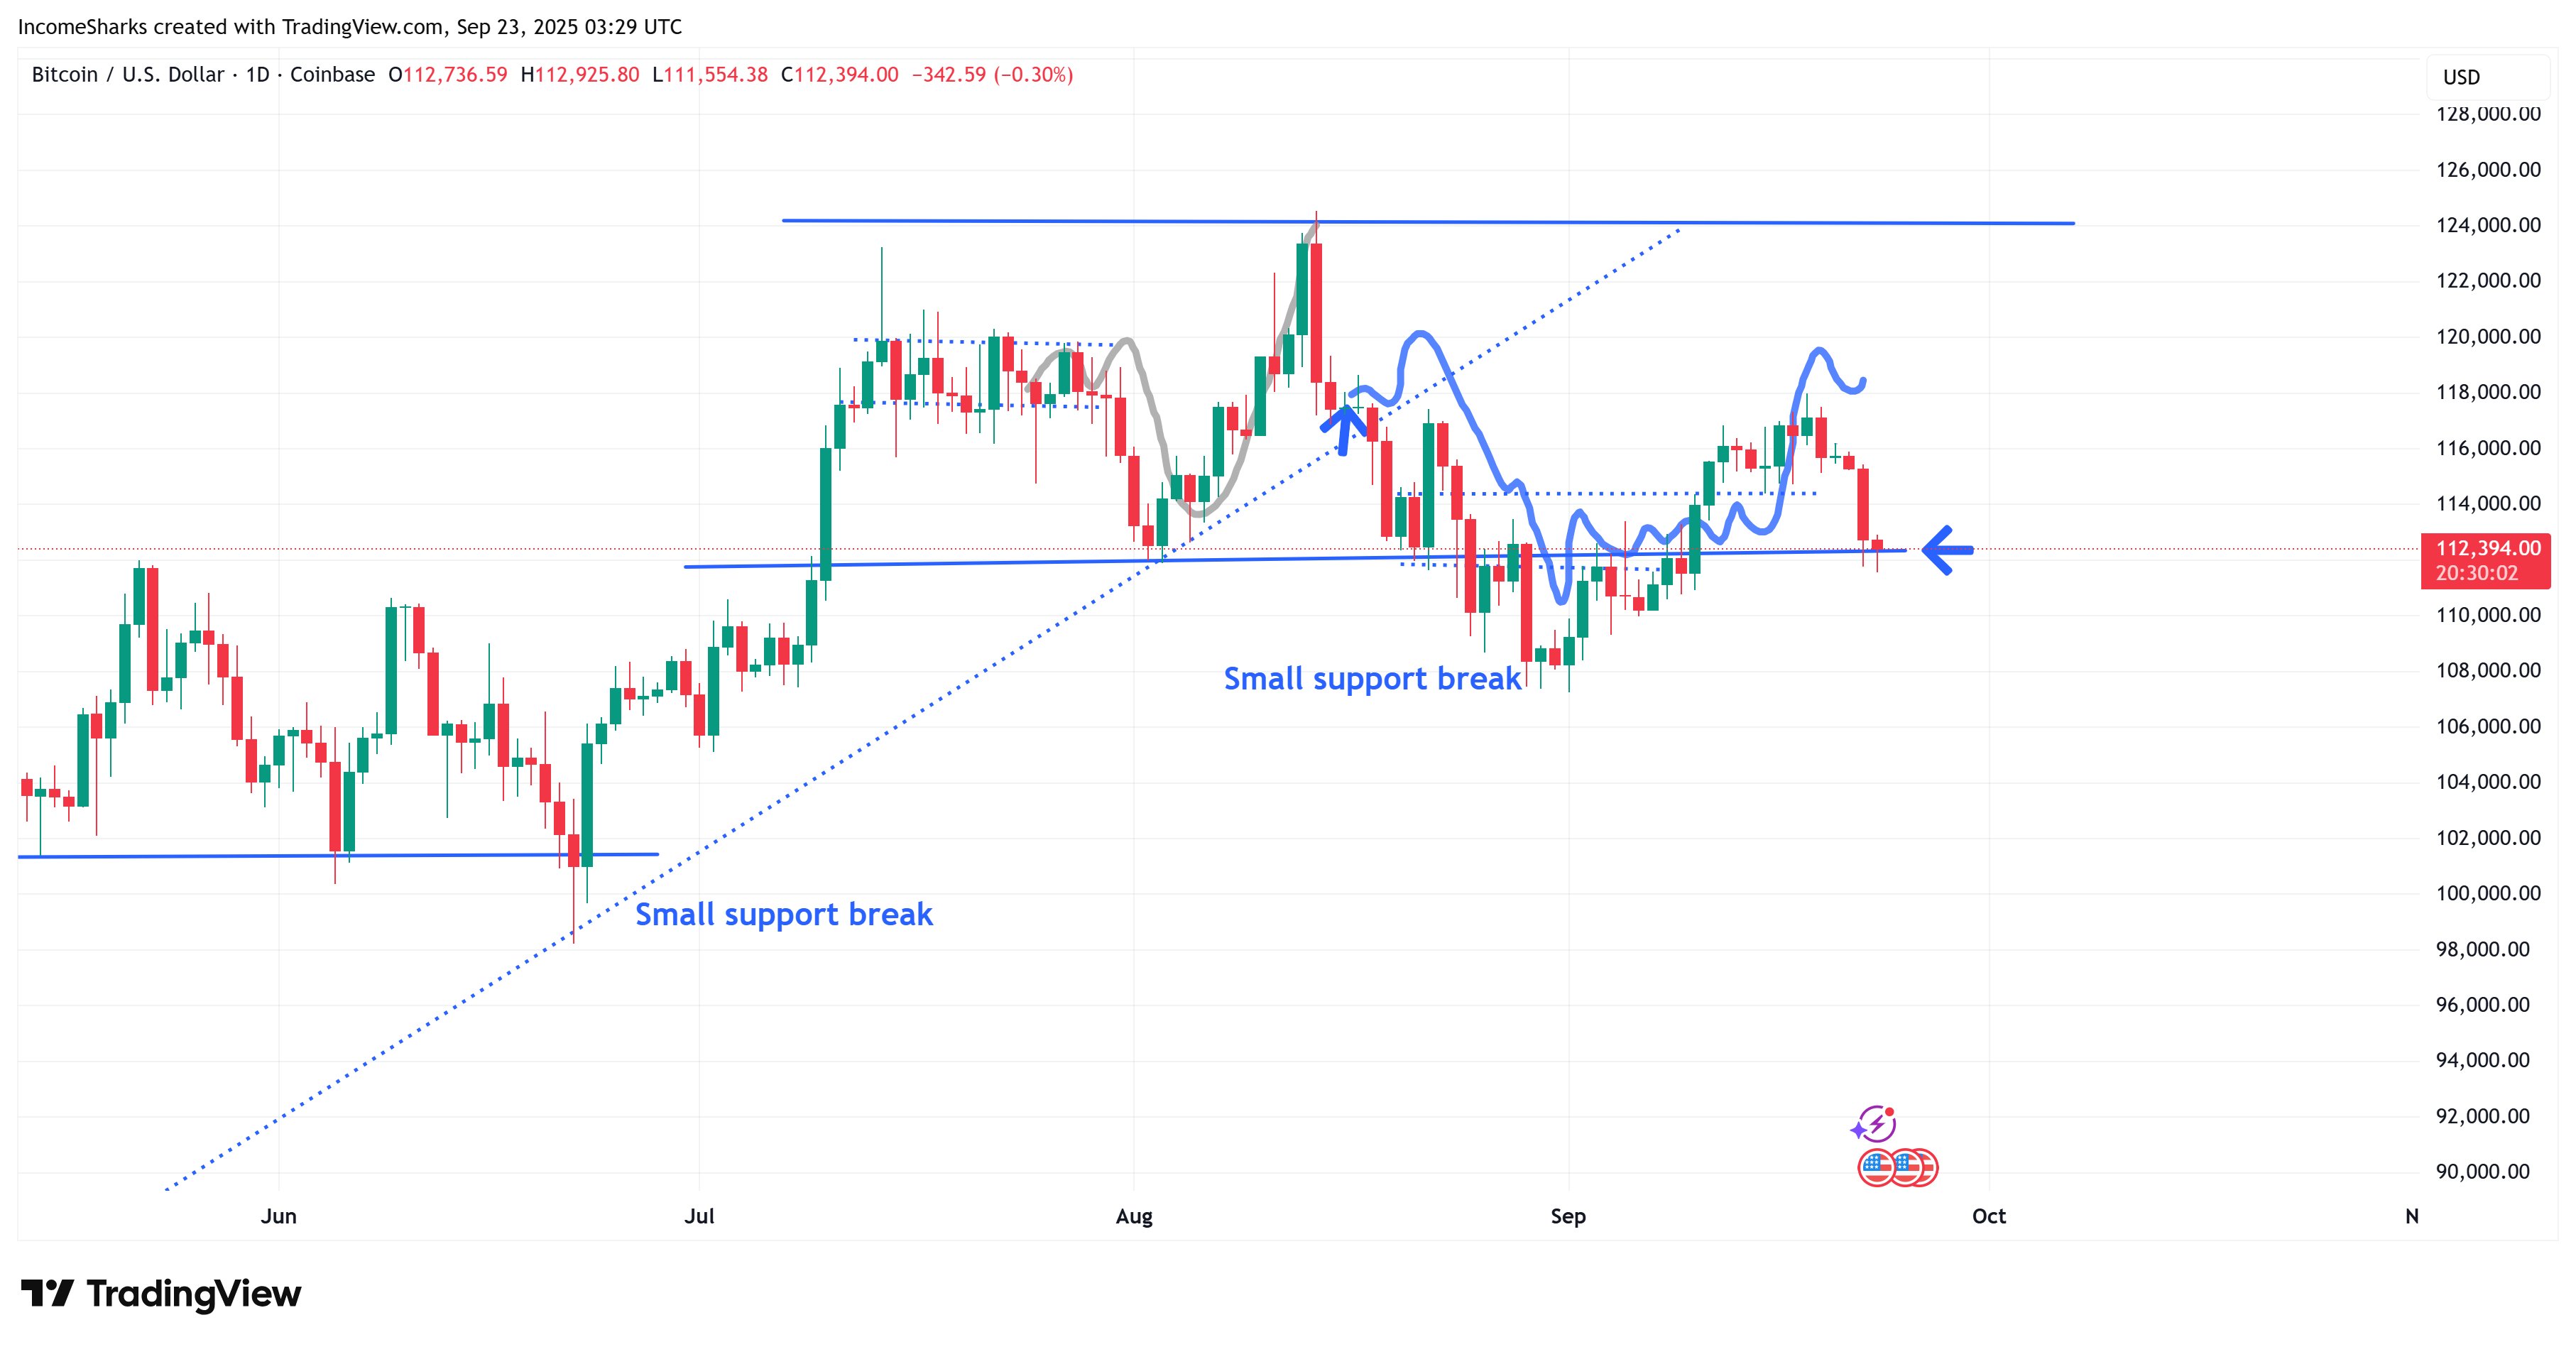
As a result, the analyst sees no reason why people should panic over the drop. He insisted that the squiggles will soon end, and Bitcoin will target higher prices.
Moreover, his daily chart shows that, having held the support of a developing price channel, BTC could target the upper resistance, coinciding with the levels at its current all-time high of $124,457.
Bitcoin Prints Buy Signal—Here’s the Target
Meanwhile, prominent chartist Ali Martinez believes this is the time to buy the Bitcoin dip. With its drop below $113,000 on Monday, the TD Sequential indicator triggered a buy signal on the 4-hour chart, indicating a potential rebound.
As Bitcoin $BTC drops below $113,000, the TD Sequential flashes a buy signal, suggesting it's time to buy the dip! pic.twitter.com/mkvaSwAS2y
— Ali (@ali_charts) September 22, 2025
How high can Bitcoin go? Martinez says to unprecedented prices. The commentator highlighted in a parallel chart that Bitcoin needs upward pressure to complete the right shoulder of a developing inverted head and shoulders (H&S) pattern.
The left shoulder formed with the low of $111,745 on August 22, and the head when Bitcoin dropped to $107,300 in early September. Following the $112,000 support retest yesterday, Martinez noted that a bounce would complete the pattern.

Meanwhile, when Bitcoin finally breaks out from the neckline of the H&S pattern, Martinez predicts a rally to a new all-time high of $130,000. From the current market standing, this represents a 15% price growth.
DisClamier: This content is informational and should not be considered financial advice. The views expressed in this article may include the author's personal opinions and do not reflect The Crypto Basic opinion. Readers are encouraged to do thorough research before making any investment decisions. The Crypto Basic is not responsible for any financial losses.