

Solana must break critical resistance as bearish momentum prevails, though oversold RSI hints at a potential short-term relief bounce.
Notably, over the past 24 hours, Solana (SOL) has seen a slight decline of 0.6%, bringing its current price to $141.10. While this short-term dip appears modest, it caps off a deeper 7-day slide of 15.6%, with SOL falling from highs near $169 to a low around $135 before showing a small recovery. The downtrend is part of a broader negative pattern, with Solana also down 24.2% over the past month.
Despite the price drop, SOL continues to demonstrate strong market fundamentals, boasting a market cap of $78.15 billion and 24-hour trading volume exceeding $5.28 billion, up 64% in the last 24 hours.
Solana Price Analysis
On the technical charts, SOL is showing early signs of a potential short-term reversal after the prolonged downtrend. The daily chart reveals Solana has bounced slightly above its November 16 low, but it remains well below key Fibonacci retracement levels.

Specifically, the price is trading under the 0% retracement level at $146.05, which suggests that bearish momentum still dominates. For bulls to regain control, SOL would need to decisively break above the $160 resistance and ideally reclaim the 38.2% level at $168.68. Until then, any bounce may be viewed as temporary rather than a full trend reversal.

Adding to the cautious outlook is the Relative Strength Index (RSI), currently sitting at 33.66, which places Solana firmly in oversold territory.
An RSI at this level suggests that selling pressure has been excessive and could be nearing exhaustion, often a signal that a short-term relief rally may be on the horizon. What traders will be watching for is bullish divergence, where price makes a lower low but RSI makes a higher low, potentially indicating weakening bearish momentum.
A Do or Die Moment?
Elsewhere, analyst Henry paints a high-stakes picture for Solana, describing it as being on the edge of a “do-or-die” moment. His daily Solana chart shows the price currently testing a strong support zone below $141.
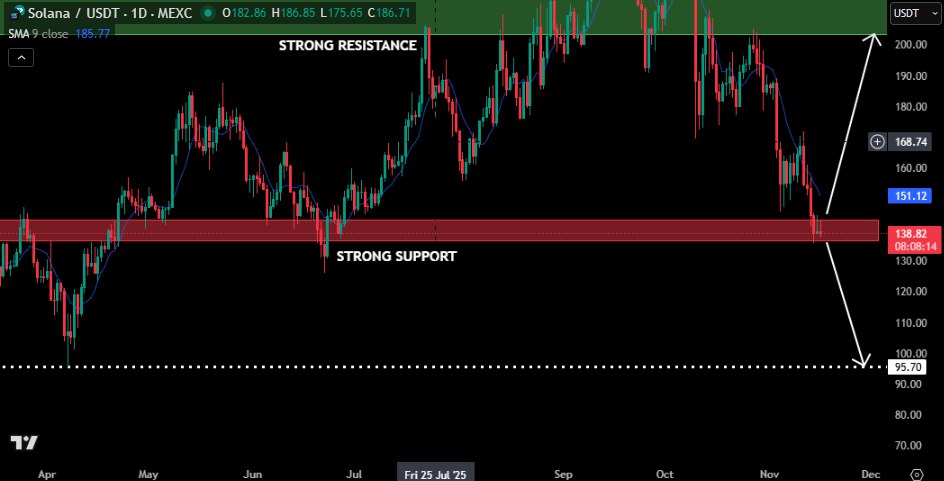
If this support fails, the next potential target is around $95.70, as marked. Conversely, if the support holds, a bounce toward the $150–$170 range is possible, with a longer-term target near the strong resistance at $200.
DisClamier: This content is informational and should not be considered financial advice. The views expressed in this article may include the author's personal opinions and do not reflect The Crypto Basic opinion. Readers are encouraged to do thorough research before making any investment decisions. The Crypto Basic is not responsible for any financial losses.