




XRP is approaching the end of September with a third consecutive positive monthly return, creating a setup that has historically been followed by a red month.
However, the current streak differs from previous examples because XRP has not yet produced the triple-digit monthly expansion seen in several earlier cycles.
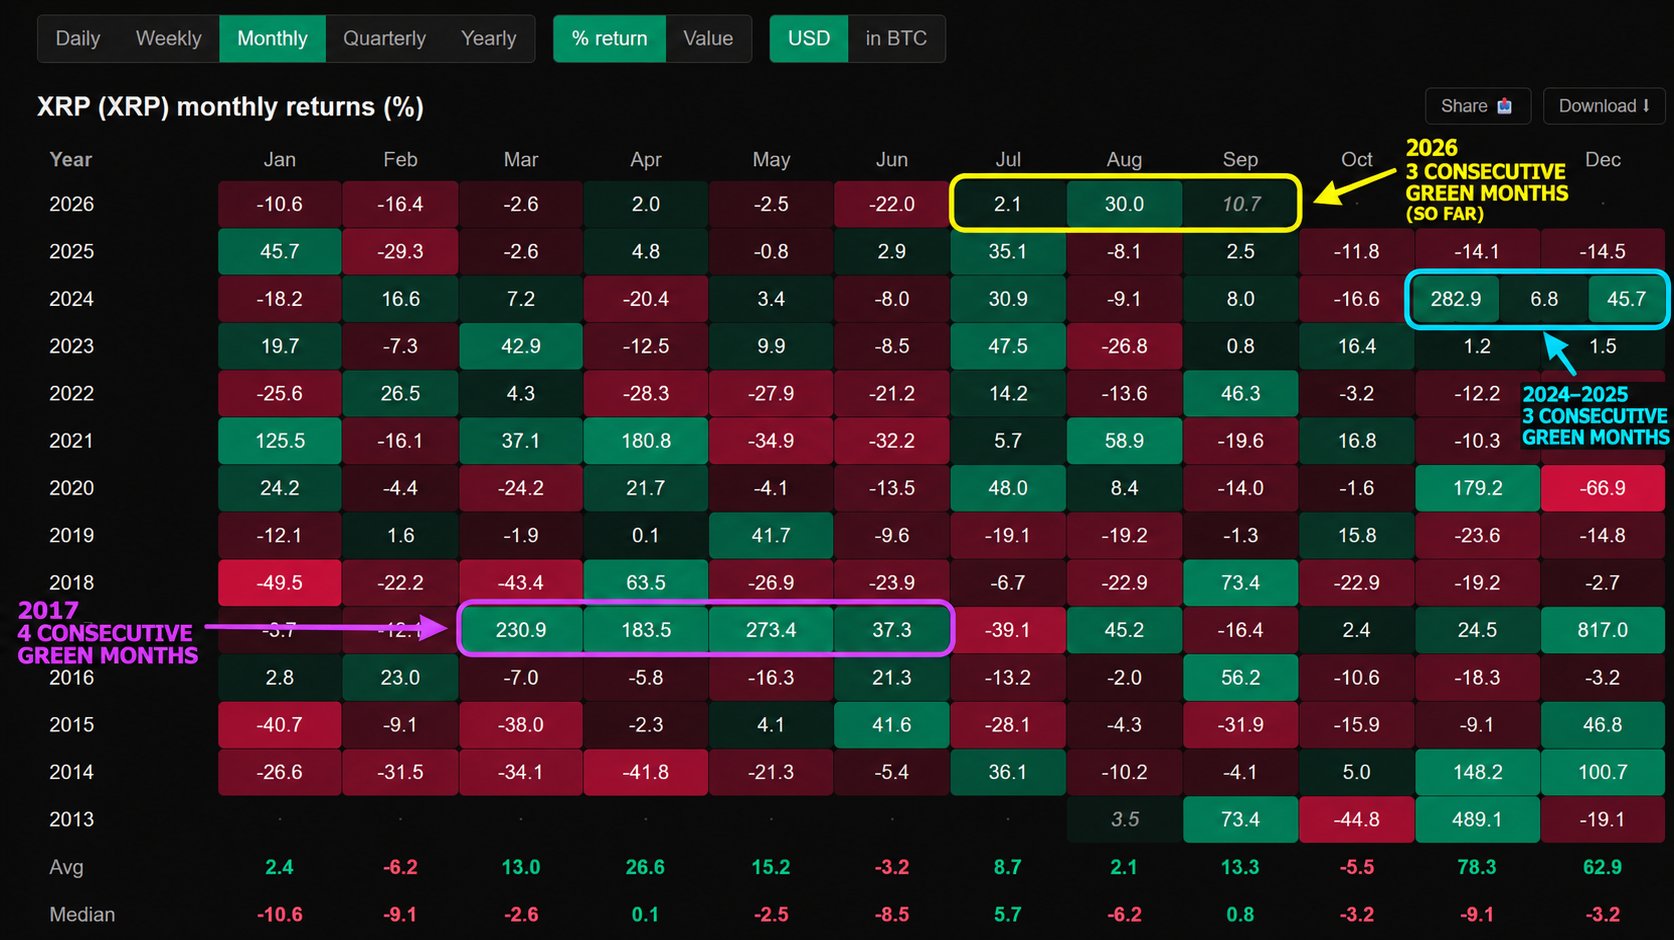
XRP gained 2.1% in July and 30% in August, while September is up about 10.7% so far. Compounded, the three-month advance stands at roughly 46.9%.
XRP currently trades near $1.54, according to CoinGecko. September has not yet closed, meaning the three-month streak is still provisional.
What Happened After XRP’s Previous Green Streaks
The historical comparison identifies four previous periods when XRP recorded at least three consecutive positive months.
The first came in late 2014. After the streak ended, XRP fell 40.7% in the following month. Another sequence developed in 2017, when XRP recorded four consecutive green months from March through June before declining 39.1% in July.
A three-month streak spanning late 2023 was followed by an 18.2% decline, while the November 2024 through January 2025 sequence ended with XRP falling 29.3% in February 2025.
This means all four previous examples were immediately followed by a negative month.
The performance over the following three months was less uniform. XRP declined a compounded 66.6% following the 2014 streak, 26.1% after the 2017 sequence, and 27.8% following the 2024-2025 run. The 2023 example was the exception, with XRP gaining about 2.2% over the next three months.
The sample therefore shows a consistent one-month reversal, but not an identical longer-term outcome.
What Those Historical Drops Would Mean for XRP Today
Using XRP’s current price around $1.54, repeating any of the four historical next-month declines would produce the following mathematical scenarios:
| Historical decline | Equivalent XRP price from $1.54 |
|---|---|
| -18.2% | $1.26 |
| -29.3% | $1.09 |
| -39.1% | $0.94 |
| -40.7% | $0.91 |
This places the historical one-month downside range between approximately $0.91 and $1.26.
The milder 2023-style correction would keep XRP above $1.20, while a repeat of the larger 2014 or 2017 declines would take the token back below $1.
These figures are direct percentage comparisons, not forecasts that XRP will reach those prices.
Three-Month Downside Scenarios Are Even Wider
The historical three-month performances produce a broader range.
If XRP repeated the 26.1% decline that followed the 2017 streak, $1.54 would fall to roughly $1.14.
A repeat of the 27.8% decline following the 2024-2025 streak would place XRP near $1.11.
The most severe example, the 66.6% decline after the 2014 run, would mathematically bring XRP to approximately $0.51.
By contrast, repeating the 2023 outcome of +2.2% would leave XRP near $1.57.
These comparisons show why the historical pattern is more consistent for the first month after the streak than for the full three-month period.
2026 Is Missing the Triple-Digit Expansion Seen in Earlier Cycles
The main difference in 2026 is the size of the monthly gains.
Previous cycles included individual monthly advances of approximately 148%, 231%, 273% and 283% before subsequent corrections. XRP’s strongest month in the current streak has been August at 30%.
That means XRP has recorded three consecutive positive months without yet producing a monthly gain comparable with the largest historical expansion candles.
As a result, two separate observations remain in place: previous three-month green streaks were followed by an immediate red month, but the current cycle has not yet matched the magnitude of expansion seen before several historical reversals.
The first confirmation comes at the September monthly close. If September finishes green, October becomes the fifth historical test of whether XRP again follows a three-month positive streak with a negative month.