




Bitcoin holds near $82,400 as XRP, Bittensor, NEAR, and Sui attempt recoveries. Charts map support, resistance, and the signals needed to strengthen rebounds.
| Asset | USD price | Rolling 24-hour change | Aggregate 24-hour volume | Market-cap rank |
|---|---|---|---|---|
| Bitcoin (BTC) | $82,428 | +0.67% | $22.13 billion | 1 |
| XRP | $1.31 | +0.48% | $1.29 billion | 5 |
| Bittensor (TAO) | $271.81 | +0.03% | $153.68 million | 36 |
| NEAR Protocol (NEAR) | $5.02 | −0.47% | $689.11 million | 20 |
| Sui (SUI) | $1.00 | +0.87% | $528.05 million | 28 |
Bitcoin: Rebound Remains Below the Bollinger Midpoint
Bitcoin closed October 18 at $82,001.70 on Kraken, up 0.76%, after falling to $80,567.90. The recovery left the October 15 low of $79,709 intact, although the completed close remained below Friday’s $82,826 high.
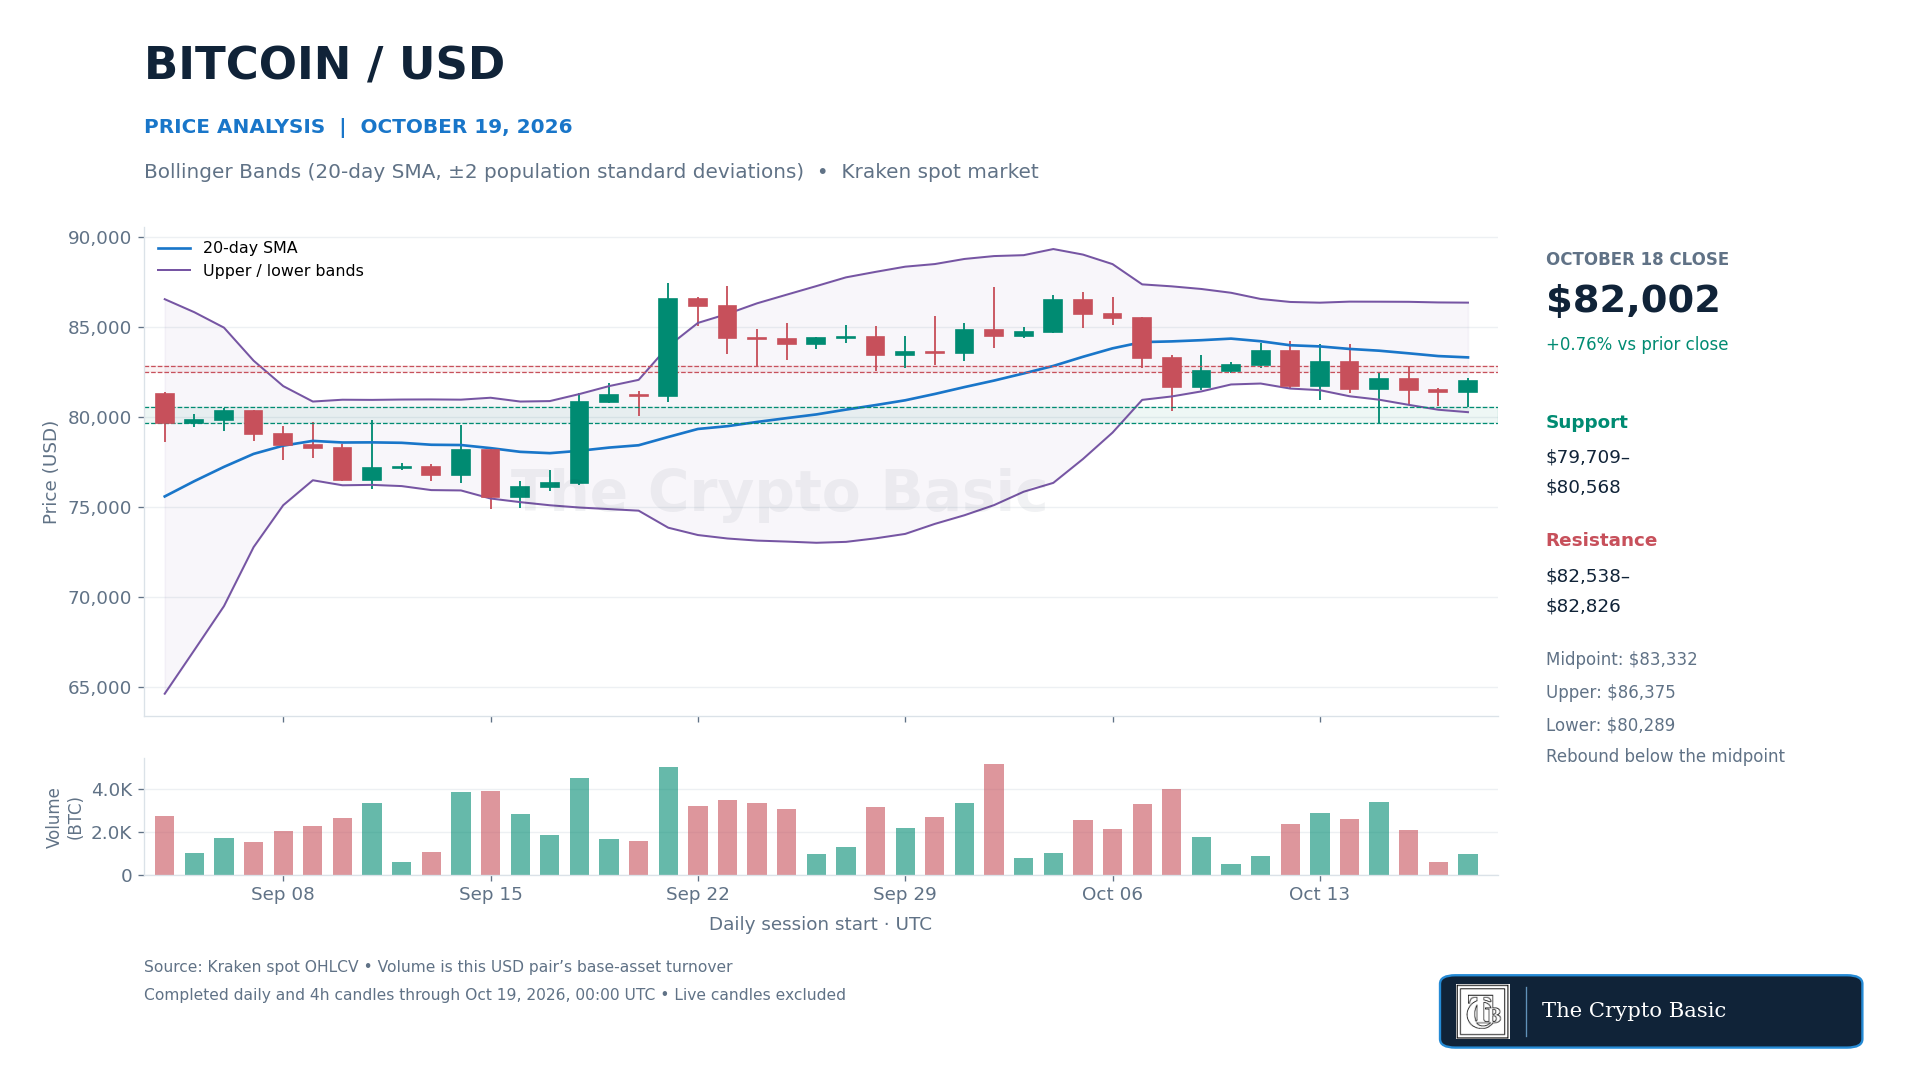
Daily Bollinger Bands, using a 20-day simple moving average and two population standard deviations, placed the midpoint at $83,331.77.
The lower and upper bands stood at $80,288.95 and $86,374.59. Price recovered within the lower half of the envelope, while the midpoint edged down from $83,404.82. That is a rebound beneath a declining average, not a confirmed upside breakout.
Monday’s live candle reached $82,700 by acquisition, clearing Sunday’s $82,177.30 high intraday.
A completed daily close above $82,826 would strengthen the approach to the Bollinger midpoint, followed by the $84,049–$84,250 recent-high area. The band levels will recalculate with subsequent closes.
Losing $80,567.90 on a daily close would weaken the rebound and refocus attention on the lower band and $79,709. A close beneath the latter would invalidate the recent support structure.
The aggregate quote was 0.56% above the October 16 report’s $81,965 snapshot, a modest improvement rather than a decisive range escape.
XRP: New October Low Leaves Falling Averages Overhead
XRP closed Sunday at $1.30573, gaining 1.02% after touching $1.25477, its lowest price so far in October.
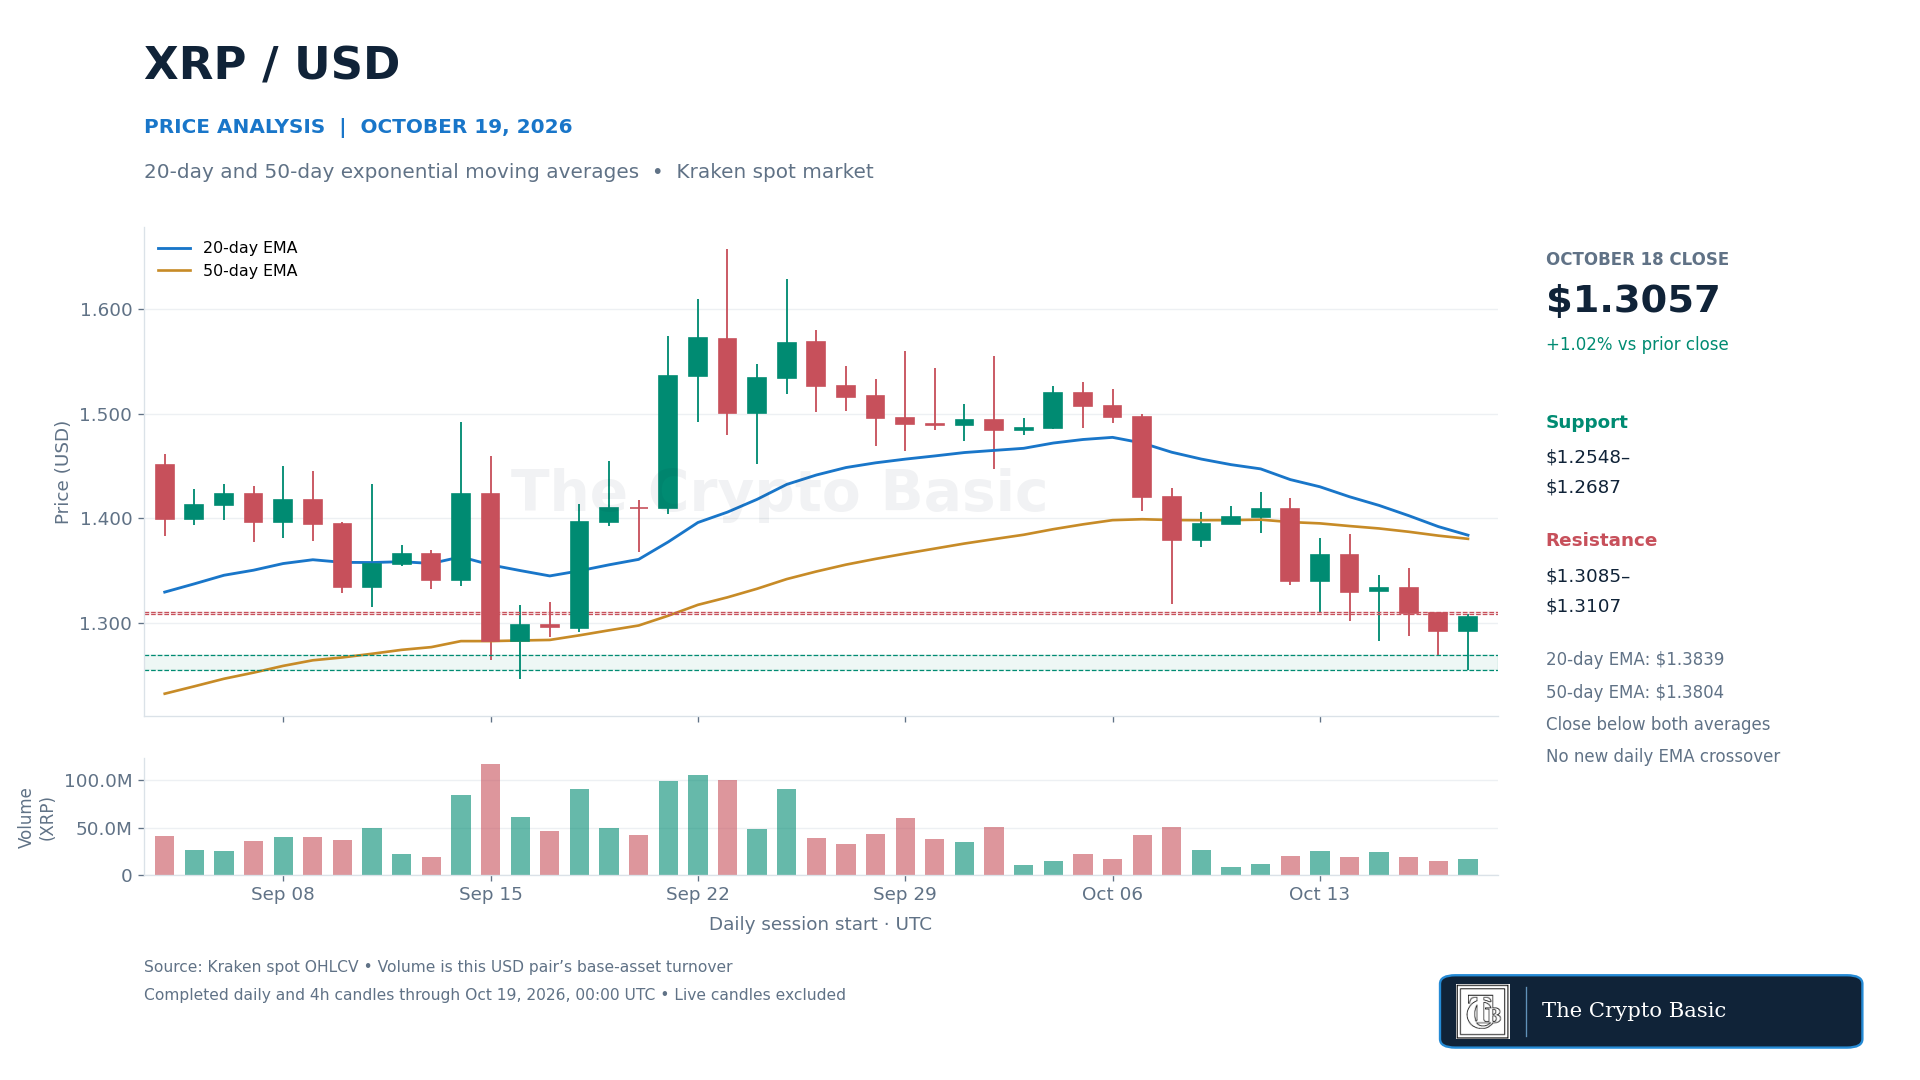
That low undercut the $1.28274–$1.28724 support area tracked in Saturday’s report, but neither weekend daily candle closed below the bottom of that zone.
The distinction matters: support was breached intraday, while a closing breakdown remained unconfirmed. Even after Sunday’s rebound, the close was approximately 0.29% below the $1.30952 close used in the October 17 analysis.
The 20-day exponential moving average fell to $1.38385 and the 50-day EMA to $1.38036. Price remained below both, with the faster average still marginally above the slower one. The latest completed candle therefore did not confirm a new bearish EMA crossover.
A daily close above the $1.30853–$1.31070 weekend-high area would improve the immediate recovery, with $1.33338–$1.35208 the next resistance zone. Reclaiming both daily averages would be a stronger trend-repair signal.
Conversely, losing $1.26870 would leave Sunday’s $1.25477 low exposed. A close below that low would invalidate the rebound and bring the September 16 low of $1.24610 into focus.
Bittensor: MACD Remains Bearish After a Recovery From $254
Bittensor closed October 18 at $270.3569, up 0.51%, after falling to $253.9471. The long lower wick records a recovery from a fresh October low, but the $271.9020 session high remained below Saturday’s $277 peak and Friday’s $290.8425 high.
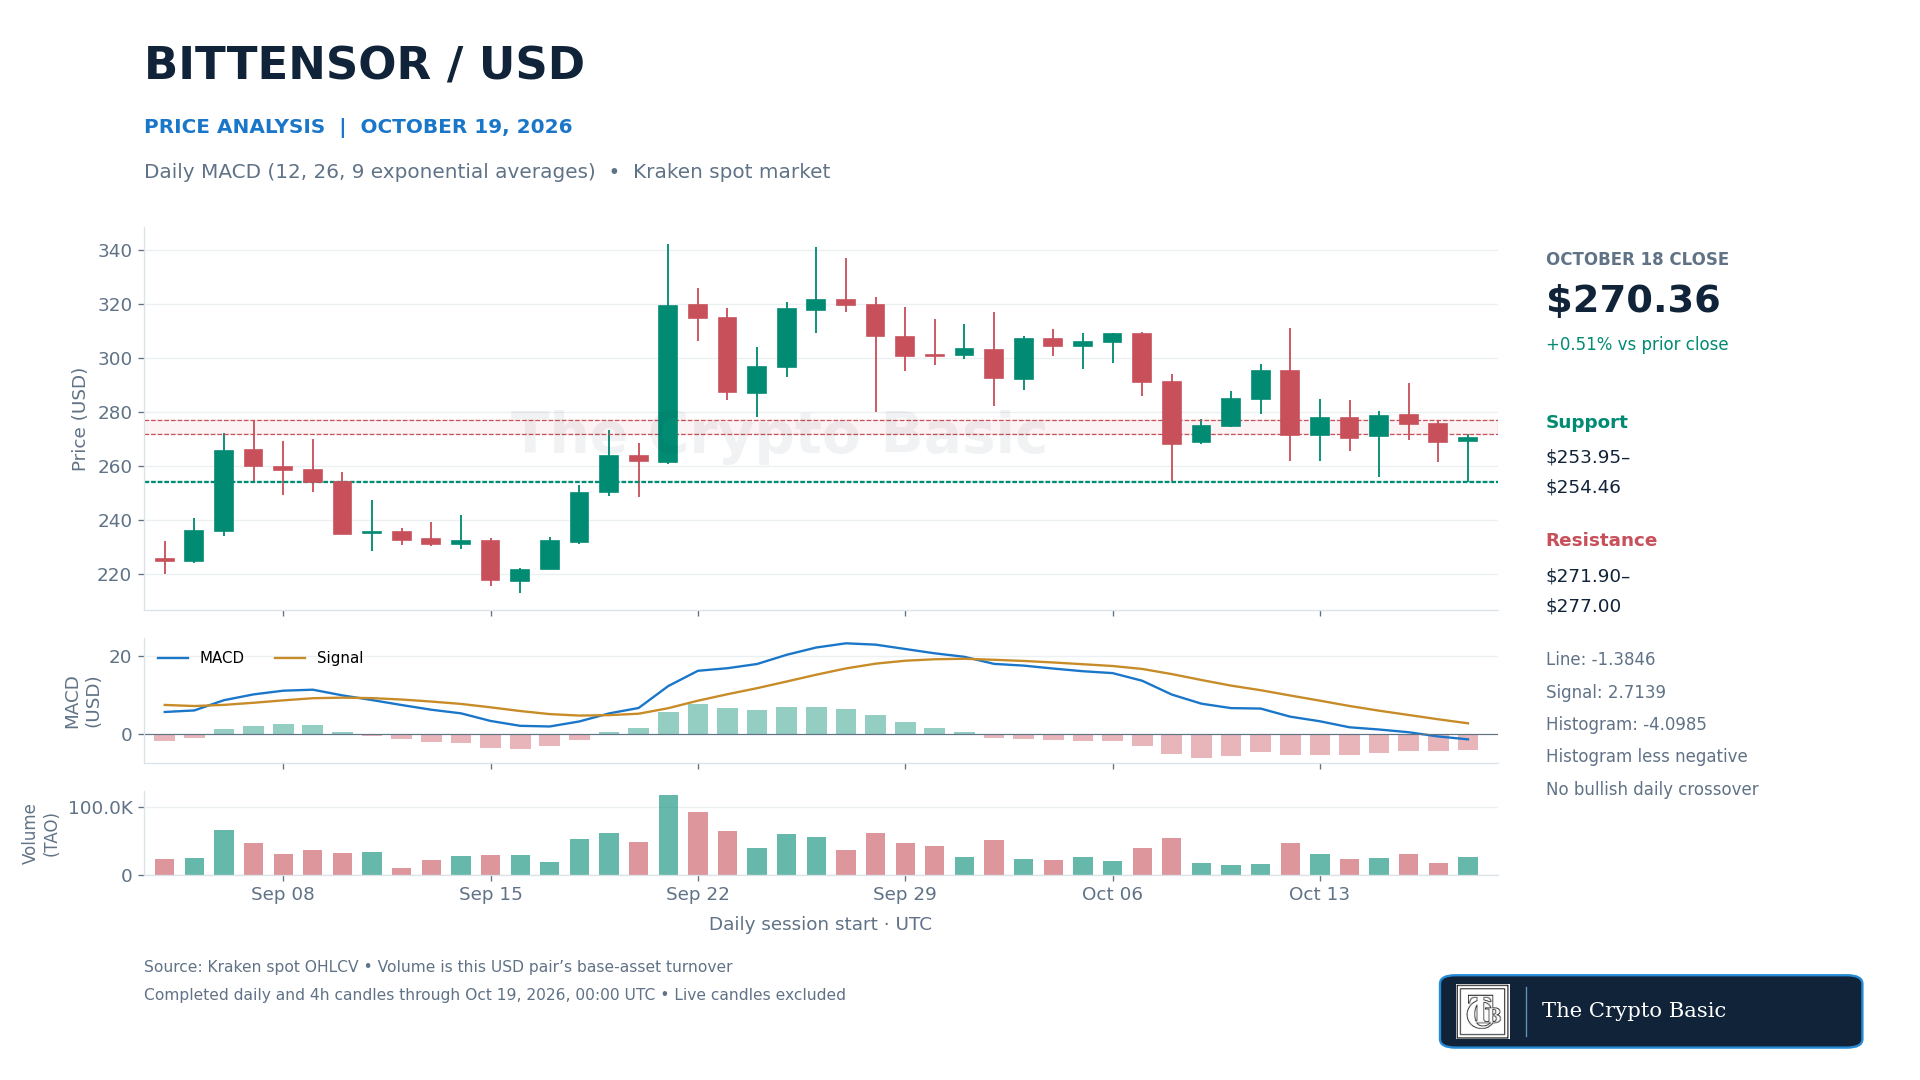
Daily MACD uses 12- and 26-period exponential averages with a nine-period signal EMA. Its line stood at −1.3846 against a 2.7139 signal line.
The histogram narrowed from −4.3918 to −4.0985, showing a smaller bearish line-signal gap, not a bullish crossover. The MACD line itself fell further below zero.
Four-hour MACD also remained below its signal line at the last completed candle. The recovery in price therefore had not yet produced bullish momentum confirmation on either timeframe.
A daily close above $277 would clear the latest two completed session highs and improve the prospects for $284.50–$290.84. Losing the $253.95–$254.46 area, which contains Sunday’s low and the October 8 low, would undermine the rebound.
A daily close below $253.9471 would invalidate that recovery and expose the September 20 low at $248.6678.
NEAR: Recovery Stalls Below the 38.2% Retracement
NEAR closed Sunday at $5.0079, up 3.10%, after recovering from $4.6156. The bounce stayed below the $5.0559 session high and left the token within its pullback from the October 12 peak.
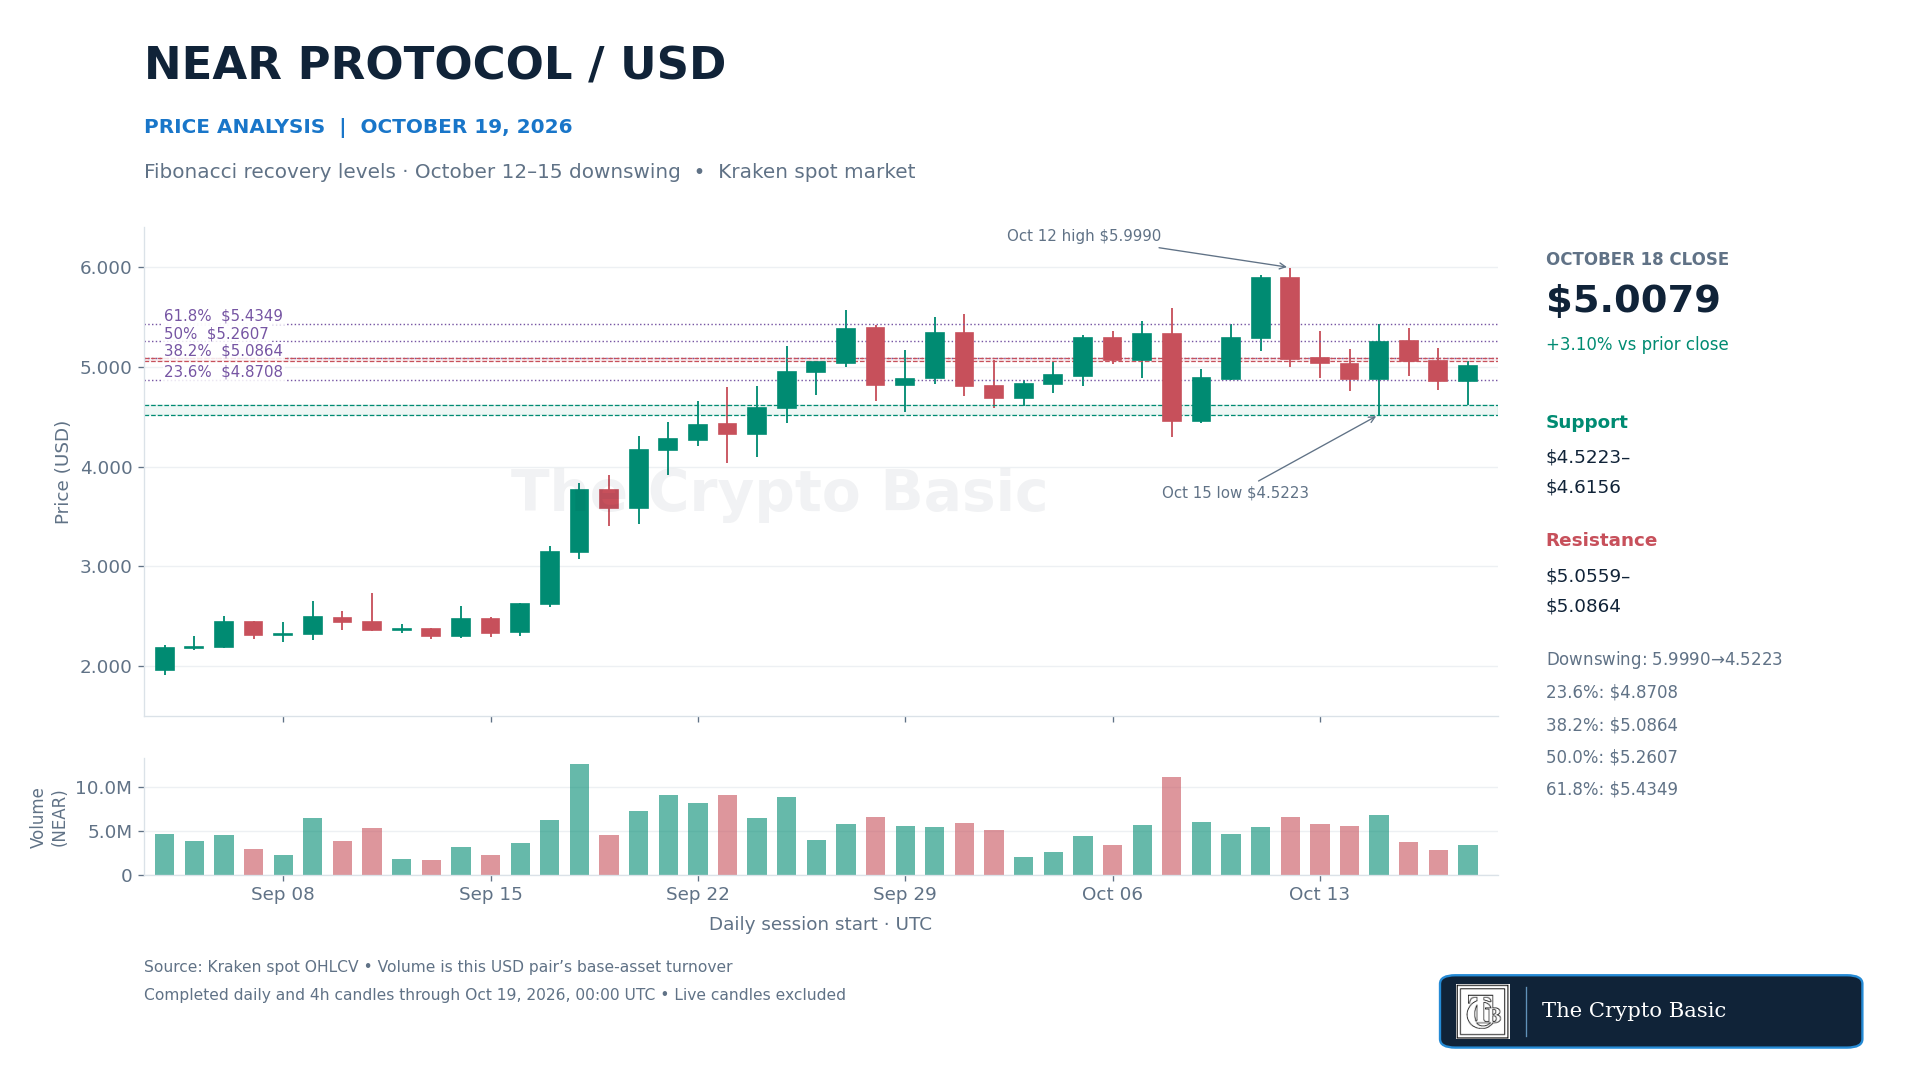
Fibonacci levels measure an upward retracement of the decline from the October 12 high of $5.9990 to the October 15 low of $4.5223. The 23.6% level is $4.8708, 38.2% is $5.0864, the 50% midpoint is $5.2607, and 61.8% is $5.4349.
Sunday’s close reclaimed 23.6% but remained below 38.2%. Monday’s live candle reached $5.0855 by acquisition, just short of the latter reference. Neither that intraday approach nor the daily rebound confirmed a break above it.
A daily close above $5.0864 would strengthen the recovery toward $5.2607 and then $5.4349, close to the October 15 high of $5.4369. A close back below $4.8708 would weaken the rebound toward $4.6156.
A new low below $4.5223 would invalidate these recovery anchors, require recalculation, and reopen the October 8 low of $4.2937 as a structural reference.
Sui: RSI Improves but Remains Below Neutral
Sui closed October 18 at $0.9960, rising 2.14% after setting a fresh October low of $0.9364. The close remained beneath the $1 psychological level and Saturday’s $1.0195 high, leaving the recovery incomplete.
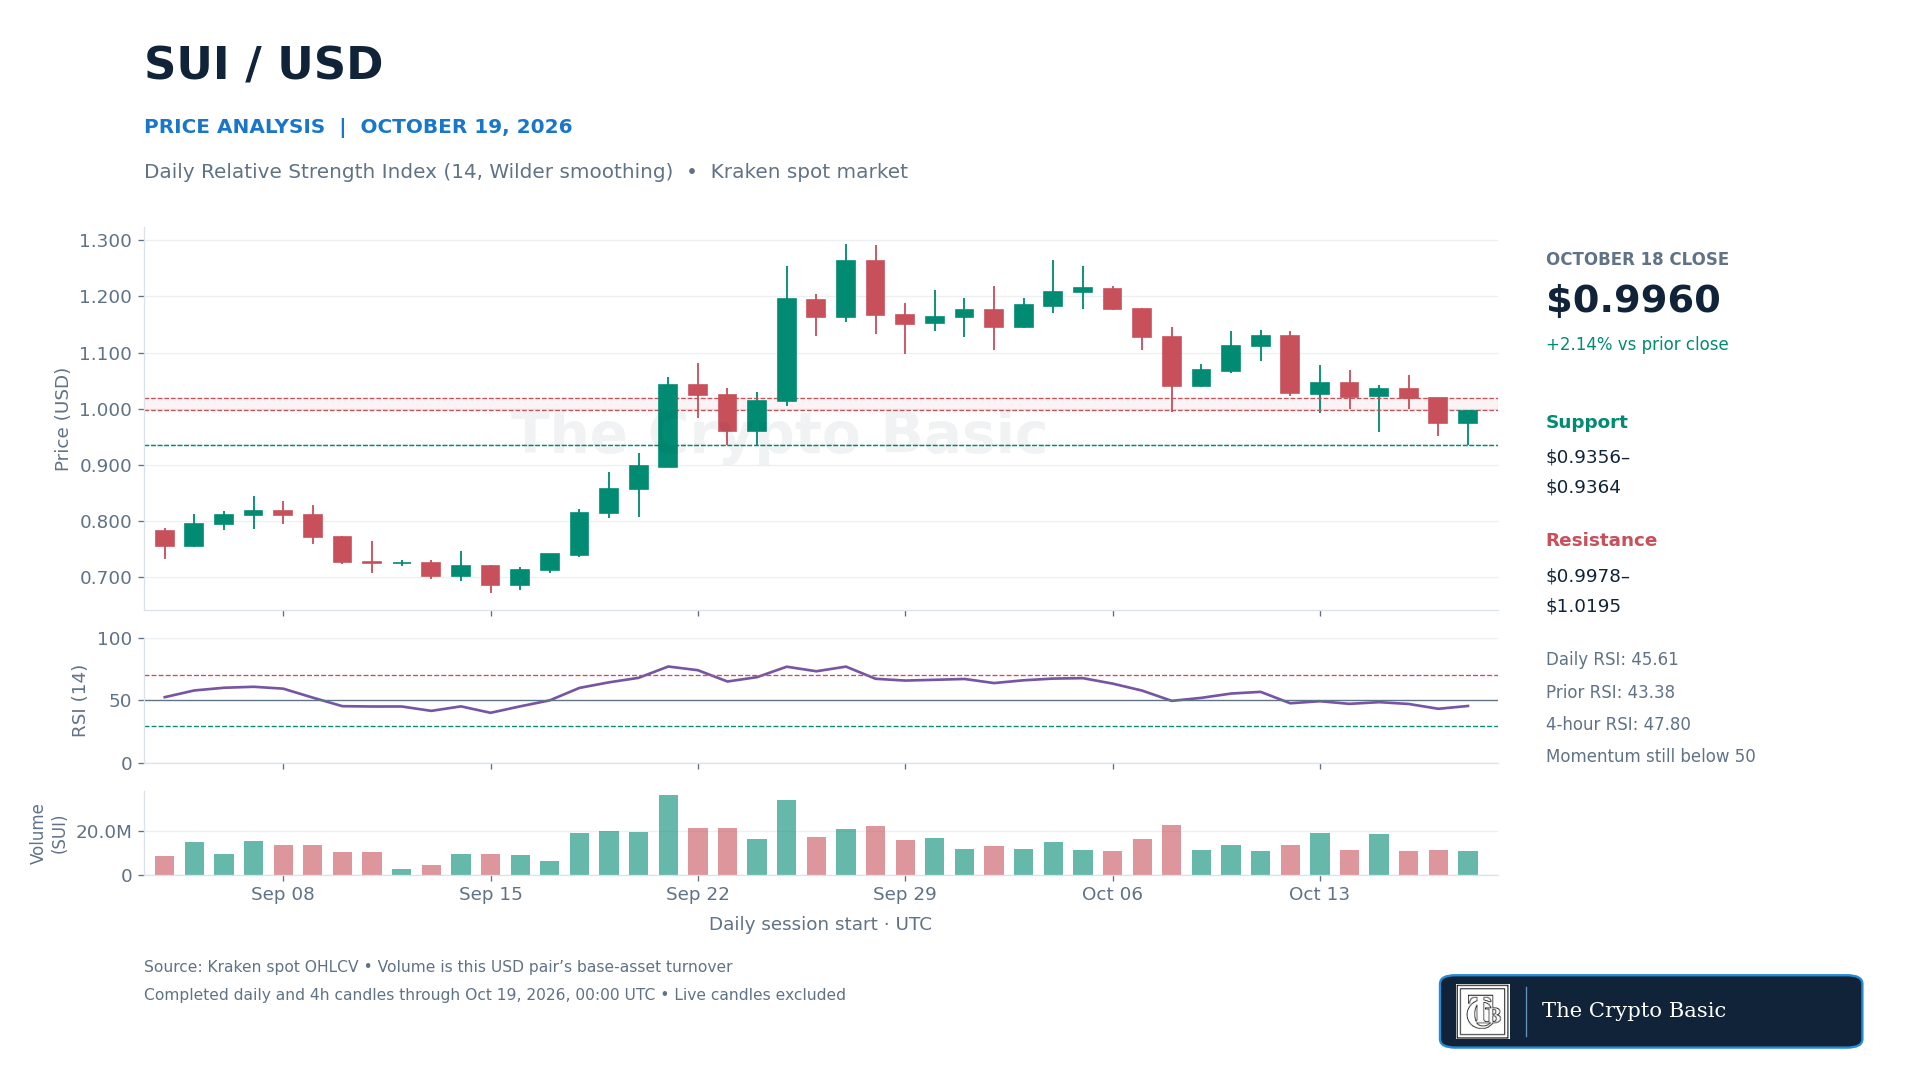
The 14-period daily RSI, calculated with Wilder smoothing, rose from 43.38 to 45.61. Momentum improved but stayed below the neutral 50 threshold.
Four-hour RSI at 47.80 likewise remained below neutral, supporting a stabilization attempt rather than confirming a sustained upward trend.
The $0.9356–$0.9364 area combines the September 24 low with Sunday’s low. A daily close below $0.9356 would invalidate that support and expose the September 21 low at $0.8958.
For a stronger recovery, Sui needs a daily close above $0.9978–$1.0195, followed by progress toward $1.0417–$1.0602.
RSI moving above 50 would provide supporting momentum evidence, but would not replace those price conditions.
Monday’s live candle touched $1.0100. That move alone did not clear the full resistance zone or establish a closing breakout.