




XRP is compressing below $1.65 on the four-hour chart, with $1.70 upside and $1.27-$1.10 support levels coming into focus.
Casi trades in his new XRP chart says XRP is running out of room inside a tightening four-hour structure, with price still trapped below the $1.64-$1.65 resistance area.
The latest setup leaves two very different paths open: another push toward $1.70, or a deeper retracement if buyers fail to break the ceiling.
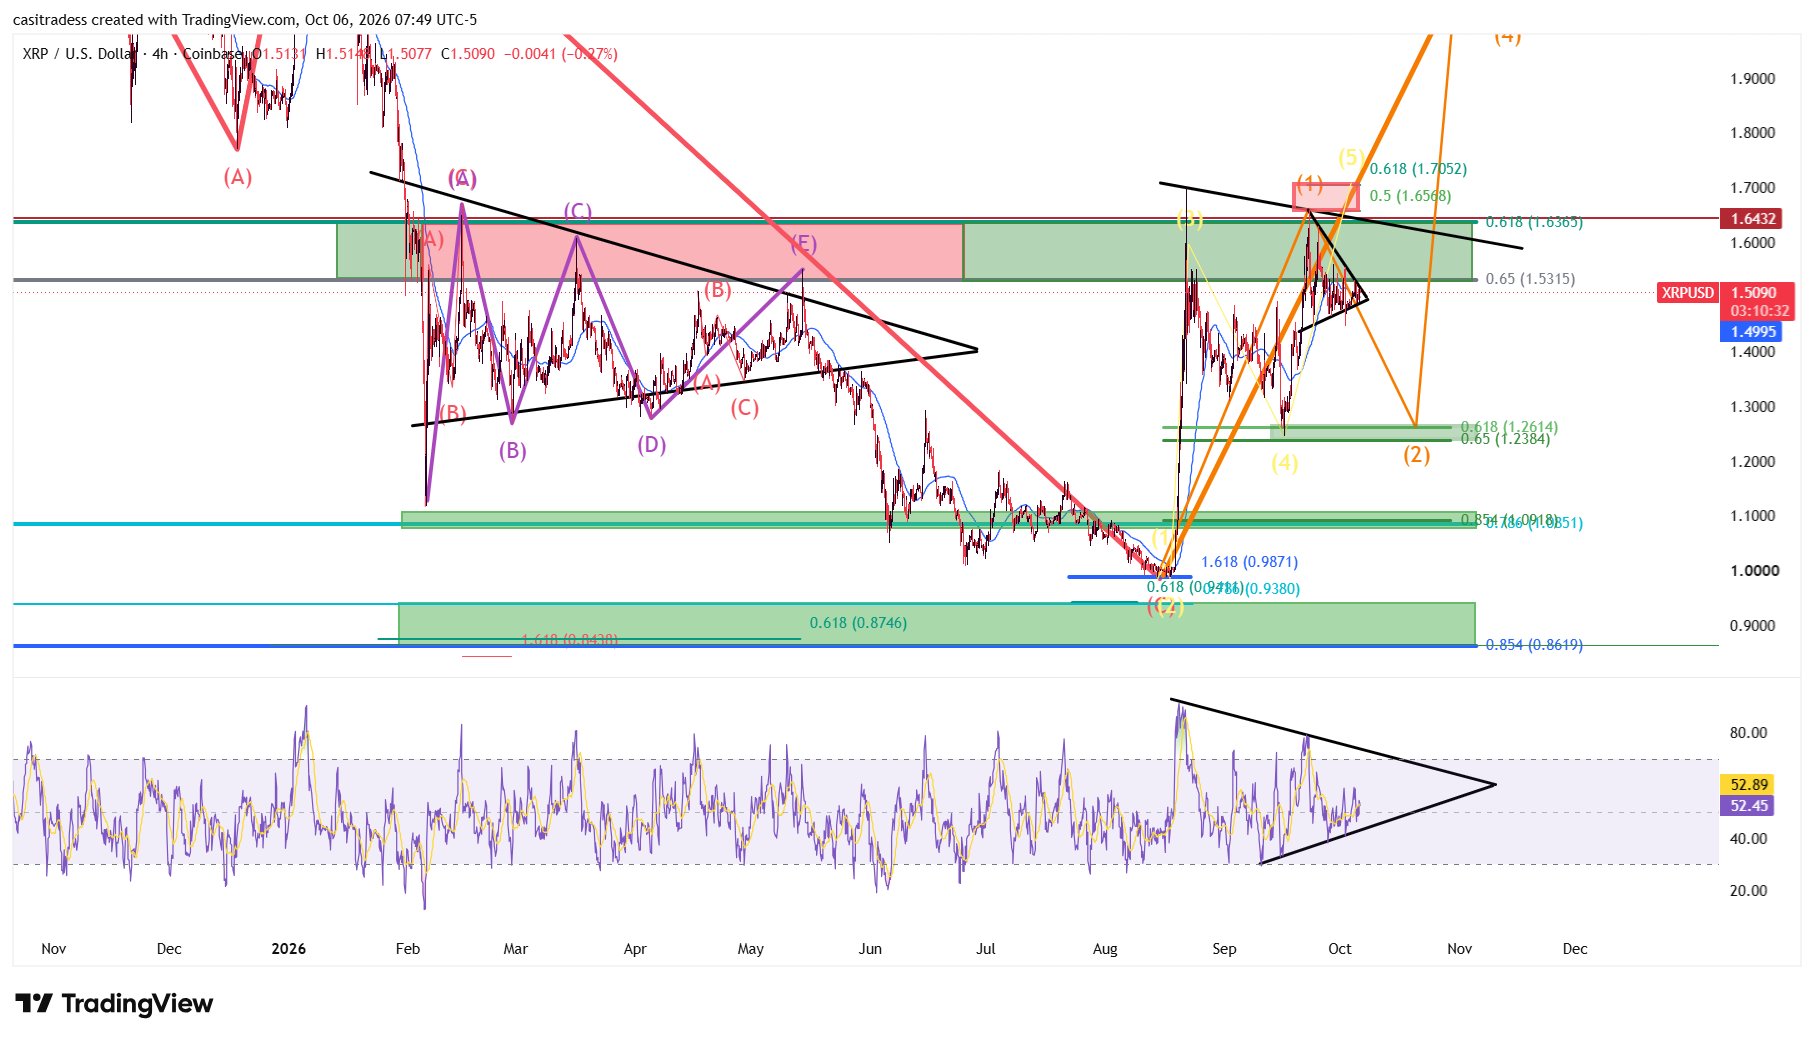
The Coinbase XRP/USD chart, dated Oct. 6, places XRP around $1.50. Price has spent the past several sessions forming a smaller triangle after its latest attempt to break the broader resistance zone.
CasiTrades expects that compression to resolve soon as the trendlines move closer together.
XRP Remains Below the $1.65 Barrier
The main obstacle sits between roughly $1.6363 and $1.6432, where a Fibonacci resistance level overlaps a broader horizontal ceiling.
Just beneath it, $1.5315 is another nearby level XRP needs to reclaim before making a cleaner run at the upper zone.
The chart shows XRP previously reaching the $1.65-$1.70 area before pulling back into the current consolidation. If the smaller wave structure still has another leg to complete, one final advance could take price toward $1.6568-$1.7052.
From $1.5090, a move to $1.70 would require an increase of about 12.7%.
However, another high is not required by the wave count. XRP could also fail from the current structure and move directly into the larger correction mapped on the chart.
RSI Is Compressing Alongside Price
Momentum is showing almost the same indecision.
The chart places RSI near 52.89, with its accompanying average around 52.45. Both sit close to the middle of the range, while RSI itself is tightening between descending and rising trendlines.
That makes the next price rally particularly important.
If XRP reaches the $1.65-$1.70 region while RSI fails to exceed its previous high, the setup would produce another bearish divergence. That would support the idea that the current advance is losing momentum.
A stronger price breakout accompanied by RSI breaking its own resistance would tell a different story.
$1.27 and $1.10 Become Important if XRP Rolls Over
If the current wave completes and a larger retracement begins, the chart identifies the $1.26-$1.24 region as the first major support area. CasiTrades rounds that zone to roughly $1.27.
Below it, another major retracement area sits around $1.10.
A decline to $1.27 from $1.5090 would equal roughly 16%, while a move to $1.10 would represent about 27% downside.
The deeper $0.90 region is treated differently. A return there would challenge the developing higher-low structure and force the current wave count to be reconsidered.
There is also a bullish alternative. A forceful move through $1.65 and toward $1.80 would give XRP room to retest the former ceiling from above. Holding $1.65 as support after such a move would materially change the four-hour structure.
XRP currently sits between a tightening short-term triangle and the larger resistance overhead, and the next break will likely decide whether it tests $1.70 again or starts a deeper retracement.