



XRP’s weekly RSI is testing 20 again after a brief rebound. With XRP near $0.95, the weekly close could help distinguish a second momentum low from further weakness.
XRP’s weekly relative strength index has returned to the 20 area soon after recovering from below it. EGRAG Crypto highlighted the speed of that second test. In earlier cycles,
XRP’s weekly momentum had more time to recover after crossing back above 20. This time, the rebound stalled just above the threshold while XRP was still trading below $1.
XRP traded at $0.9530 on Bitstamp at 08:08 UTC on November 16, down 2.11% from the previous weekly close. The new week had opened at $0.97361 and traded between $0.94853 and $0.97411. With more than six days left in the candle, both the price and the weekly RSI reading were still provisional.
Why XRP’s Second RSI Test Matters
Weekly RSI compares the size of recent weekly gains with recent weekly losses on a scale from zero to 100. Traders commonly use 30 as the oversold threshold. EGRAG’s framework uses 20, a more extreme reading that requires losses to outweigh gains by a wider margin.
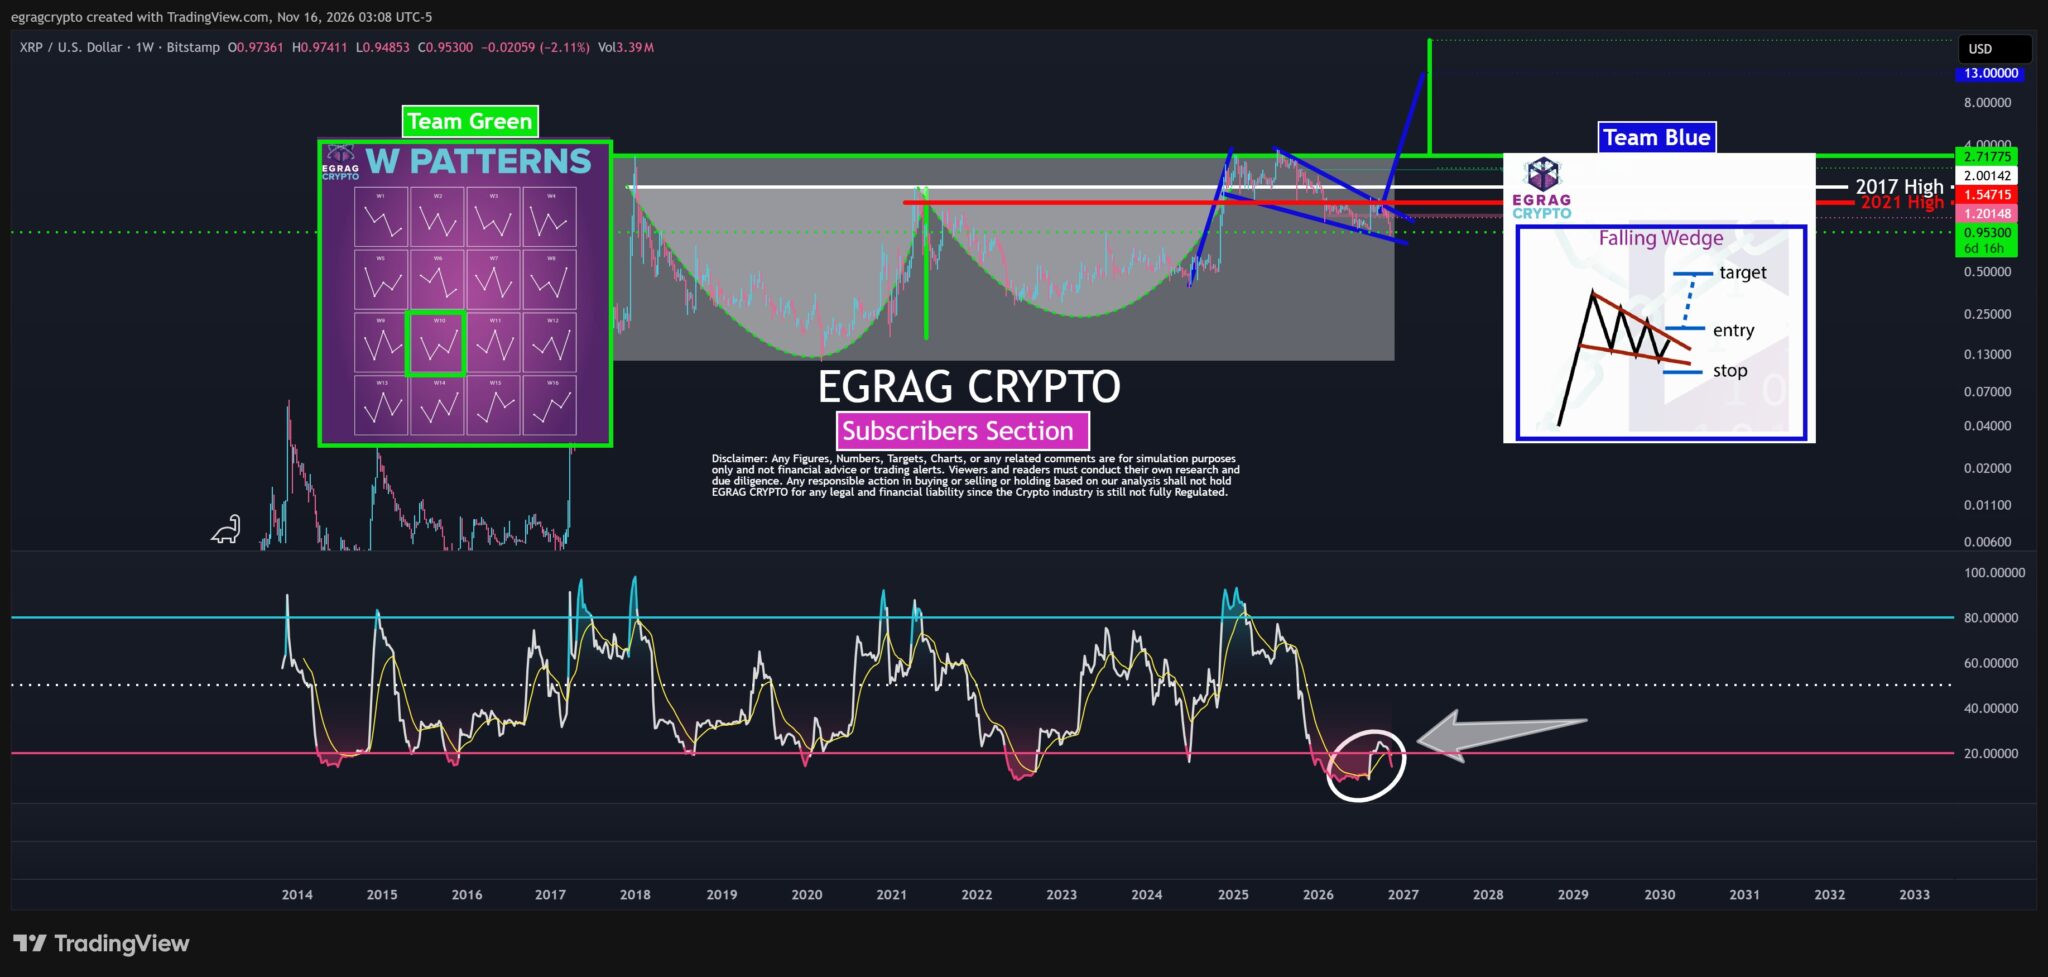
The recent sequence unfolded in three stages. First, XRP’s weekly RSI fell below the pink line at 20 and spent time in the low teens. It then recovered into the mid-20s before turning back toward 20.
That brief rebound stands apart from the recovery after the 2022 trough, when RSI climbed away from 20 and eventually moved above the midpoint at 50. Deeply oversold readings have occurred before. What EGRAG considers unusual in this cycle is how quickly the first recovery gave way.
A second trough near 20 could form the right side of a W in momentum. A weekly close back above 20 would be an initial sign of stabilization. A subsequent push above the intervening peak in the mid-20s would give that interpretation more weight.
Conversely, repeated weekly closes below 20 would leave XRP vulnerable to another test of the earlier RSI low. Either outcome concerns the strength of the decline. A price bottom would require separate evidence, as in the earlier XRP daily double-bottom setup near $1.
How the RSI Retest Fits the Green and Blue XRP Scenarios
EGRAG’s Team Green interpretation covers several years of XRP price history. Two broad, rounded troughs form a possible W beneath a horizontal boundary near $2.72.
At $0.9530, XRP was still far below that boundary. Even a successful weekly RSI rebound would leave considerable distance before price could challenge it.
Team Blue focuses on the decline from the 2025 highs. Two descending blue lines connect successively lower highs and lows, narrowing into a possible falling wedge.
Under that interpretation, the first price signal would be a break above the wedge’s upper edge. The blue projection extends toward $13 only after an upside breakout. The RSI reading itself supplies no such target.
For the nearer term, XRP’s decline alongside the broader crypto market leaves two developments to watch independently: whether weekly RSI can hold 20 and clear its recent rebound high, and whether XRP can break the sequence of lower price highs inside the wedge.
The first would mark improving momentum. The second would give that improvement a visible counterpart in price.