




XRP may have weathered the worst of its current bear cycle, with long-term indicators indicating that further declines could present good buying opportunities.
After months of falling prices, the cryptocurrency dropped below key support levels before recovering. Its recent price movement, alongside signals from previous market cycles, now suggests XRP is approaching a bottom.
XRP Mirroring the 2022 Bear Cycle Pattern
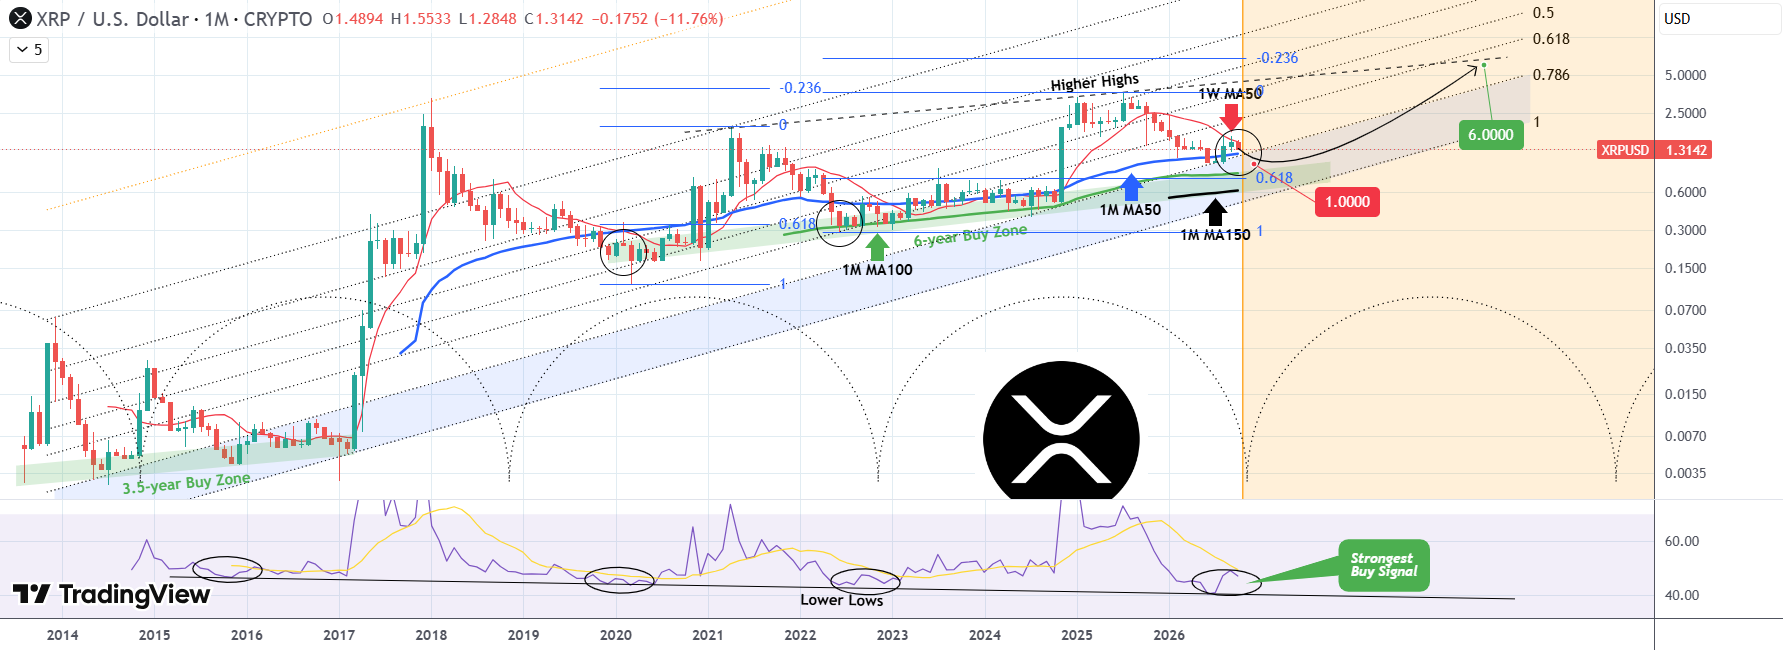
XRP’s recent price movement shares several similarities with its 2022 bear cycle. In May 2022, the collapse of the Terra ecosystem pushed XRP below its 1-month 50-period moving average (1M MA50).
A month later, the cryptocurrency also fell below its 1-month 100-period moving average (1M MA100). XRP eventually reached $0.29 in June 2022, marking the bottom of that bear cycle.
A similar pattern has developed in 2026. Specifically, XRP fell below the 1M MA50 in June, when the indicator stood at $1.1986, before declining further to $0.9874 in August.
However, the current cycle is different from 2022 because XRP has not fallen below the 1M MA100, which now stands at $0.84. Instead, the cryptocurrency has recovered above the 1M MA50.
XRP could still fall toward $0.84 or revisit the 0.618 Fibonacci level before reaching a final bottom. However, the similarities with 2022 suggest that much of the current decline may already be over.
Whether XRP has established a lasting bottom will depend on how the price responds to these support levels in the coming months.
XRP Still Needs to Break Above the Weekly MA50
XRP’s recent monthly performance shows that the recovery has not yet gained enough strength to confirm a new bull market.
In August 2026, the cryptocurrency rose 30%, recording its strongest monthly gain since July 2025. Despite this rally, XRP closed August at $1.38, below the weekly 50-period moving average (1W MA50) at $1.67.
The price improved further in September, gaining 7.9% during the month. However, XRP closed September at $1.4894, still below the 1W MA50 at $1.55. The cryptocurrency currently trades at $1.3034, while the 1W MA50 stands at $1.4922.
These repeated failures to break above the indicator show that XRP still faces resistance as it attempts to recover. However, the pattern could also reflect the slow process of forming a market bottom, not the start of another major decline.
A sustained close above the 1W MA50 would provide an important sign that buyers are gaining control, and the recovery is becoming stronger.
XRP Monthly RSI
The monthly Relative Strength Index also shows the possibility that XRP is approaching the end of its bear cycle. The 1M RSI currently stands at 49.24, slightly below its moving average at 51.07.
Previous market cycles suggest that readings around this area can appear near important long-term buying opportunities for XRP. Historically, the RSI’s interaction with its Lower Lows trend-line has helped identify some of XRP’s strongest recoveries.
However, during the 2022 bear market, the indicator did not reach the trend line directly. Instead, it moved sideways, following a pattern that had also appeared in 2020. Despite not touching the line, the RSI still provided a valid entry signal near the market bottom.
The monthly RSI has historically remained below its moving average while XRP traded beneath the 1W MA50. A break above both indicators would present stronger technical evidence that a new bull cycle has begun.
This confirmation could still be three to four months away, but the current readings suggest that both indicators may gradually move toward a more favorable position.
XRP Could First Target $6
Meanwhile, two major support areas form the foundation of the longer-term outlook for XRP. First, the six-year Buy Zone, which ranges from $0.4180 to $0.6014, has preceded every major XRP bull rally. This zone provided support before the strong price increases of 2020/2021 and 2024.
The 13-year Buy Zone also presents potential support. It follows the 0.786-to-1.0 Fibonacci range within the Fibonacci Channel.
XRP could revisit $1.000 before beginning to form higher lows. If this happens, the price would move closer to this longer-term support structure, potentially creating a base for another major rally.
Once the next bull cycle gains strength, the initial price target stands at $6.000, slightly below the -0.236 Fibonacci extension. This extension also marked the ceiling associated with XRP’s July 2025 high.
However, to reach this target, XRP must first break above the Higher Highs trendline, which currently limits sustained price gains.
The next bull cycle could last for an extended period, with shorter bursts of sharp price increases along the way. This would resemble the price action that followed the 2022 bottom.