




Pump and Quant lead losses as Ethereum and XRP retreat. October 23 analysis maps MACD, ATR, RSI, moving averages, and key Bollinger support levels.
| Asset | Aggregate USD price | Rolling 24-hour change | Aggregate 24-hour volume | Market-cap rank |
|---|---|---|---|---|
| Ethereum | $2,408.16 | -1.46% | $12.41 billion | 2 |
| XRP | $1.32 | -1.85% | $1.51 billion | 5 |
| Quant | $189.24 | -6.05% | $63.83 million | 40 |
| Pump.fun | $0.00464788 | -6.56% | $183.20 million | 48 |
| Injective | $8.22 | +0.72% | $132.49 million | 85 |
Ethereum MACD Weakens After a 3.5% Daily Decline
Ethereum closed October 22 at $2,386.08, down 3.46%, after trading between $2,357.35 and $2,480.55. The candle reversed Wednesday’s advance, closed below the October 21 low at $2,434.51 and returned price to the lower portion of its recent range.
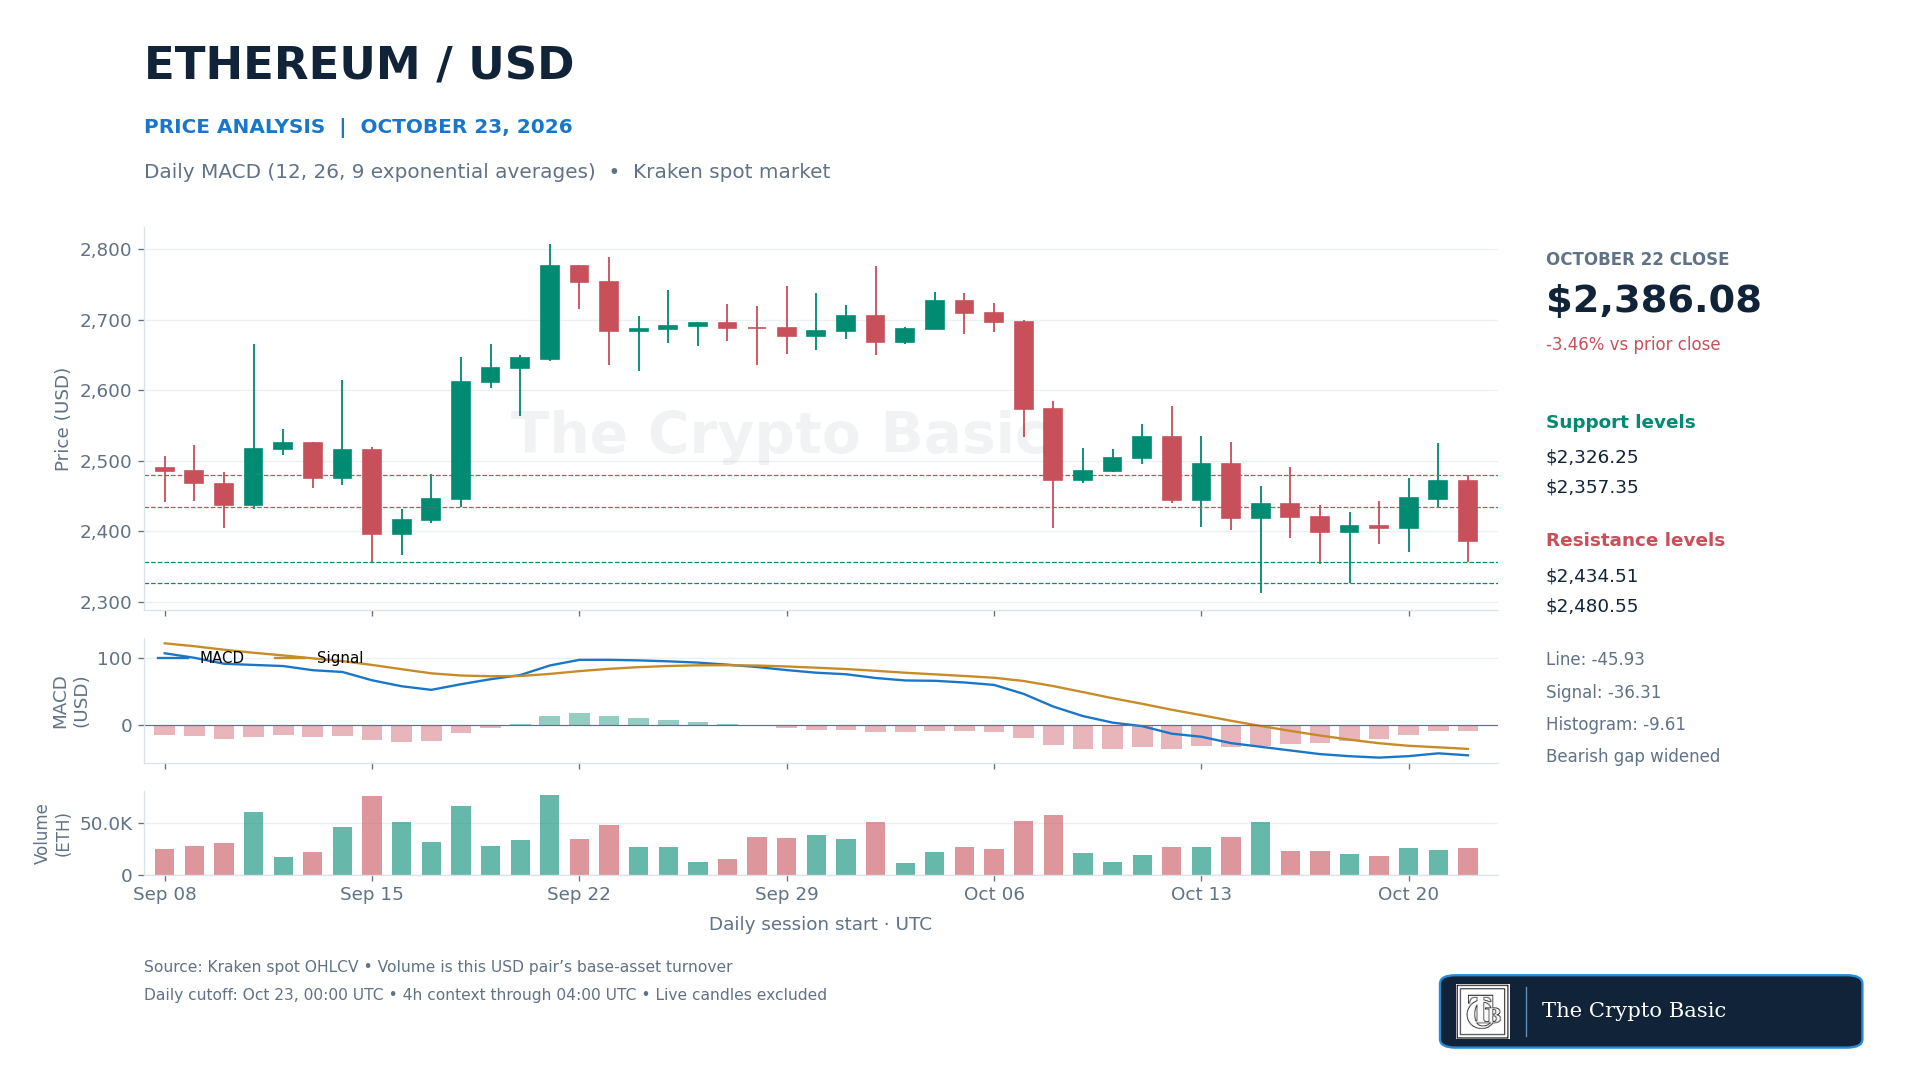
Daily MACD, using 12- and 26-period exponential averages with a nine-period signal EMA, remained bearish. The MACD line fell to -45.93 against a -36.31 signal line.
The histogram widened to -9.61 from -9.01, showing a larger bearish line-signal gap on the completed candle rather than improvement toward a crossover.
Four-hour MACD also remained bearish at the latest completed candle, with the line at -6.11, signal at 0.70 and histogram at -6.81. The short-term close recovered to $2,407.88, but momentum had not confirmed a reversal.
A daily close above $2,434.51 would begin repairing the breakdown, while clearing $2,480.55 would strengthen a move toward $2,524.58.
A close below $2,357.35 would expose $2,326.25 and the October 15 low at $2,313.42. Losing the latter would invalidate the developing base.
Ethereum traded 1.43% below the $2,443.19 price recorded in our October 21 report.
XRP’s ATR Rises as Price Loses Rebound Support
XRP closed Thursday at $1.30798, falling 4.13% after trading as low as $1.29391. The close broke below the $1.32990 support identified in Thursday’s report, reversing most of Wednesday’s recovery from the October 18 low.
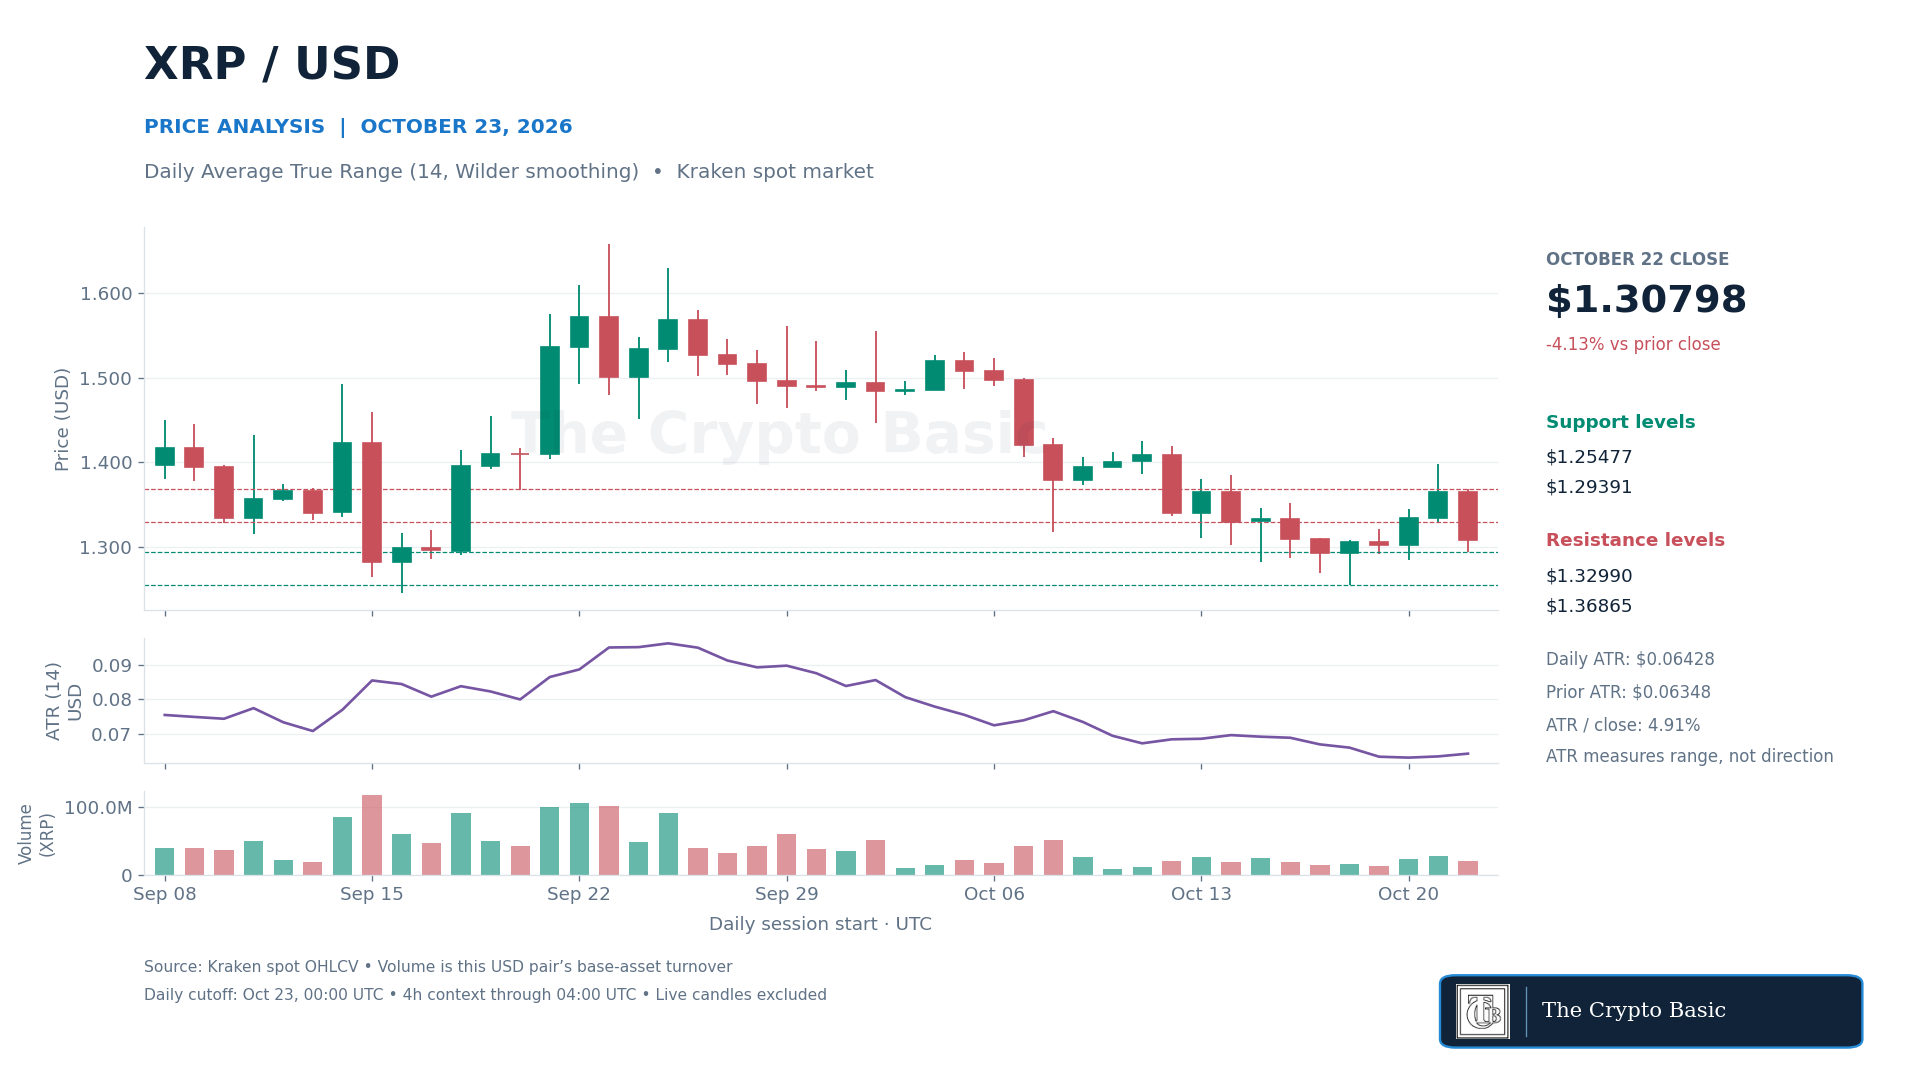
The 14-day Average True Range, calculated with Wilder smoothing, increased to $0.06428 from $0.06348.
That equals 4.91% of the latest close, indicating a modest expansion in the typical daily range. ATR measures volatility rather than direction, so the rise does not by itself predict another decline.
The latest completed four-hour candle recovered to $1.32033, while four-hour ATR stood at $0.02132. That bounce remained below the broken $1.32990 level and therefore did not restore daily support.
A daily close back above $1.32990 would improve the immediate structure, with $1.36865 and $1.39797 next.
Failure to hold $1.29391 would expose $1.25477. A close below the October 18 low would invalidate the rebound and bring the September 16 low at $1.24610 into focus.
The latest completed daily close is 4.13% below the $1.36437 close analyzed on Thursday.
Injective RSI Falls Toward Neutral Despite a Positive 24-Hour Quote
Injective closed at $7.897, down 8.19%, after reaching a low of $7.846. The decline followed Wednesday’s $8.601 close and left price near the $7.782–$7.846 support area formed by the latest two swing lows.
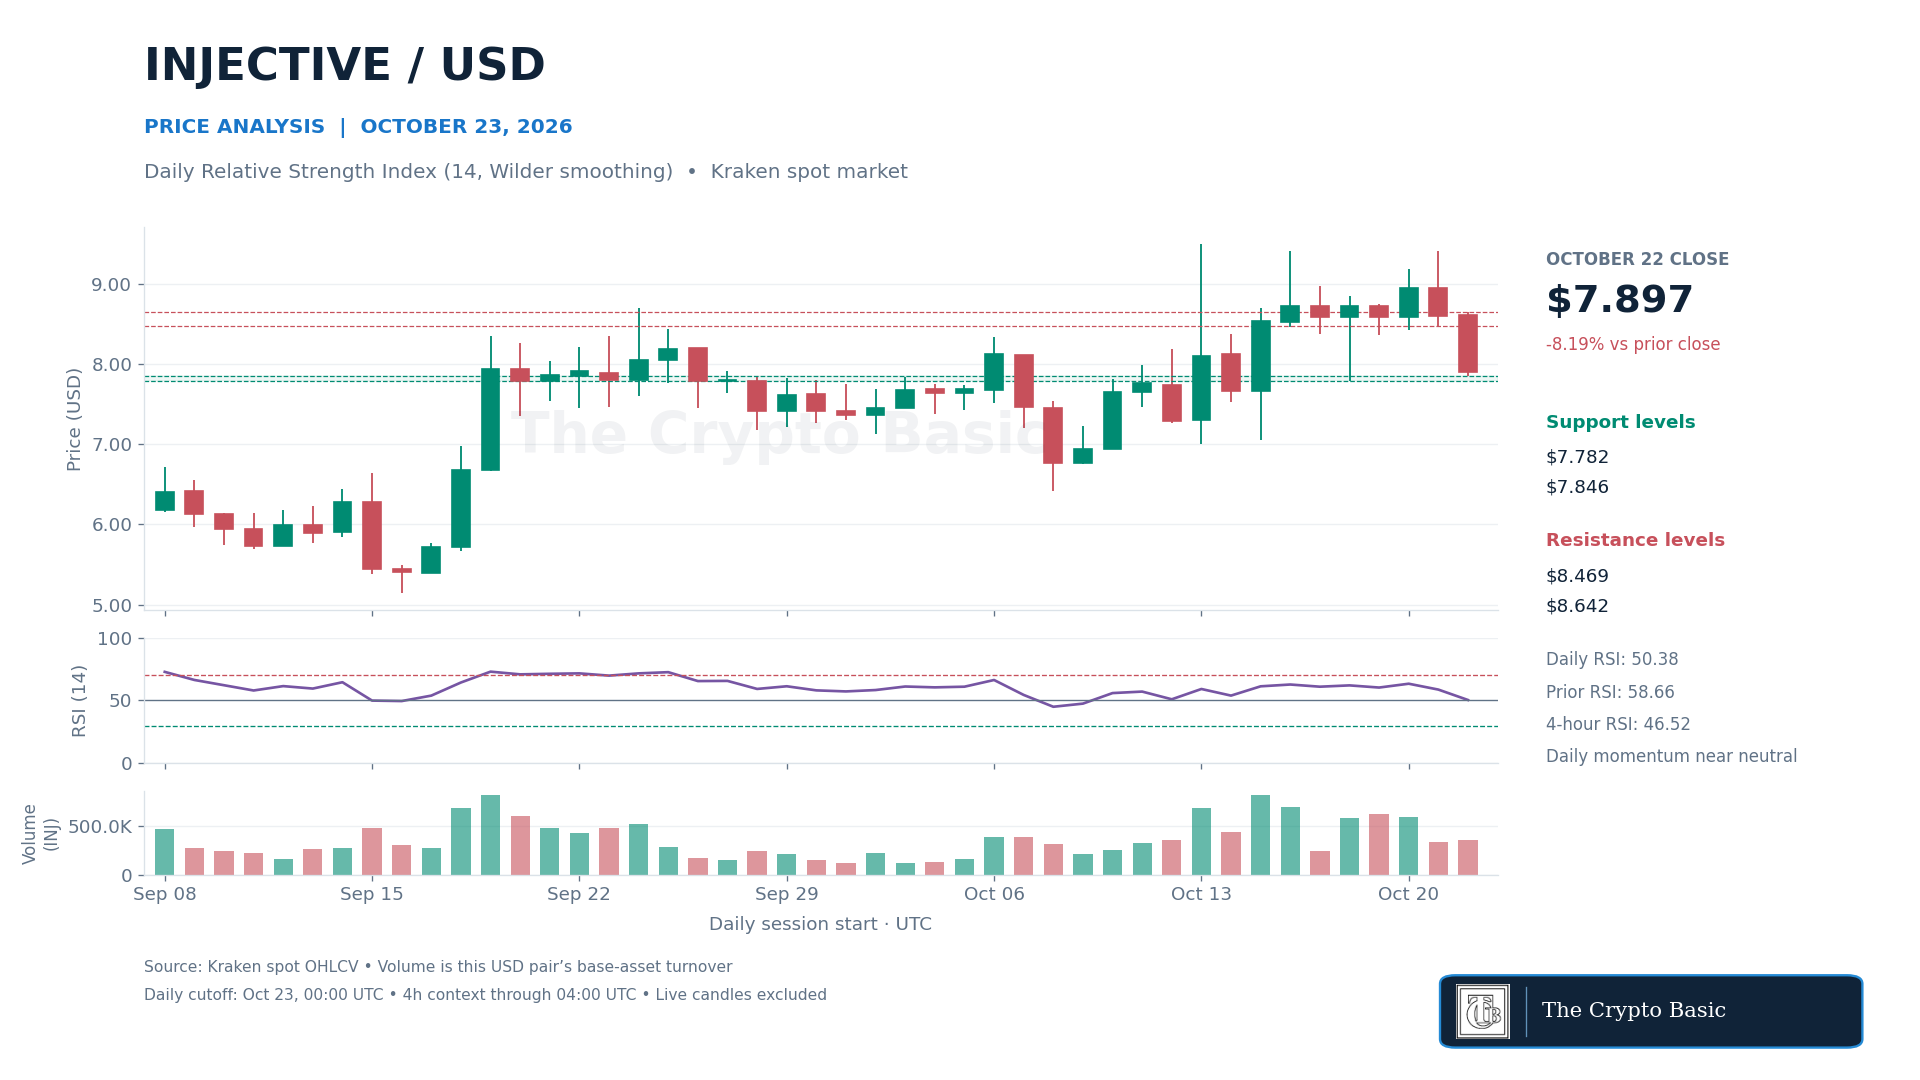
The daily RSI, calculated over 14 periods with Wilder smoothing, fell to 50.38 from 58.66.
Momentum remains fractionally above the neutral 50 threshold but is no longer consistent with Wednesday’s stronger reading.
Four-hour RSI was weaker at 46.52, showing that short-term momentum had already moved below neutral.
Injective gained 0.72% over the past 24 hours despite falling 8.19% during Thursday’s session. The figures cover different periods.
A daily close above $8.469–$8.642 would improve the rebound and bring $9.406–$9.490 back into focus.
A close below $7.782 would weaken the structure toward $7.28, followed by the October 8 low at $6.413. RSI falling decisively below 50 would support the bearish scenario but would not replace price confirmation.
Quant Falls Between Its 20-Day and 50-Day EMAs
Quant closed October 22 at $187.09, down 8.59%, after a $185.50–$208.78 session. The decline reversed Wednesday’s close above $200 and returned price toward the October 18 low at $181.15.
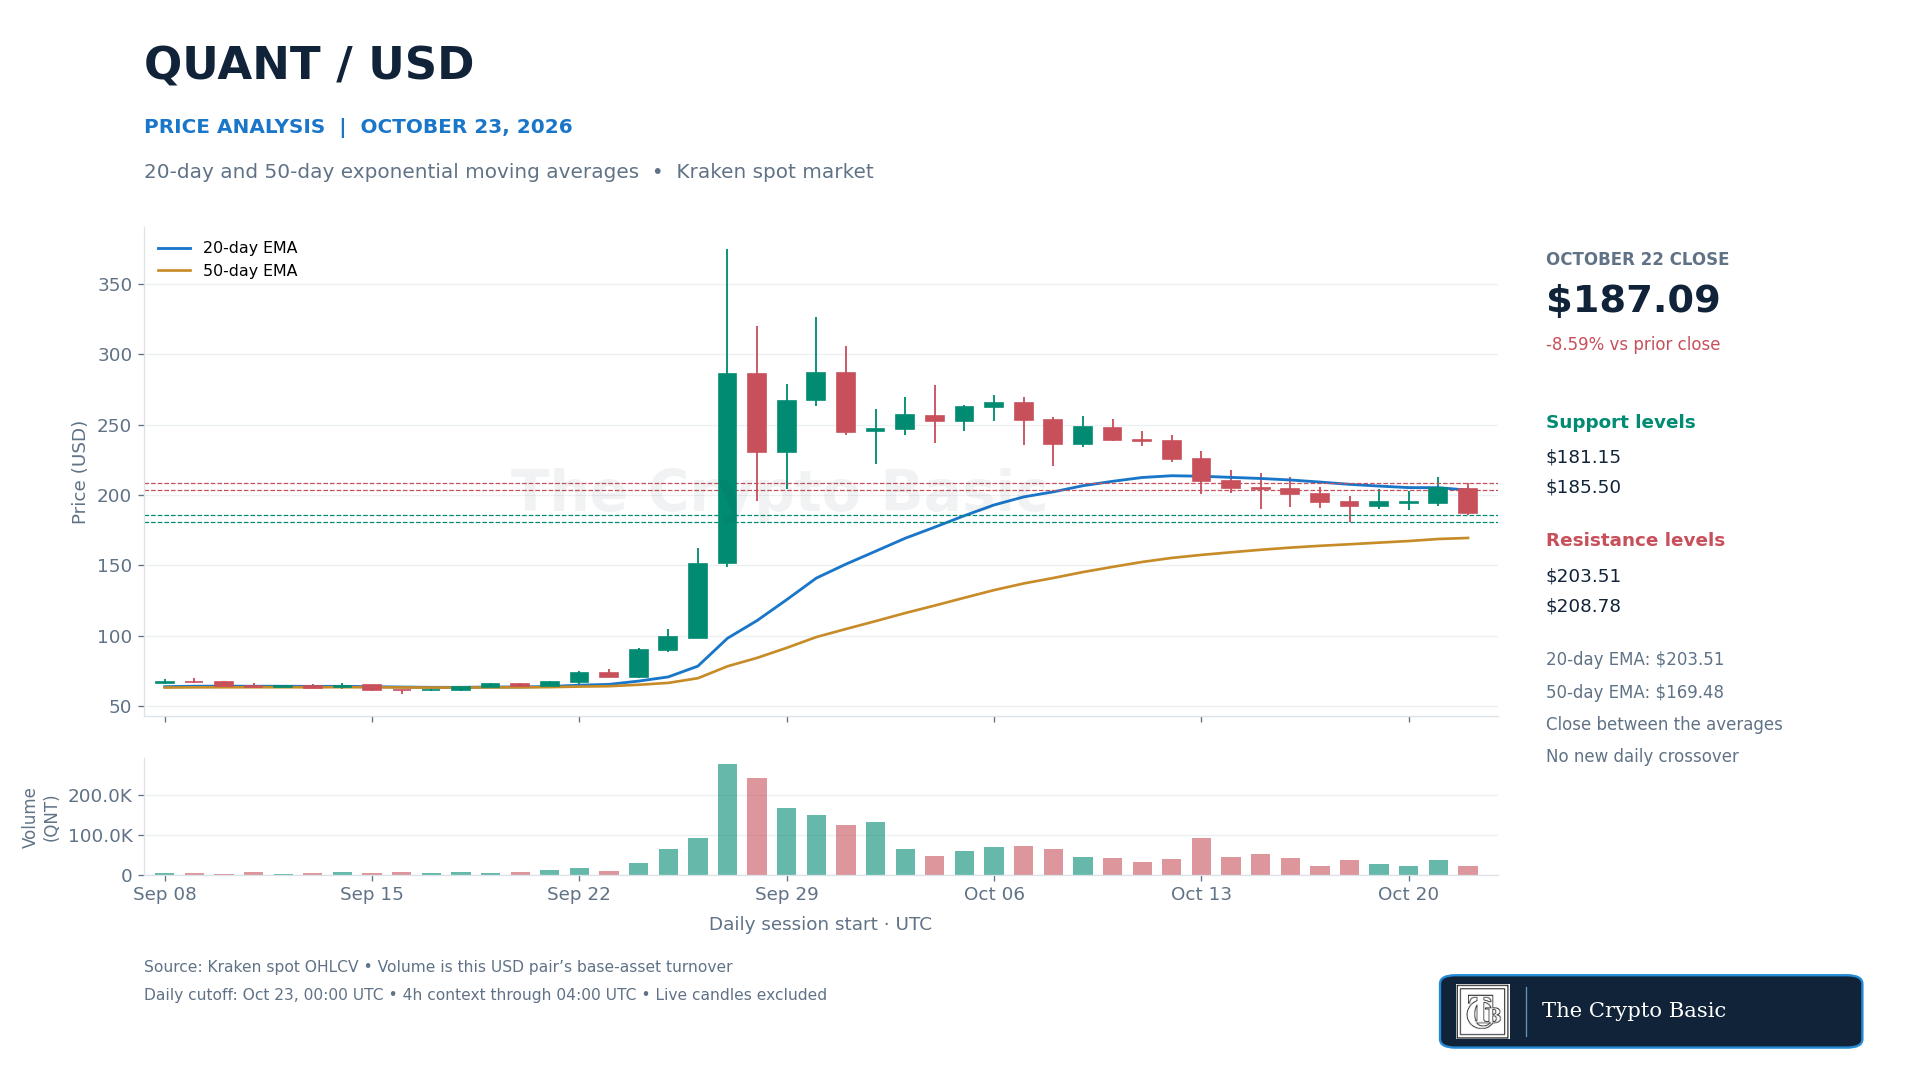
The 20-day exponential moving average declined to $203.51 from $205.24, while the 50-day EMA rose to $169.48 from $168.77. Price finished between the two averages.
The faster average remains above the slower one, so Thursday did not produce a new bearish crossover. The immediate signal is that price lost the shorter trend reference while retaining the longer one.
Four-hour conditions were weaker. The latest completed close at $189.32 remained below its 20-period EMA at $194.94 and 50-period EMA at $200.88.
A daily close above the 20-day EMA would improve the setup, with $208.78 and $213 next. A close below $185.50 would expose $181.15.
Losing that low would shift attention toward the rising 50-day EMA, although the dynamic average will change with each completed session.
Pump.fun Drops Back Into the Lower Half of Its Bollinger Bands
Pump.fun closed at $0.004546, down 11.19%, after failing to hold Wednesday’s advance. The candle traded as high as $0.005203 before falling to $0.004505, leaving resistance concentrated around $0.005119–$0.005218.
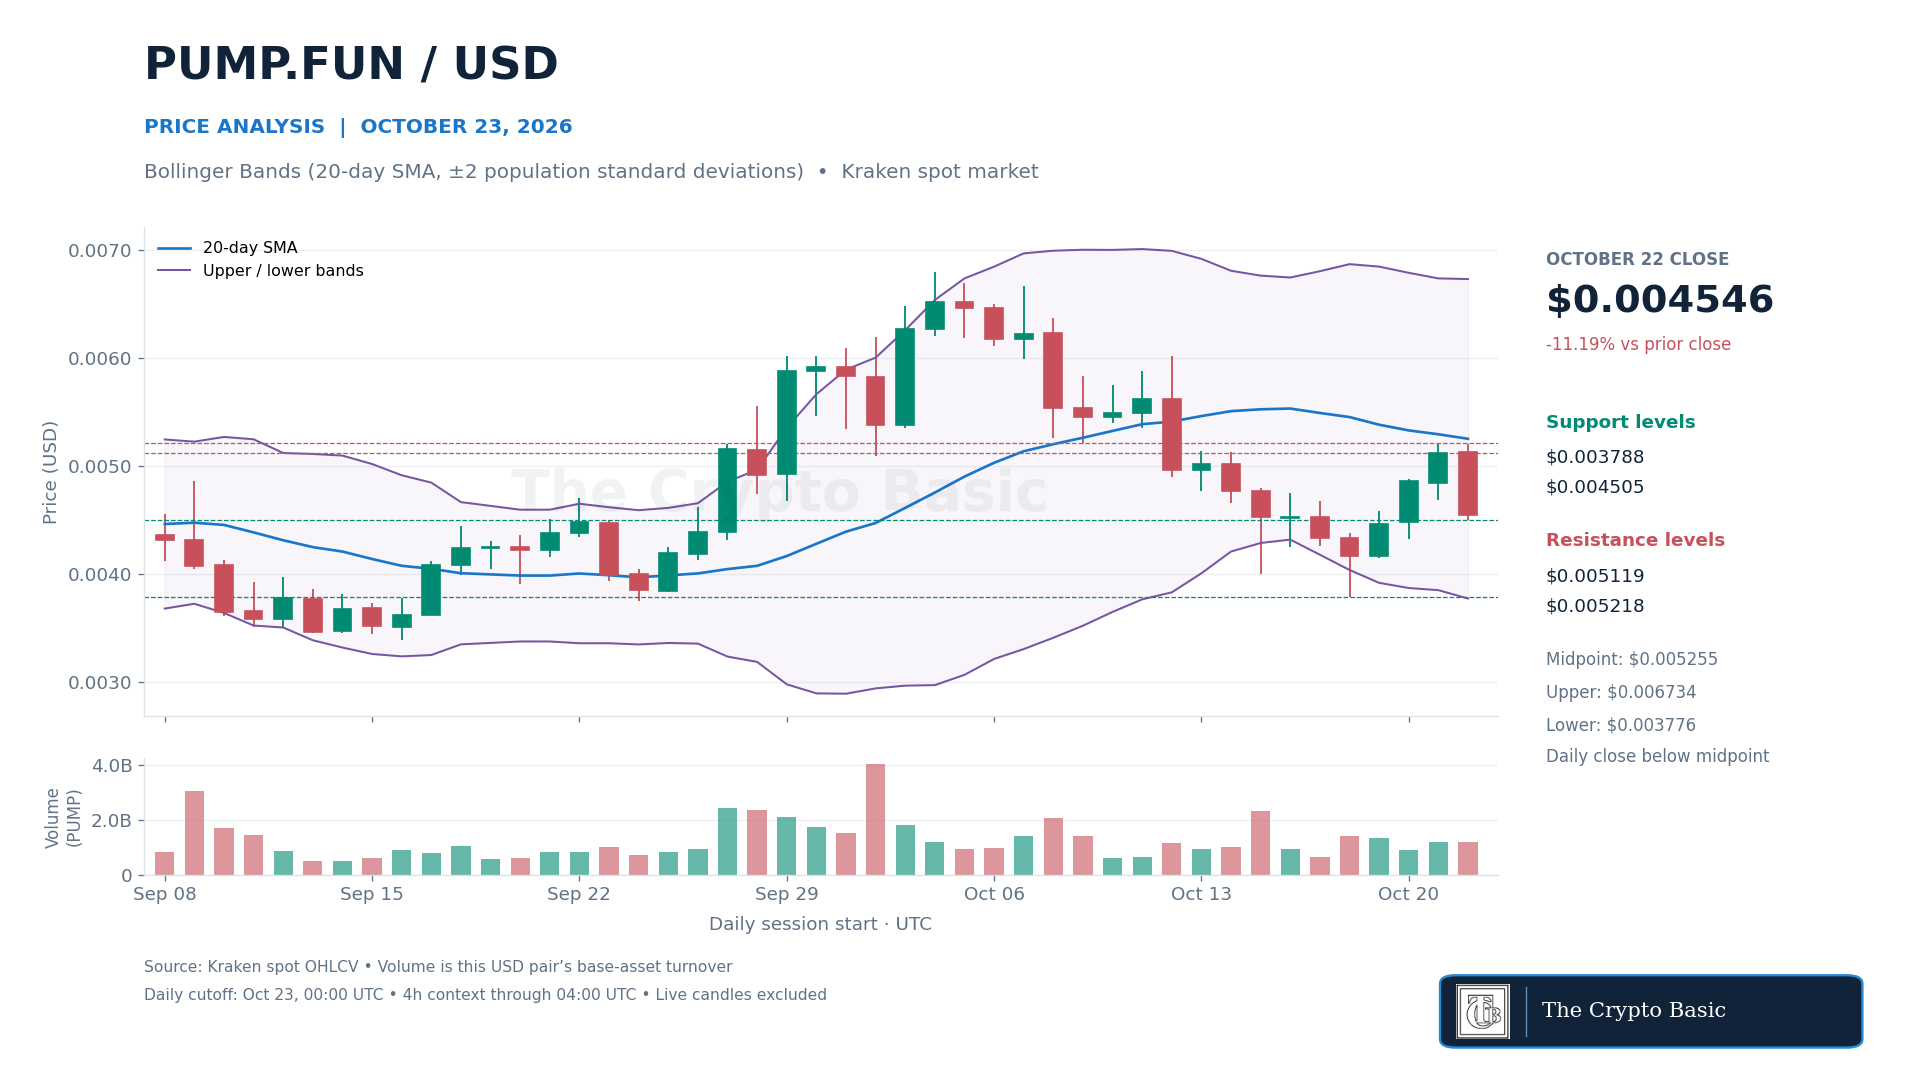
Daily Bollinger Bands, using a 20-day simple moving average and two population standard deviations, placed the midpoint at $0.005255.
The upper band stood at $0.006734 and the lower band at $0.003776. Price closed in the lower half of the envelope but remained above its lower boundary.
The latest completed four-hour candle recovered to $0.004646, still below its four-hour Bollinger midpoint at $0.004722. The rebound therefore did not confirm a return to the upper half of either timeframe’s envelope.
A daily close above $0.005119–$0.005218 would restore the latest rebound and bring the daily midpoint near $0.005255 into focus.
A close below $0.004505 would expose $0.004153 and $0.003788. Losing $0.003788 would invalidate the recovery from the October low and place price near the current lower band.
Pump.fun traded 1.98% below the $0.0047416 price recorded in Wednesday’s report.