




Quant rebounds as Bitcoin slips below $80,000. October 26 analysis tracks support, resistance, and daily signals for BTC, ETH, HYPE, QNT, and ICP prices.
| Asset | USD price | 24-hour change | Aggregate 24-hour volume | Market-cap rank |
|---|---|---|---|---|
| Bitcoin (BTC) | $79,540 | -1.50% | $17.12 billion | 1 |
| Ethereum (ETH) | $2,301.92 | -2.47% | $7.66 billion | 2 |
| Hyperliquid (HYPE) | $75.33 | -1.59% | $528.06 million | 11 |
| Quant (QNT) | $189.10 | +3.23% | $78.40 million | 38 |
| Internet Computer (ICP) | $2.59 | -2.04% | $37.60 million | 63 |
Bitcoin Tests the Lower Bollinger Band
Bitcoin closed Sunday at $80,048.50, down 0.90%, after trading between $79,750 and $80,919.20. Saturday had reached $79,120.80, below the $79,709 support discussed in the previous report, but neither weekend session closed beneath $79,709.
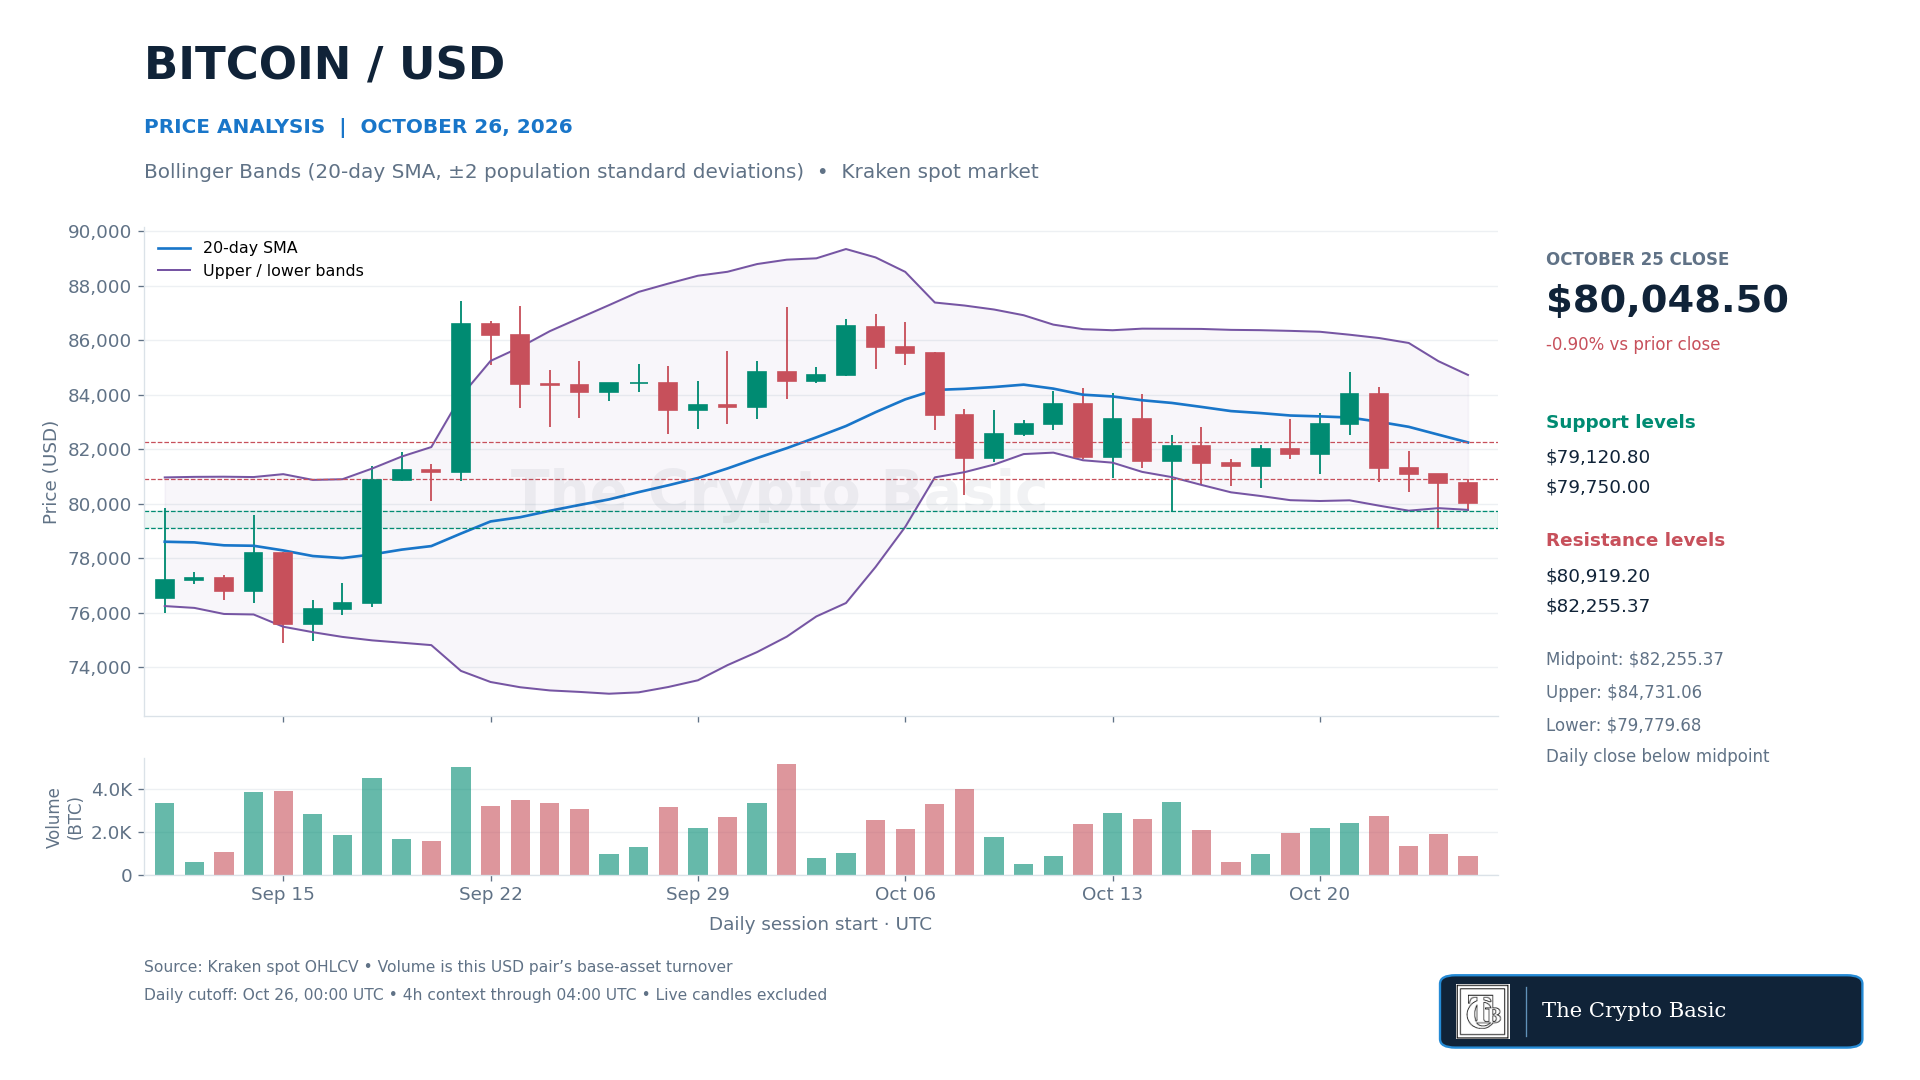
Daily Bollinger Bands, using a 20-day simple moving average and two population standard deviations, placed the midpoint at $82,255.37 and the lower band at $79,779.68. Sunday’s low briefly crossed the lower band before price closed back inside it.
The falling midpoint and price’s position near the bottom of the envelope show continued weakness rather than a confirmed reversal.
The latest completed four-hour candle closed at $79,489.60, below its own lower band at $79,552.30. That confirms short-term pressure, although Monday’s daily candle remains unfinished.
A daily close above $80,919.20–$81,101 would recover the weekend highs and improve the approach to $81,942.70 and the daily midpoint.
A close below $79,120.80 would confirm loss of the new weekend floor. The next older swing reference is the September 8 low at $77,609.40.
The latest price is 1.72% below the $80,928 recorded in Saturday’s report.
Ethereum RSI Falls Toward 30
Ethereum closed Sunday at $2,326.50, down 1.23%, after a $2,307.72–$2,368.33 session. Saturday’s low at $2,279.80 broke beneath the earlier $2,313.42 base intraday, but the weekend daily closes remained above that older level.
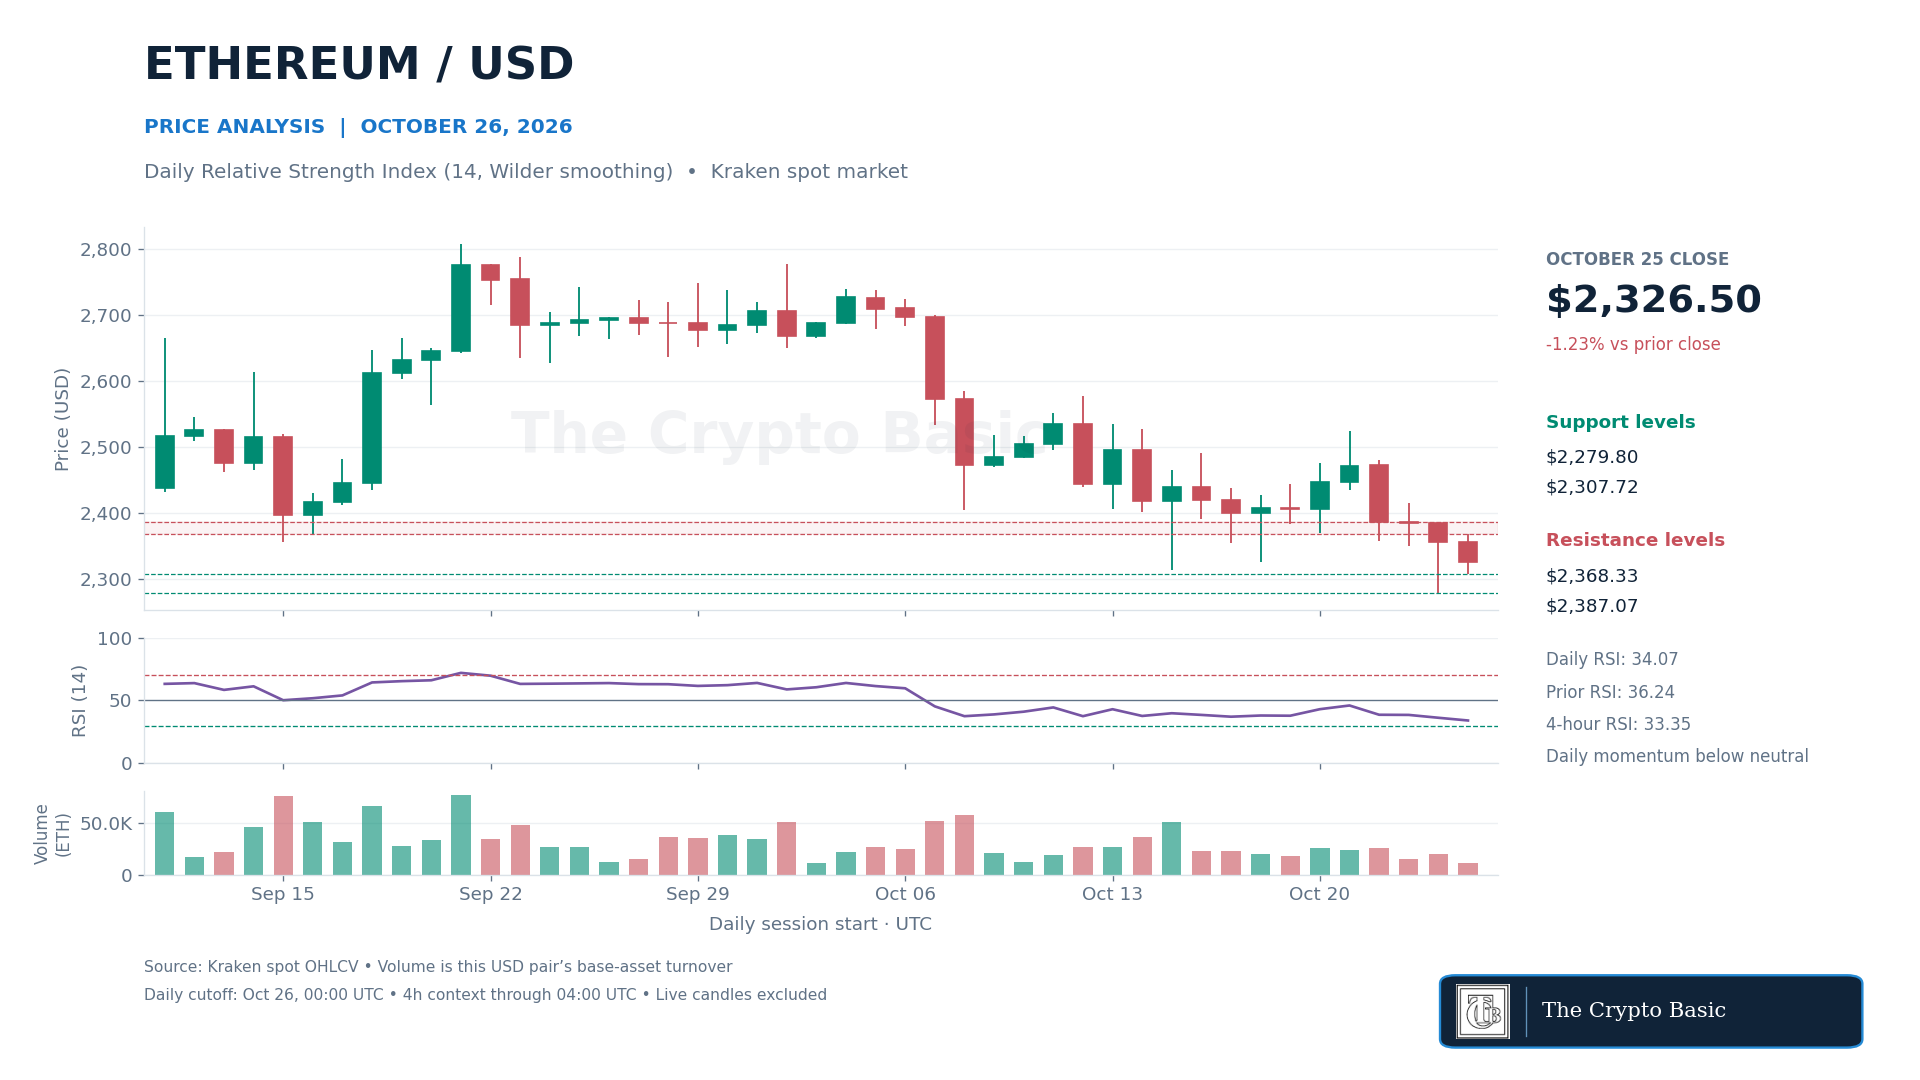
The 14-day RSI, calculated with Wilder smoothing, fell to 34.07 from 36.24. It remains below neutral and above the conventional oversold threshold of 30. The decline indicates weaker momentum; proximity to 30 alone does not establish a rebound.
The latest four-hour close at $2,299.93 was below both Sunday’s low and $2,313.42, with four-hour RSI at 33.35. A daily close is still needed to confirm whether that loss of support persists beyond the short-term chart.
Reclaiming $2,326.50 would be an initial improvement. A daily close above $2,368.33–$2,387.07 would provide stronger recovery confirmation toward $2,414.63. Conversely, a daily close below $2,279.80 would invalidate the weekend support hold and establish a fresh low in the latest 60-day range.
Ethereum’s latest price is 4.41% below the $2,408.16 recorded in Friday’s report.
Hyperliquid Trades Below Two Falling Averages
Hyperliquid closed Sunday at $76.27, down 0.43%, after touching $75.15. Price remained above Saturday’s $74.33 low, but the daily chart still shows a retreat from the October 21 high at $82.45.
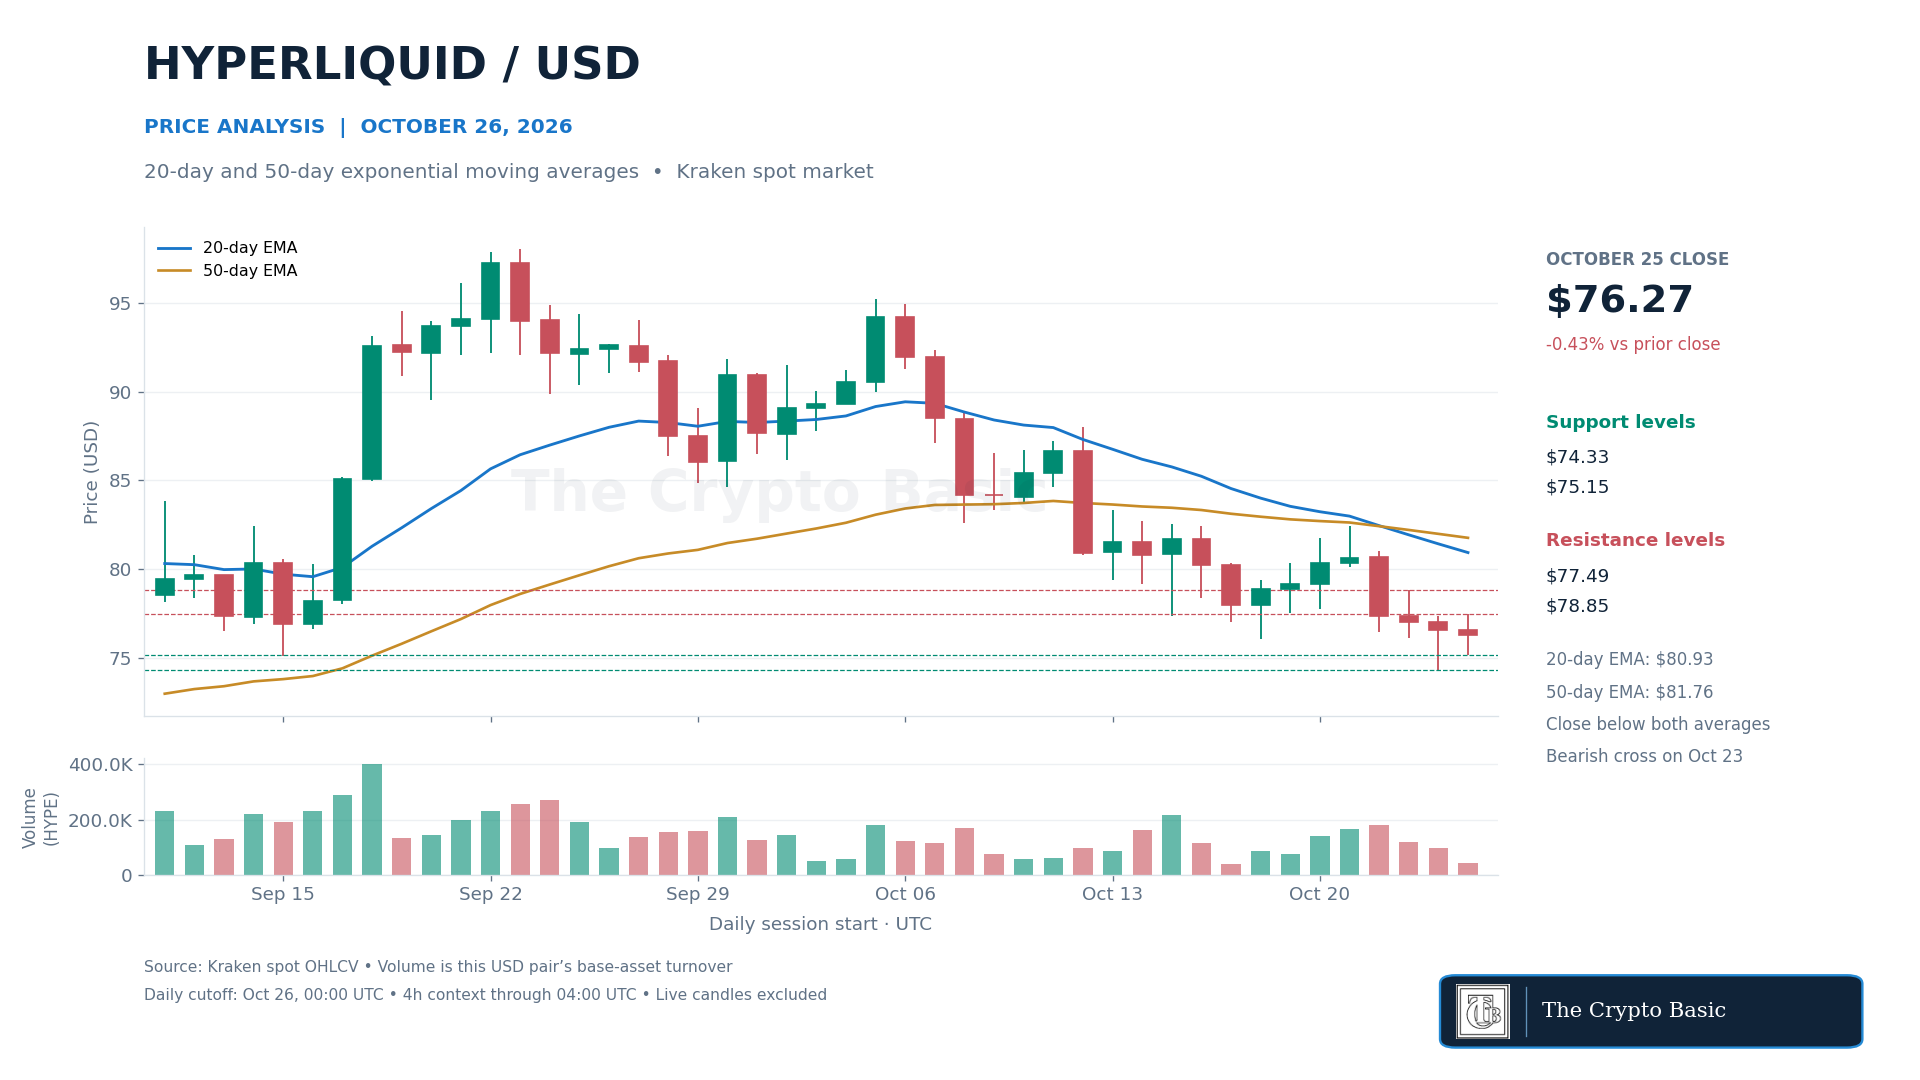
The 20-day exponential moving average stood at $80.93, below the 50-day EMA at $81.76. Both declined from the previous session. The bearish crossover occurred on the completed October 23 candle and remained intact through Sunday; it was not a new signal on the latest candle.
The four-hour close at $75.24 also remained below its 20-period EMA at $76.88 and 50-period EMA at $78.26. Daily and short-term trend references therefore point in the same direction.
A daily close above $77.49 would recover Sunday’s high and improve the approach to $78.85. Reclaiming the $80.93–$81.76 moving-average zone would provide stronger evidence of recovery, with $82.45 next.
A daily close below $75.15 would expose $74.33. Losing $74.33 would invalidate the weekend base and extend the decline to a new low in the current 60-day range. The averages will change with subsequent closes.
Quant Rebounds Without a Daily MACD Crossover
Quant closed Sunday at $189.95, gaining 6.15% after reaching $200.03. The close recovered Saturday’s $184.46 high, although the upper wick shows that price failed to retain the full advance.
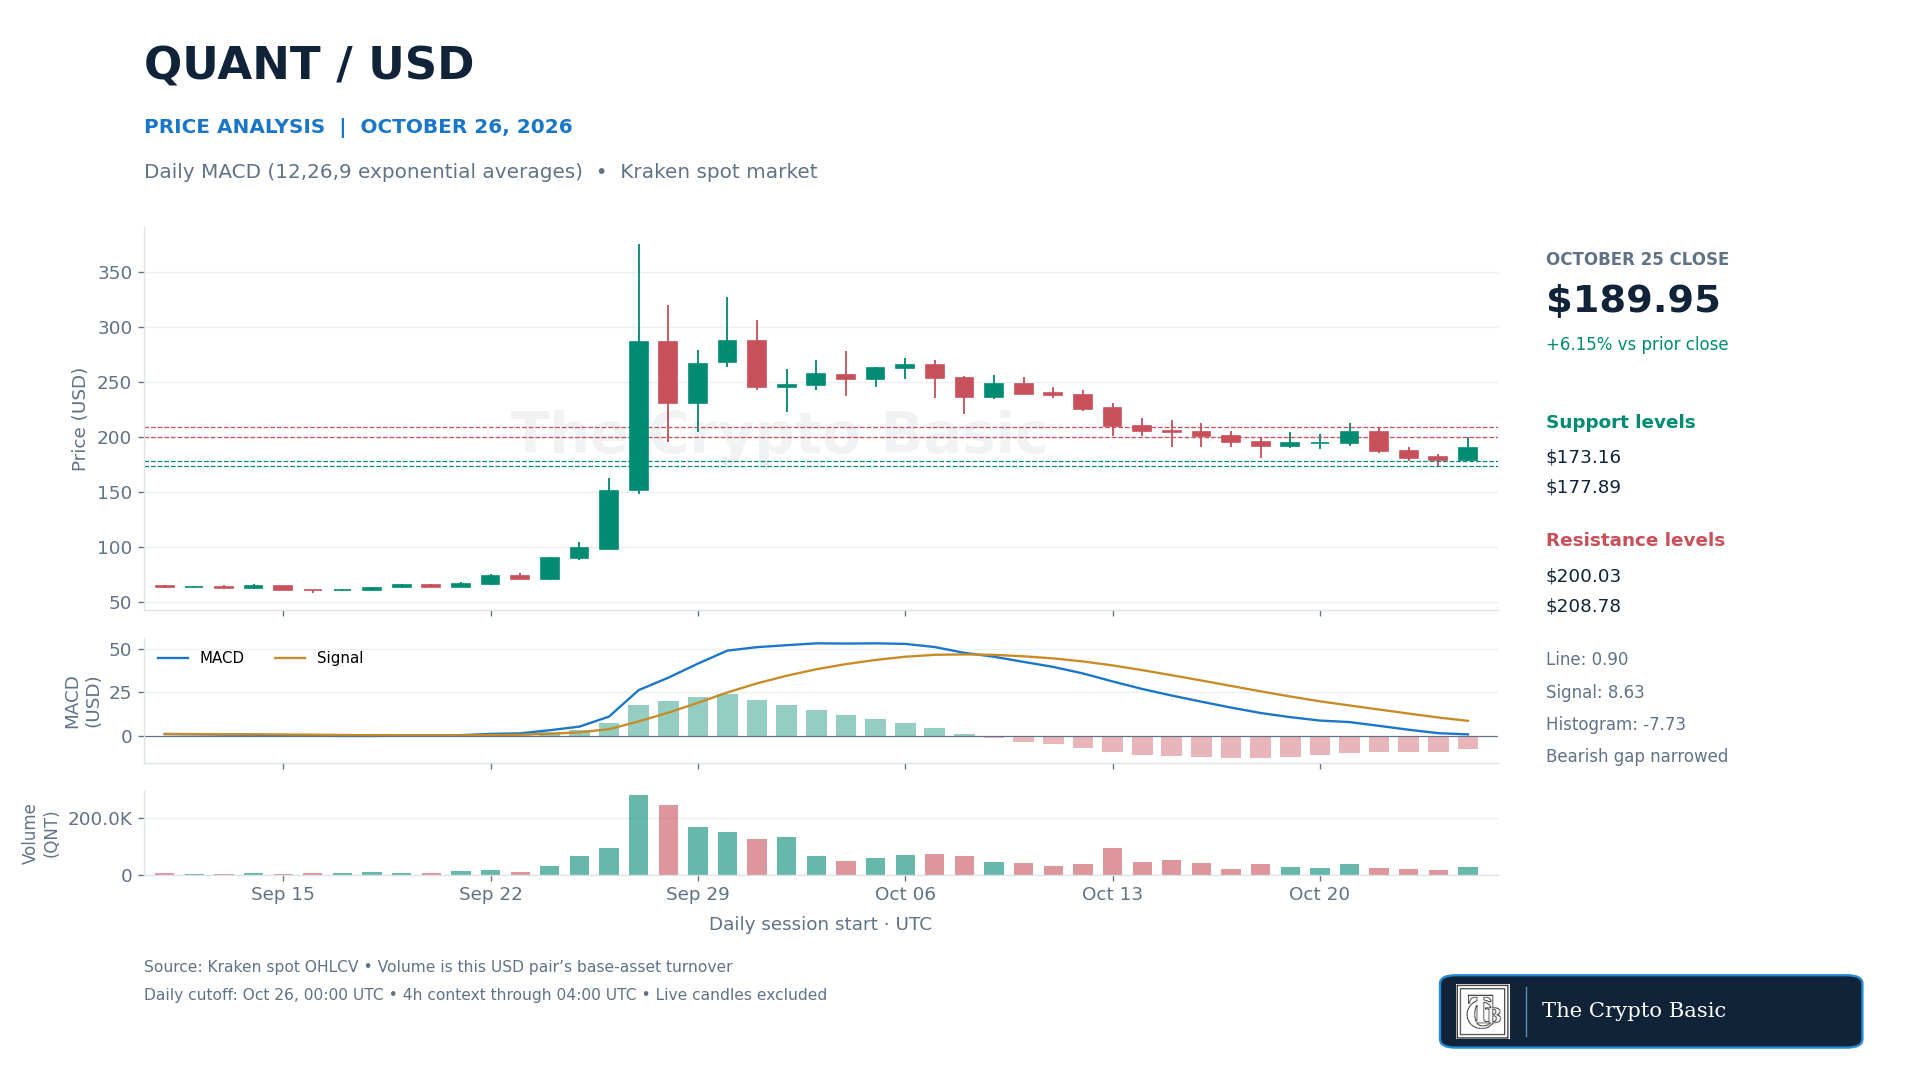
Daily MACD, using 12- and 26-period exponential averages with a nine-period signal EMA, remained bearish. The line stood at 0.90 against an 8.63 signal. The histogram narrowed to -7.73 from -8.98, showing a smaller bearish gap.
The MACD line itself still declined, so the improvement should not be described as a bullish line-signal crossover.
Four-hour momentum was stronger: its MACD line stood above the signal and the histogram was positive at 1.74. The latest four-hour close was $188.74, below Sunday’s close but above the recovered $184.46 level.
A daily close above $200.03 would confirm a break of Sunday’s high and improve the path toward $208.78–$213. A close below $184.46 would weaken the rebound, with $177.89 next. Losing Saturday’s $173.16 low would invalidate the recovery.
That low is below the $181.15 support tracked in Friday’s report, showing that the rebound followed a further deterioration in the earlier structure.
Internet Computer Sets a New October Low
Internet Computer closed Sunday at $2.625, down 1.50%, after falling to $2.572. That was the lowest price in the latest 30 completed daily sessions. The session high at $2.667 was also below Saturday’s $2.744 high, extending the sequence of weaker weekend candles.
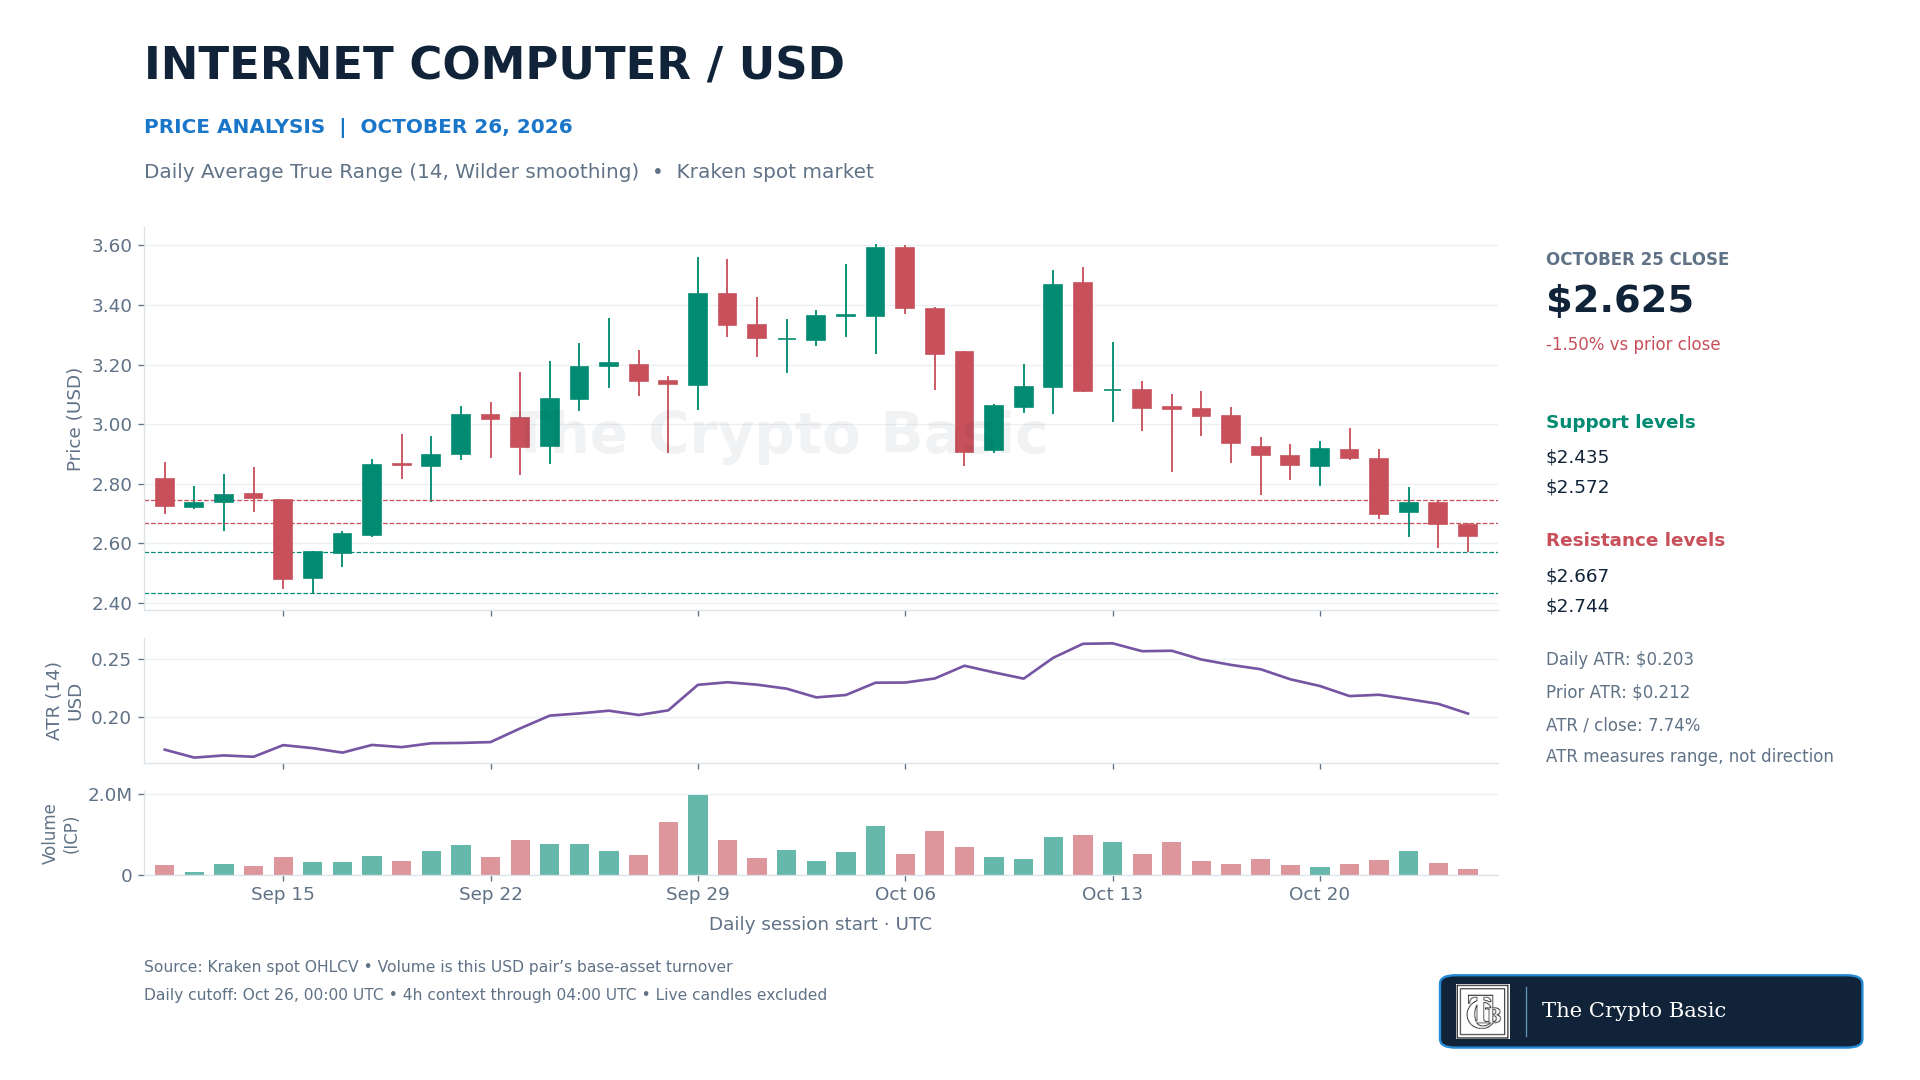
The 14-day Average True Range, using Wilder smoothing, eased to $0.2033 from $0.2116. It represents approximately 7.74% of Sunday’s closing price. Recent ranges have moderated, but falling ATR measures lower volatility rather than evidence that the decline has ended.
The latest four-hour candle closed at $2.587 after reaching $2.575, just above Sunday’s low. Four-hour ATR stood at $0.0549, keeping the immediate focus on whether that nearby support survives.
A daily close above $2.667 would recover Sunday’s high and put $2.744–$2.790 back into view. Clearing that zone would strengthen a recovery toward $2.917.
A close below $2.572 would invalidate the immediate support hold and expose the September 16 swing low at $2.435, followed by $2.422. Those are historical price references, not projections derived from ATR.