




XRP has entered November after closing October with a 16% loss, marking its fourth-worst October since monthly records in the dataset began in 2013.
Only three Octobers were weaker: 2013 at -44.8%, 2018 at -22.9%, and 2024 at -16.6%. The latest decline also leaves XRP trading around $1.25 at the start of November.
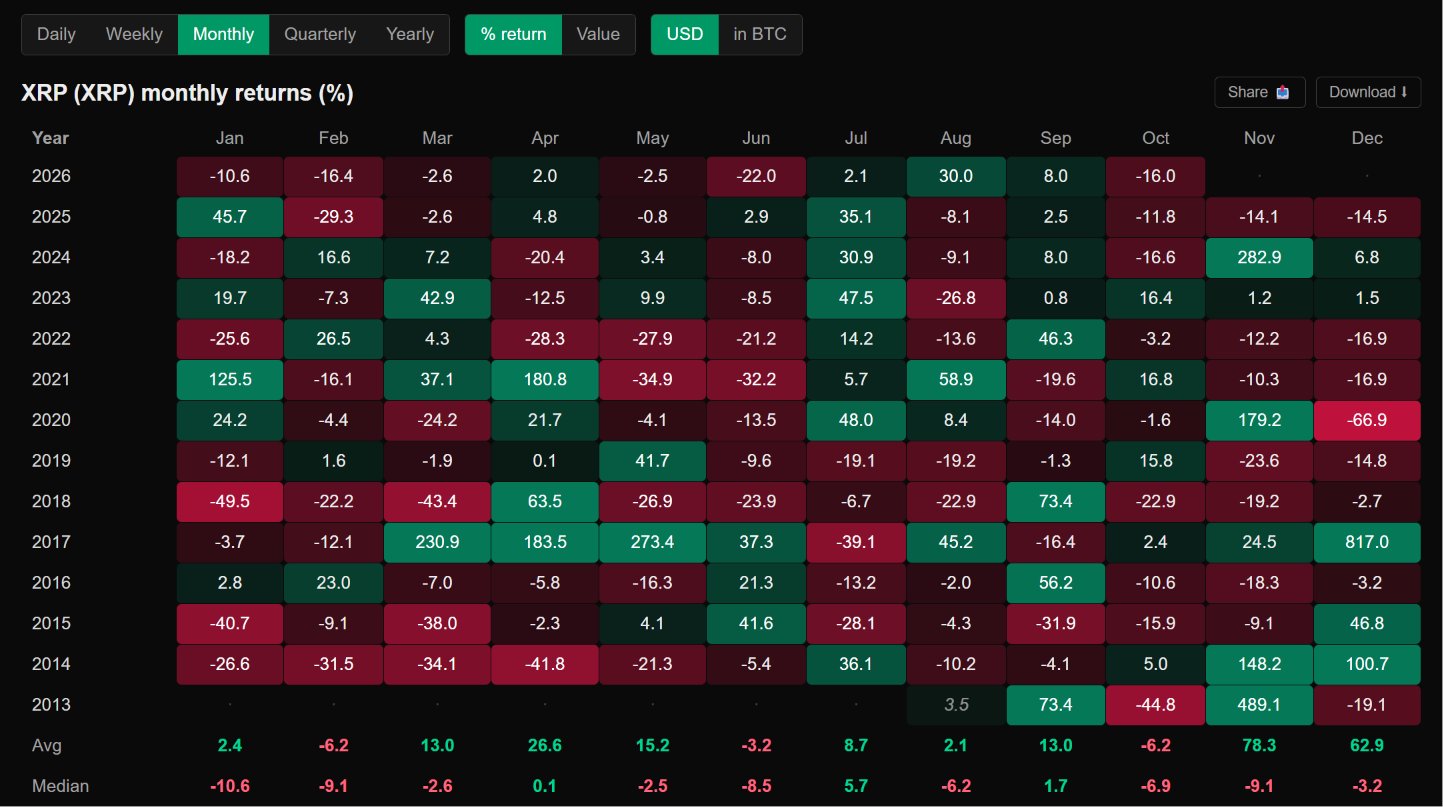
However, XRP’s November history presents an unusual picture. Most Novembers have actually finished lower, yet a handful of extraordinary rallies have pushed the month’s average return deeply into positive territory.
XRP Has Closed November Lower More Often Than Higher
Across the 13 completed Novembers between 2013 and 2025, XRP finished in the red seven times, compared with six positive closes.
That translates to:
- 53.8% red Novembers
- 46.2% green Novembers
The median November return is -9.1%, meaning the middle result across the historical sample is negative.
Yet the average tells a dramatically different story.
XRP’s average November return stands at +78.3%. At first glance, that would make November appear exceptionally bullish, but the underlying data shows why the figure requires context.
Four Explosive Novembers Distort the Average
Four months account for most of the unusually high average:
November 2013: +489.1%
November 2014: +148.2%
November 2020: +179.2%
November 2024: +282.9%
Removing those four triple-digit rallies leaves the other nine completed Novembers with an average return of approximately -9.0%, based on our calculation from the historical table.
That almost perfectly matches the full-period median of -9.1%.
The distinction is important. XRP’s November history has not typically produced gains anywhere close to 78%. Instead, the average is heavily influenced by several exceptional periods of rapid price expansion.
What Happened After Previous Red Octobers?
XRP’s latest setup becomes more interesting when the sample is narrowed specifically to years in which October also finished lower.
Between 2013 and 2025, XRP recorded eight red Octobers.
Five of those were followed by another red November, while only three produced a positive November. That means a red October was followed by another monthly decline 62.5% of the time in this small historical sample.
But the three exceptions were striking.
After October fell 44.8% in 2013, XRP gained 489.1% in November. A red October in 2020 preceded a 179.2% November rally, while the 16.6% October decline in 2024 was followed by a 282.9% gain.
This creates a highly uneven historical distribution: red October has more often been followed by further weakness, but every positive November following a red October in this dataset produced a triple-digit return.
That pattern should not be treated as a forecast for November 2026. Thirteen completed November observations—and only eight red-October cases—are too small a sample to establish a dependable seasonal outcome.
The monthly table also provides no evidence for whether weakness would occur in the first half of November and strength in the second half; it only records the final return for each complete month.
For November 2026, the key takeaway is therefore less about the +78.3% historical average and more about the distribution underneath it: XRP has usually struggled in November, but its rare positive outliers have historically been exceptionally large.