




Bitcoin stabilizes above $73,000 as Ethereum stays below its lower band, VVV and ASTER rebound, and ONDO remains beneath falling averages in today’s analysis.
| Asset | Latest USD price | Past 24 hours | 24-hour market volume | Market-cap rank |
|---|---|---|---|---|
| Bitcoin (BTC) | $73,740 | +0.01% | $25.86 billion | 1 |
| Ethereum (ETH) | $2,053.46 | −0.43% | $9.26 billion | 2 |
| Venice Token (VVV) | $19.81 | +2.46% | $23.72 million | 73 |
| Ondo (ONDO) | $0.356653 | −3.73% | $92.94 million | 51 |
| Aster (ASTER) | $0.654562 | +2.00% | $71.23 million | 52 |
Bitcoin RSI rises but remains below neutral
Bitcoin gained 0.31% on Wednesday to close at $73,928.40. The session ranged from $73,113.60 to $74,754.10, holding above Tuesday’s $72,584.60 low but failing to recover Tuesday’s $75,323.50 high.
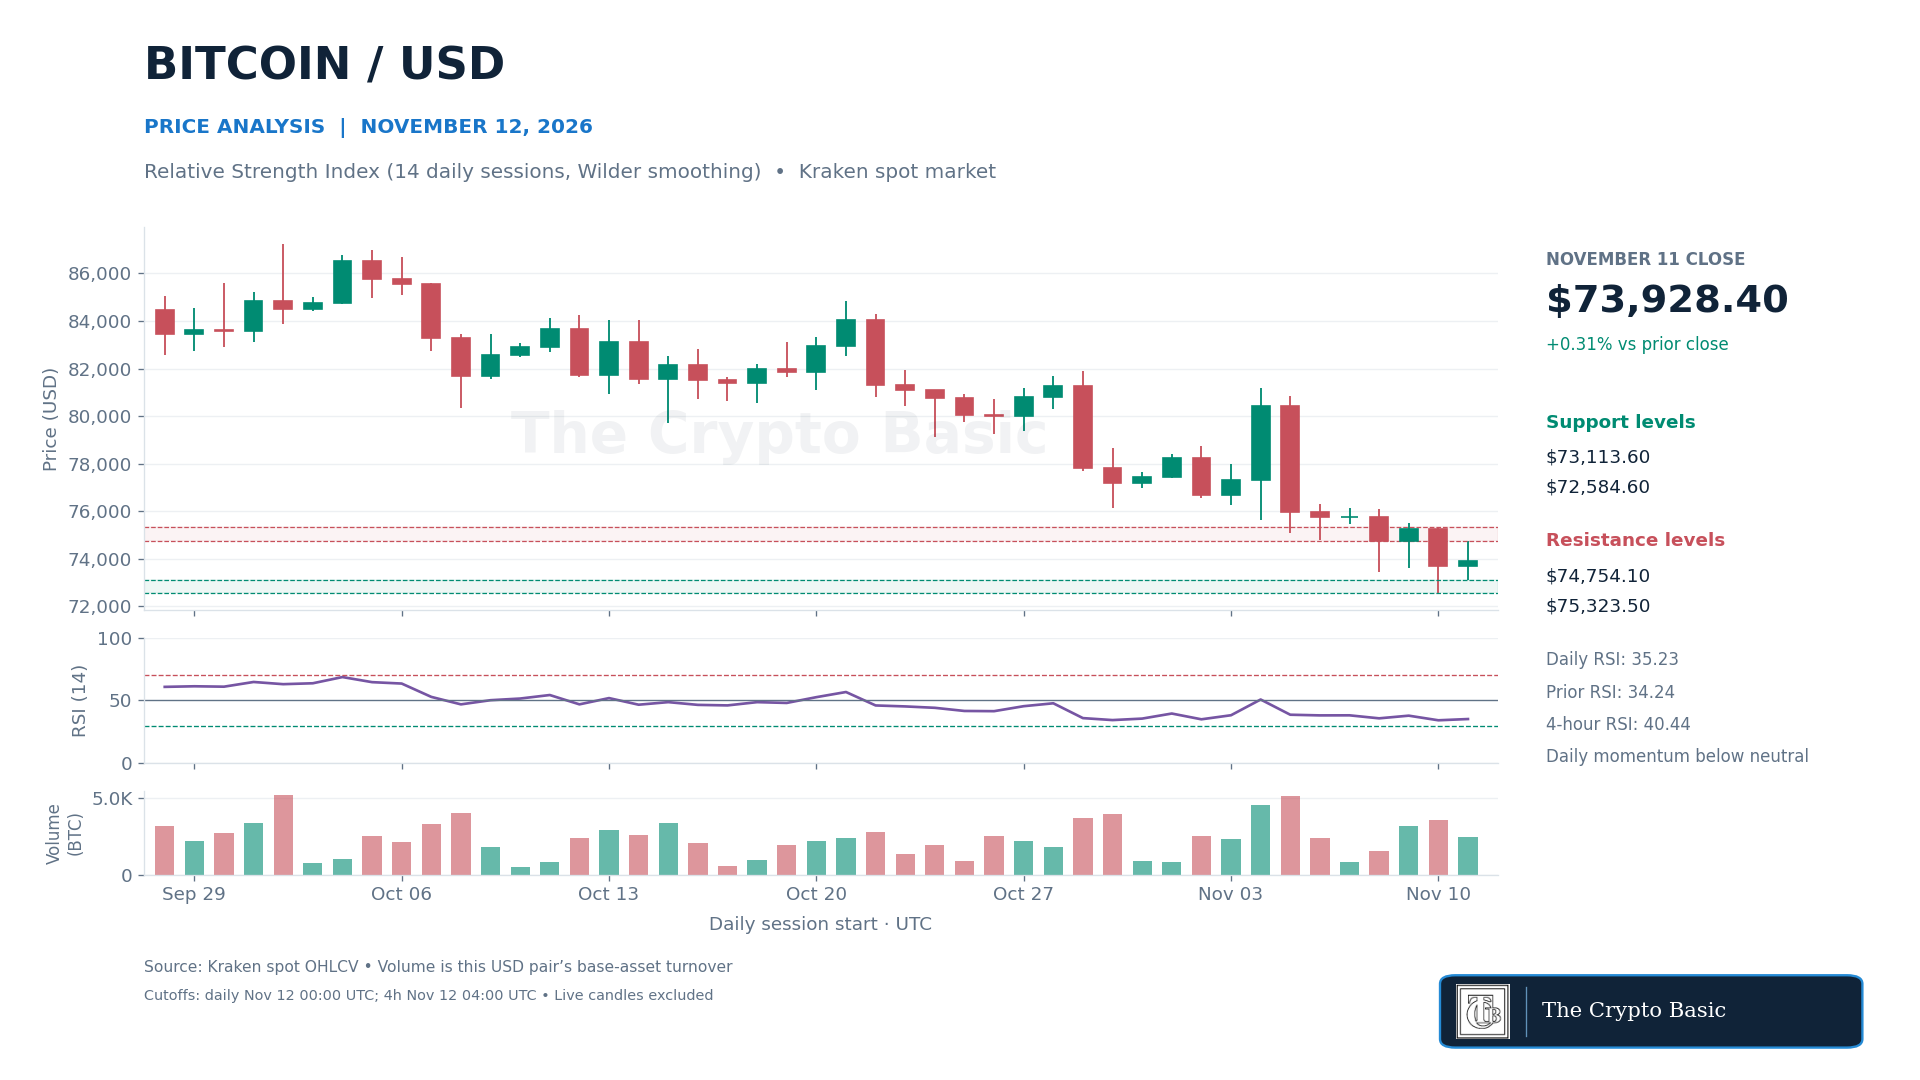
The latest $73,740 price was 1.01% below the $74,494 recorded in our November 10 Bitcoin analysis.
The 14-day Relative Strength Index, calculated with Wilder smoothing, rose to 35.23 from 34.24. Momentum improved slightly but remained below the neutral 50 line. The latest completed four-hour RSI was firmer at 40.44 as the candle closed at $73,707.40, still without a neutral or bullish momentum reading.
A daily close above $74,754.10 would clear Wednesday’s high, with $75,323.50 forming the next recovery test. Regaining the latter would invalidate the immediate lower-high setup. A close below $73,113.60 would weaken Wednesday’s stabilization, while a close beneath $72,584.60 would confirm another extension below the latest 60-session low.
Ethereum confirms another close outside its lower band
Ethereum closed Wednesday at $2,053.48, up 0.12%, after trading between $2,033.49 and $2,105.22. The small gain followed Tuesday’s 3.83% decline but did not recover the prior session’s $2,133.92 high.
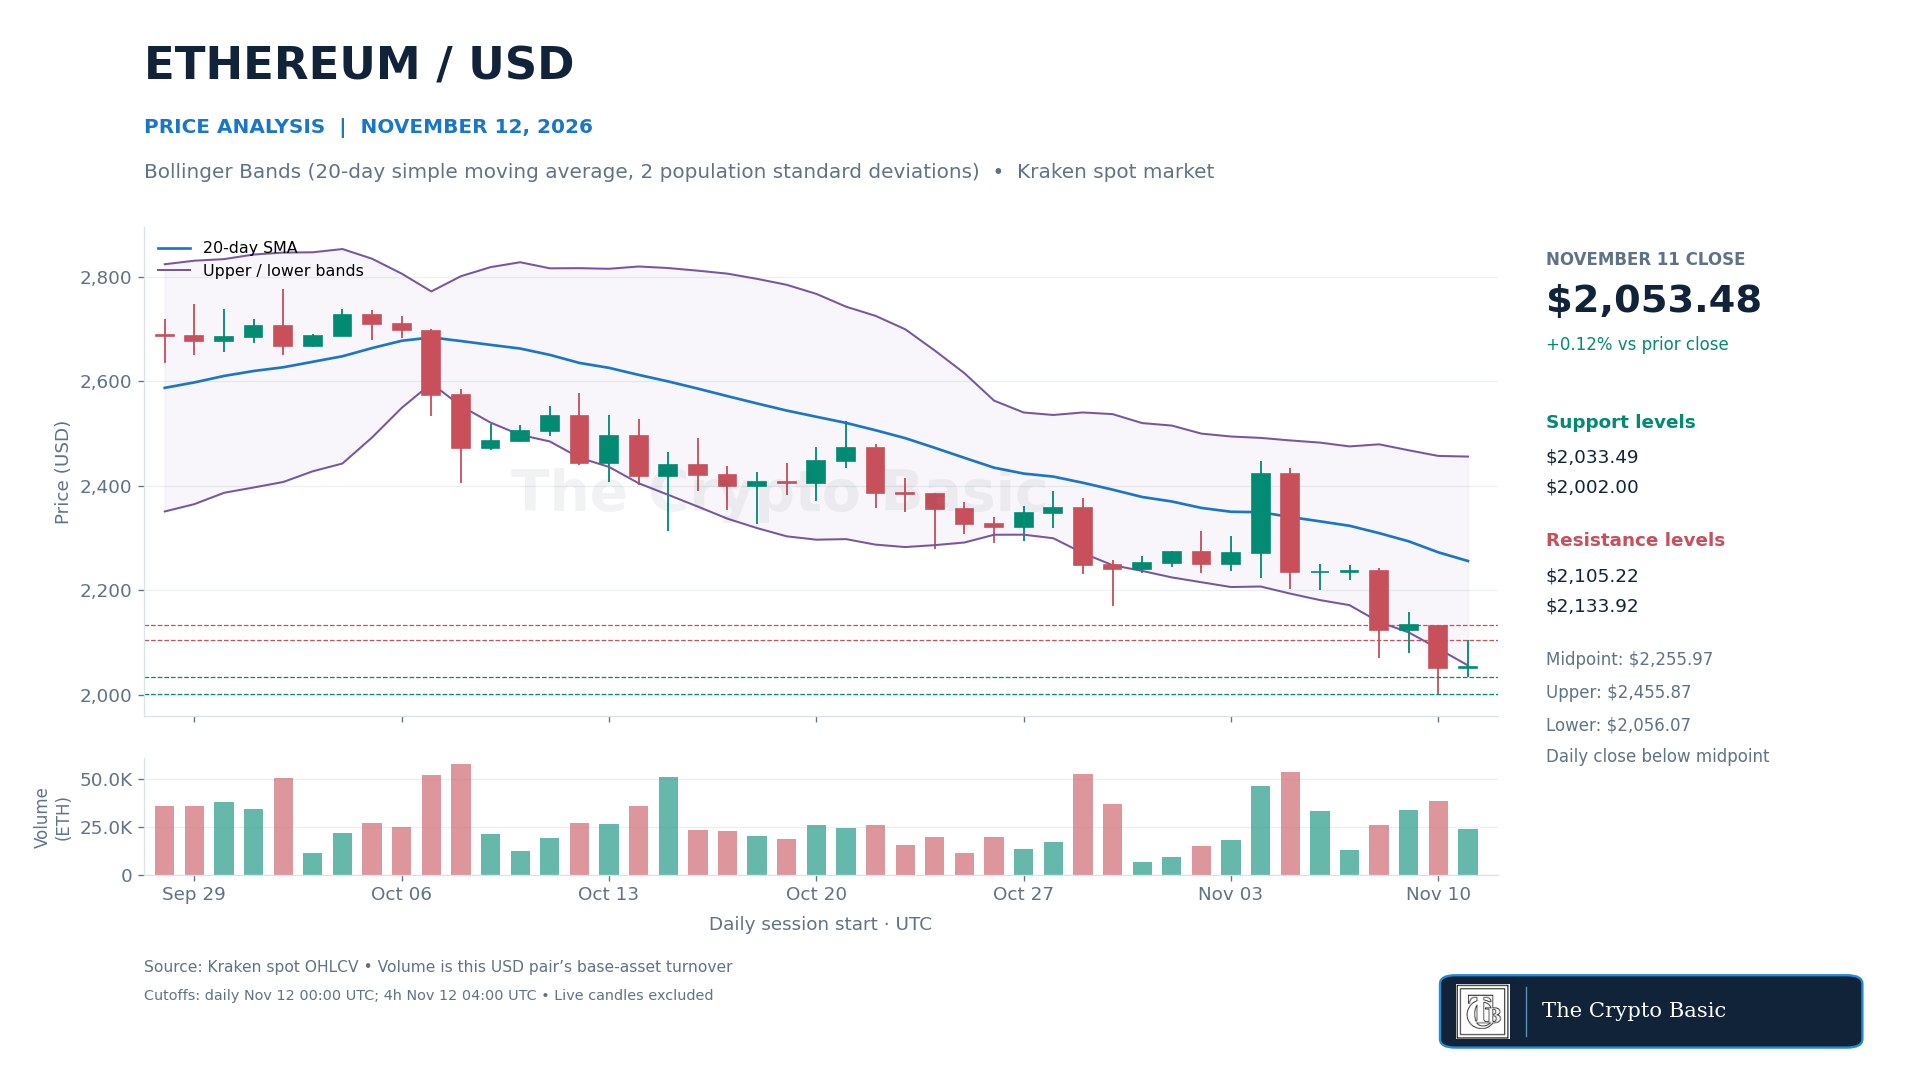
The latest $2,053.46 price was 0.38% below the price recorded in our November 11 Ethereum analysis.
Daily Bollinger Bands use a 20-day simple moving average with two population standard deviations. Wednesday’s midpoint fell to $2,255.97, while the lower band moved down to $2,056.07. The $2,053.48 close remained just beneath that boundary, confirming a second consecutive completed close outside the lower band. That condition shows persistent downside pressure but does not establish that price must continue lower.
The completed four-hour candle closed at $2,052.41, within its $2,015.84–$2,157.73 band envelope. A daily close above $2,105.22 would provide the first repair, with $2,133.92 the stronger confirmation level. A close below $2,033.49 would expose Tuesday’s $2,002 low. Losing $2,002 would invalidate the attempt to stabilize above the psychological $2,000 area.
Venice Token rebounds on lighter exchange volume
Venice Token rose 2.00% on Wednesday to close at $19.674, after recovering from an $18.73 low and reaching $20.771. The latest $19.81 price was 14.02% below the $23.04 recorded in our October 9 VVV analysis.
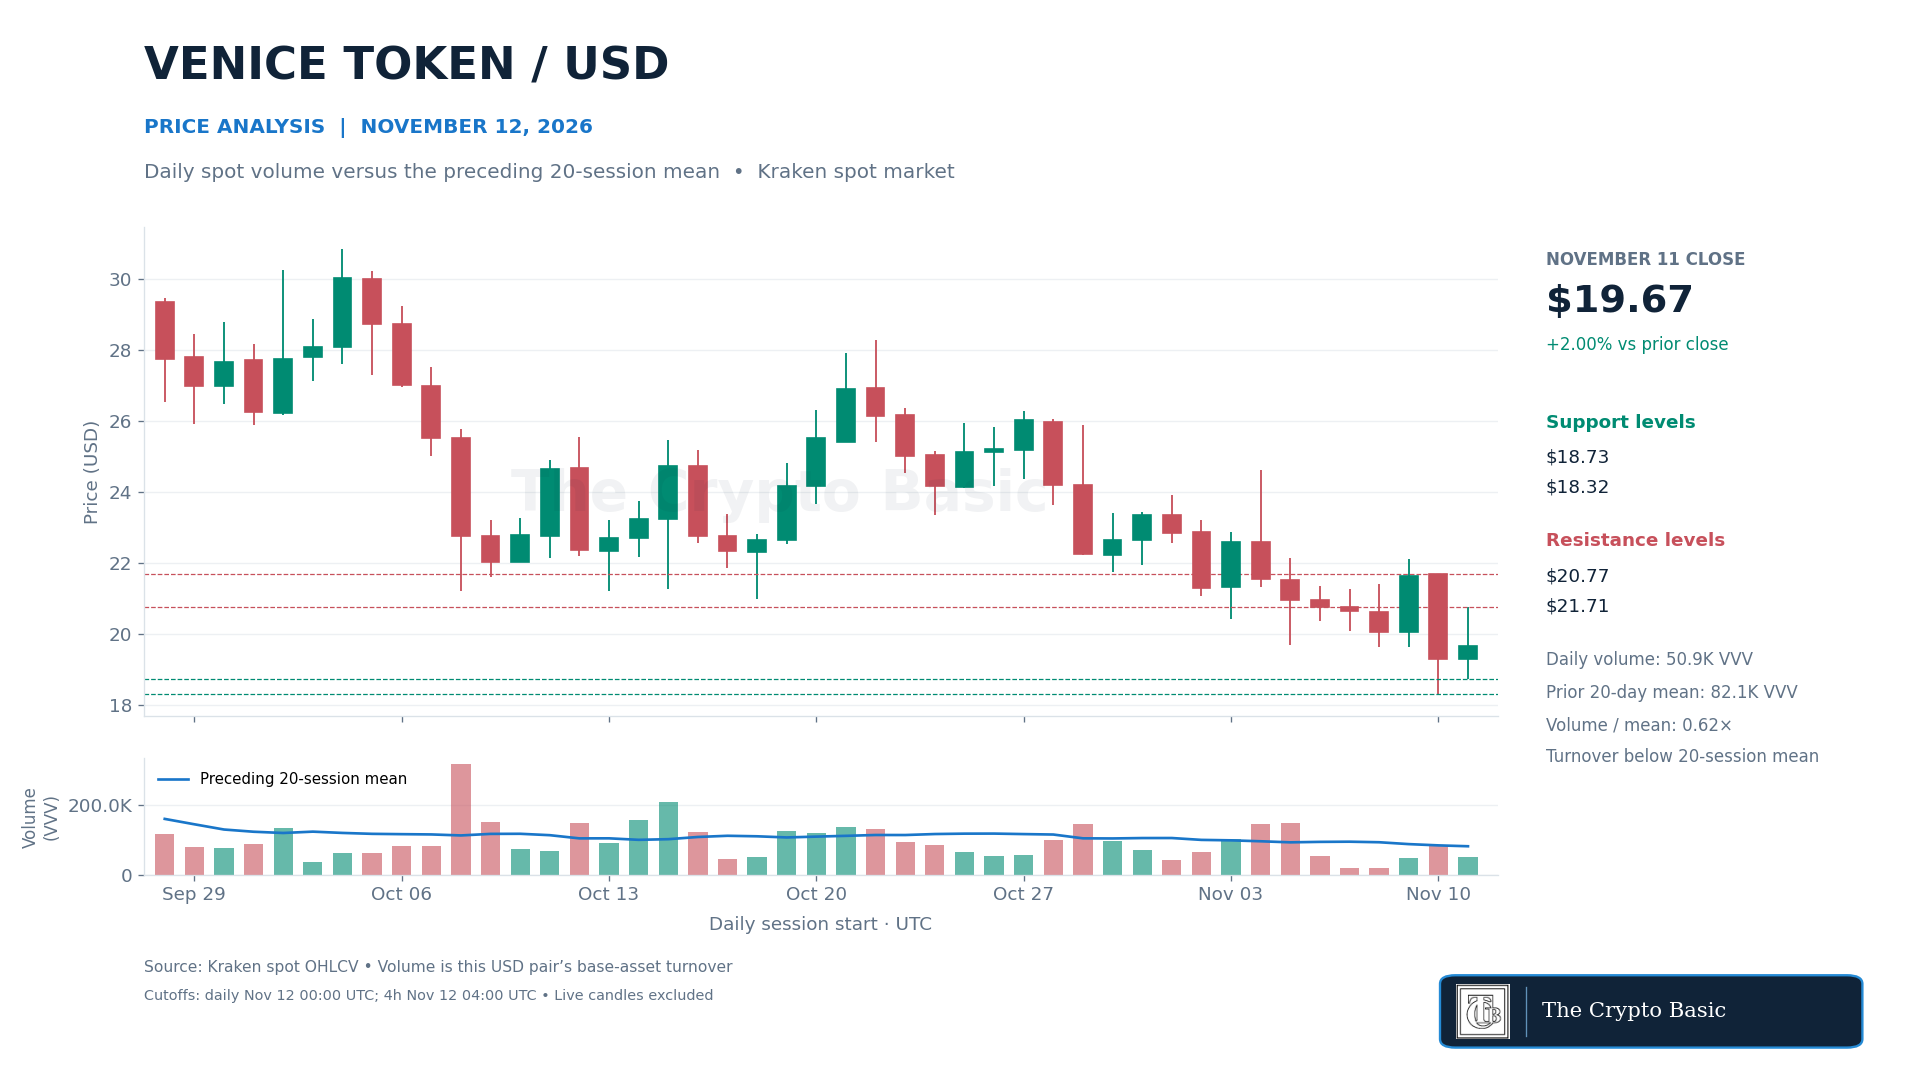
Approximately 50,935 VVV traded on the spot USD pair, compared with a preceding 20-session average of 82,079 VVV. Wednesday’s turnover was therefore 0.62 times its recent average. Price advanced, but the lower participation provides less evidence of broad conviction than a similarly sized gain on elevated volume.
The latest completed four-hour candle closed at $19.763. A daily close above $20.771 would clear Wednesday’s high, with $21.706 providing the next resistance and bullish confirmation point. A close below $18.73 would weaken the rebound; losing Tuesday’s $18.32 low would invalidate it and extend the decline beneath the latest 60-session range.
Ondo remains below falling 20-day and 50-day averages
Ondo fell 2.34% on Wednesday to close at $0.35875. It reached $0.37698 before falling to $0.35342, leaving the close near the bottom of the daily range. The latest $0.356653 price was 17.26% below the $0.431072 recorded in our October 15 ONDO analysis.
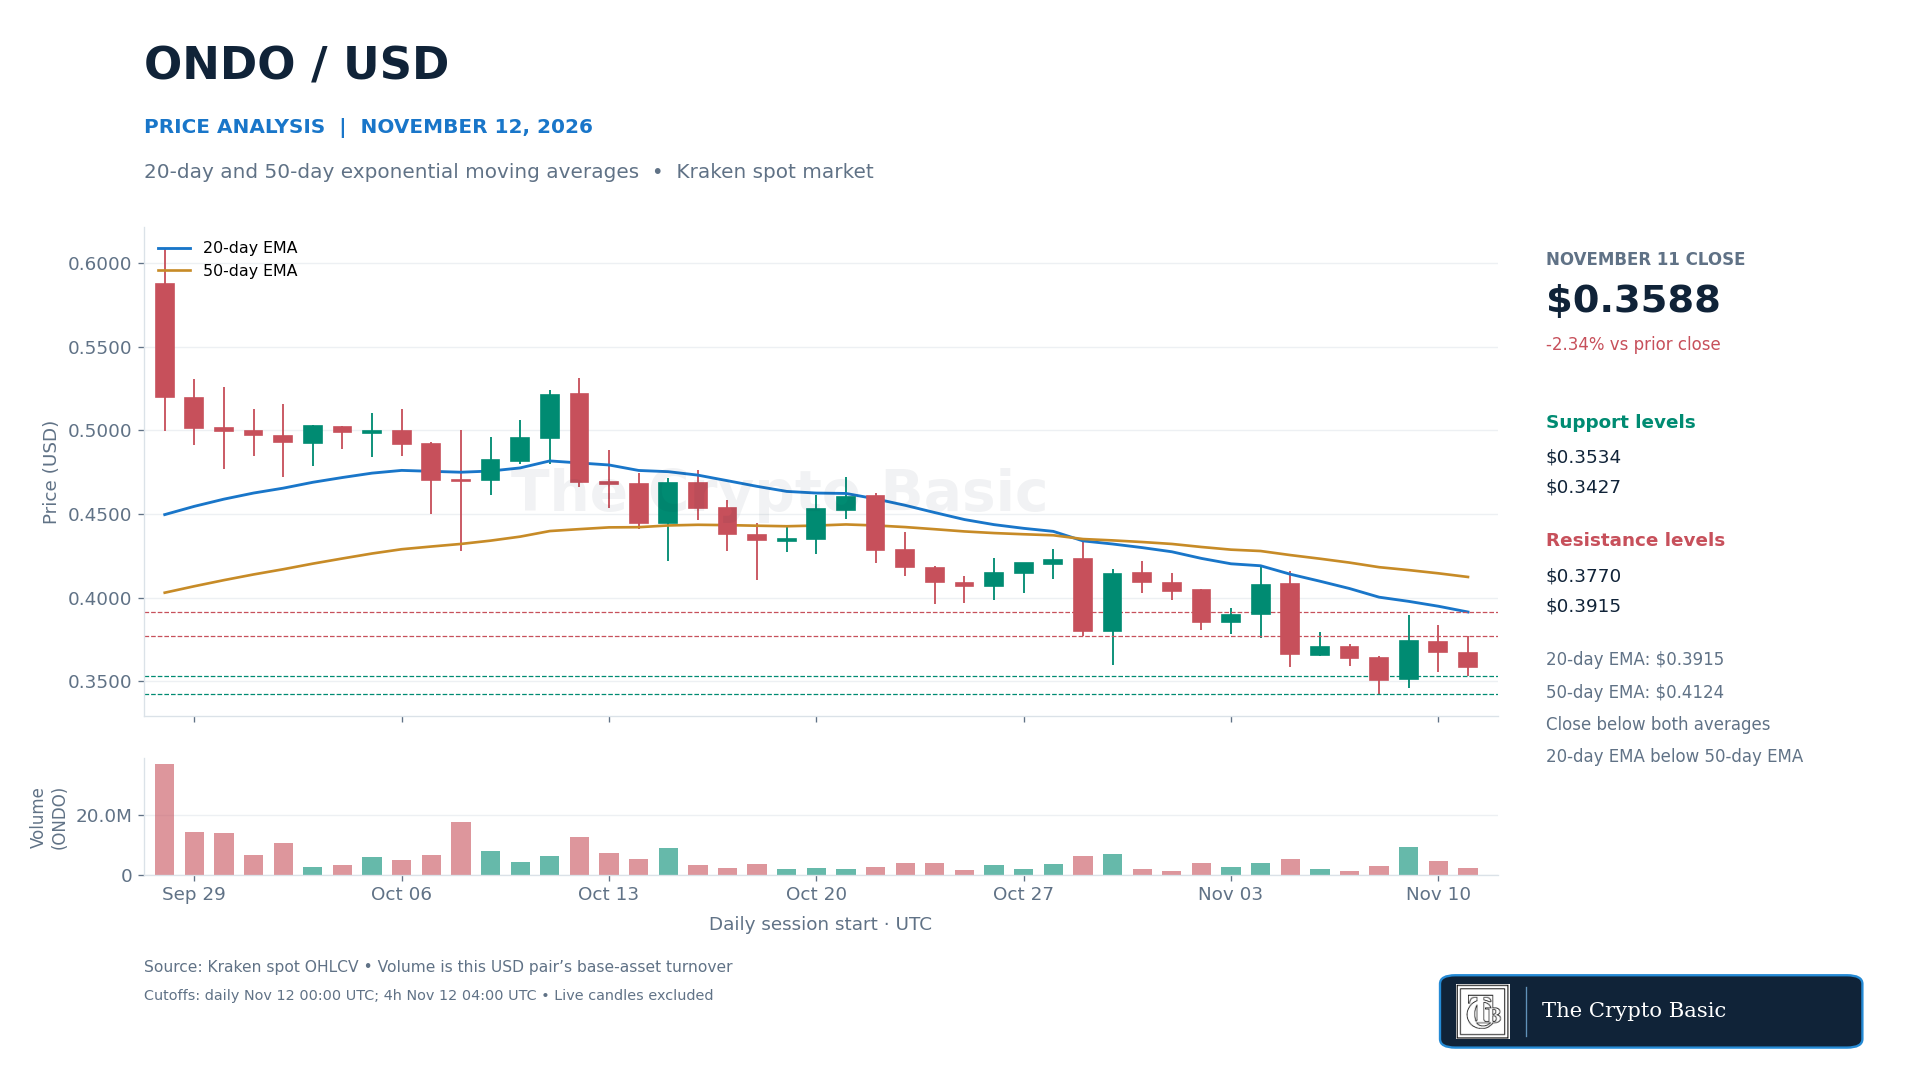
Our October 15 report placed ONDO between its 20-day and 50-day averages. The 20-day exponential moving average has now fallen to $0.39150 from $0.39494, while the 50-day EMA declined to $0.41243 from $0.41462.
Price remains below both, and the faster average remains beneath the slower one. Wednesday therefore extended an existing bearish alignment rather than producing a new crossover. The completed four-hour close at $0.35631 was also below its corresponding averages.
A daily close above $0.37698 would clear Wednesday’s high, but ONDO would still need to reclaim the falling 20-day EMA near $0.39150 to improve the trend position. A close below $0.35342 would expose the November 8 low at $0.34265. Recovering the 20-day average would invalidate the immediate continuation case; losing $0.34265 would confirm a fresh lower low.
Aster holds above its first Fibonacci retracement
Aster gained 2.84% on Wednesday to close at $0.65565, after trading between $0.63684 and $0.66289. The latest completed four-hour candle ended at $0.65363, keeping the short-term move above the first retracement but beneath Wednesday’s high.
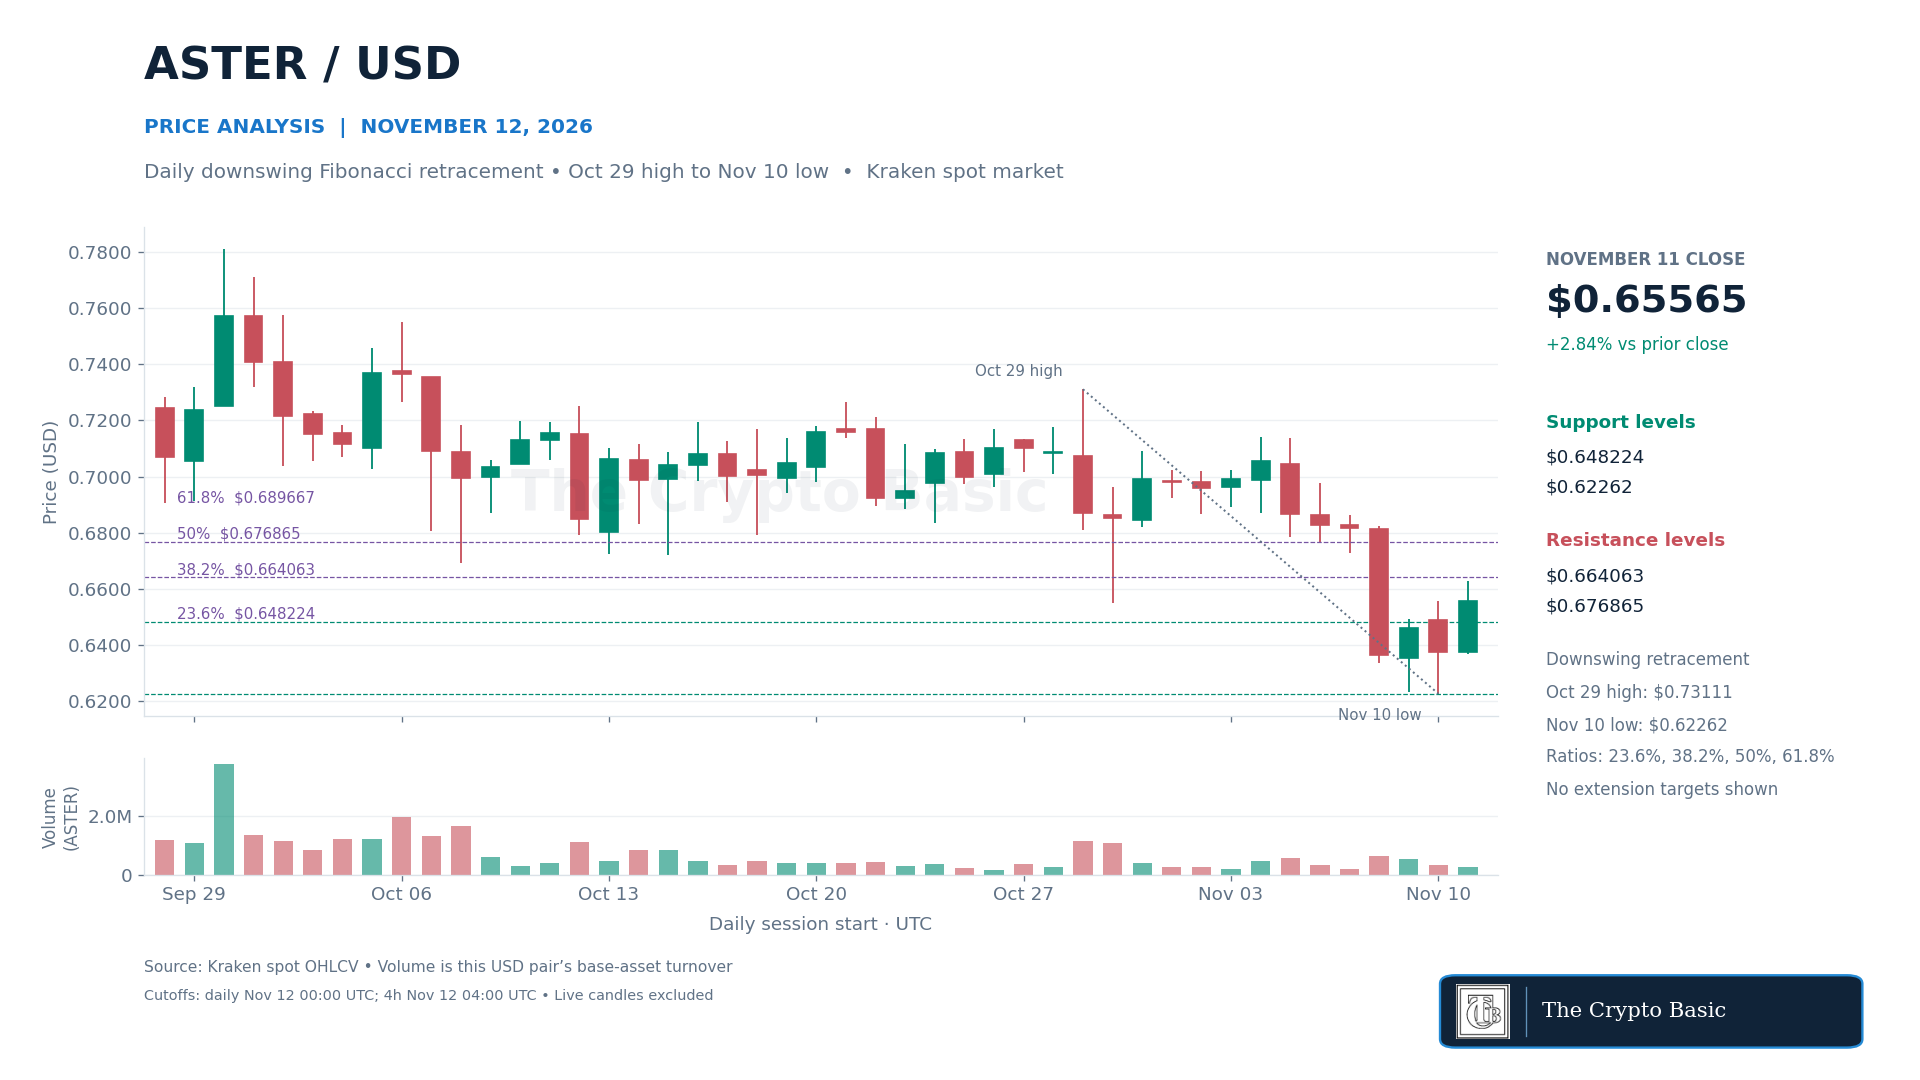
The Fibonacci map measures a prospective recovery of the downswing from the October 29 high at $0.73111 to the November 10 low at $0.62262. The 23.6% retracement stands at $0.648224, followed by the 38.2% level at $0.664063, the midpoint at $0.676865 and the 61.8% level at $0.689667.
Wednesday’s close held above the first retracement but remained below $0.664063. A daily close above that level would strengthen the recovery toward $0.676865. A return below $0.648224 would weaken the setup, while a close beneath $0.62262 would invalidate the rebound and confirm a fresh extension of the completed downswing. The higher retracement levels are conditional resistance, not projected outcomes.