Home Blog Page 2

XRP NUPL Hits 8-Month High as Price Rebound Pushes Market Into Hope-Fear Phase

0

The XRP NUPL metric recently rose to a level last seen in January 2026, as the latest price rebound pushes XRP into the hope-fear phase.

XRP has continued its recovery after falling to $1.25 on Sept. 16. The decline did not last, as buyers have since pushed the price back to $1.53 within days. Currently, XRP trades at $1.54, extending a recovery that has gained strength throughout the third quarter of 2026.

Notably, XRP first posted a 2.16% gain in July 2026 before recording a much stronger 30% rise in August 2026. The token has so far added another 11% in September 2026 alone. 

These three consecutive monthly gains suggest stronger buying activity and a broader improvement in market conditions, with both technical and on-chain data now reflecting the change.

NUPL Crosses Into Hope-Fear Territory for the First Time Since January

One of the signs of this change comes from XRP’s Net Unrealized Profit/Loss, or NUPL. For the uninitiated, the on-chain indicator measures the overall unrealized profit or loss of XRP holders by comparing the current value of their coins with the prices at which those coins last moved on the blockchain. 

An NUPL reading above zero means the average holder is in profit, while a reading below zero shows that holders collectively carry losses.

XRP NUPL Glassnode
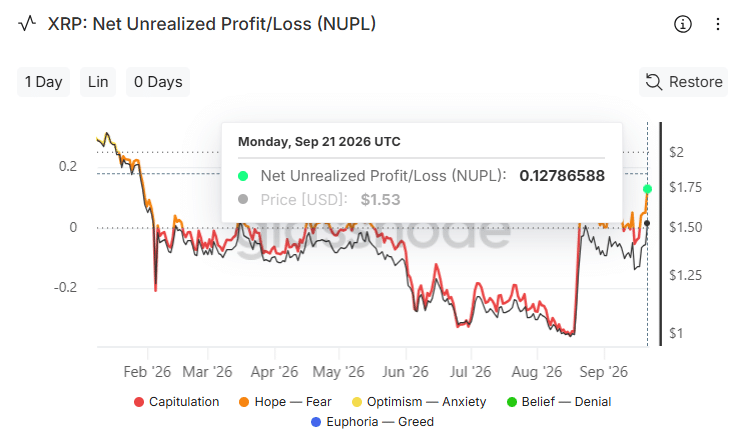
XRP NUPL | Source: Glassnode

Current data shows that XRP’s NUPL has climbed to 0.1278, moving the indicator into the Hope-Fear phase. This phase indicates that the market has moved out of broad losses and into the early stages of recovery. 

Sentiment can improve during this stage, although the market has not yet reached the level of optimism often seen near cycle peaks.

The 0.1278 reading also marks an eight-month high. XRP’s NUPL last reached similar levels in January 2026. For much of 2026, the indicator remained deeply negative and moved close to capitulation levels during the market’s mid-year weakness. 

The return to positive territory shows an improvement in holder positioning. However, the 0.1278 reading remains relatively low, leaving substantial room before the indicator reaches overheated levels.

Ichimoku Cloud Break Adds Technical Confirmation

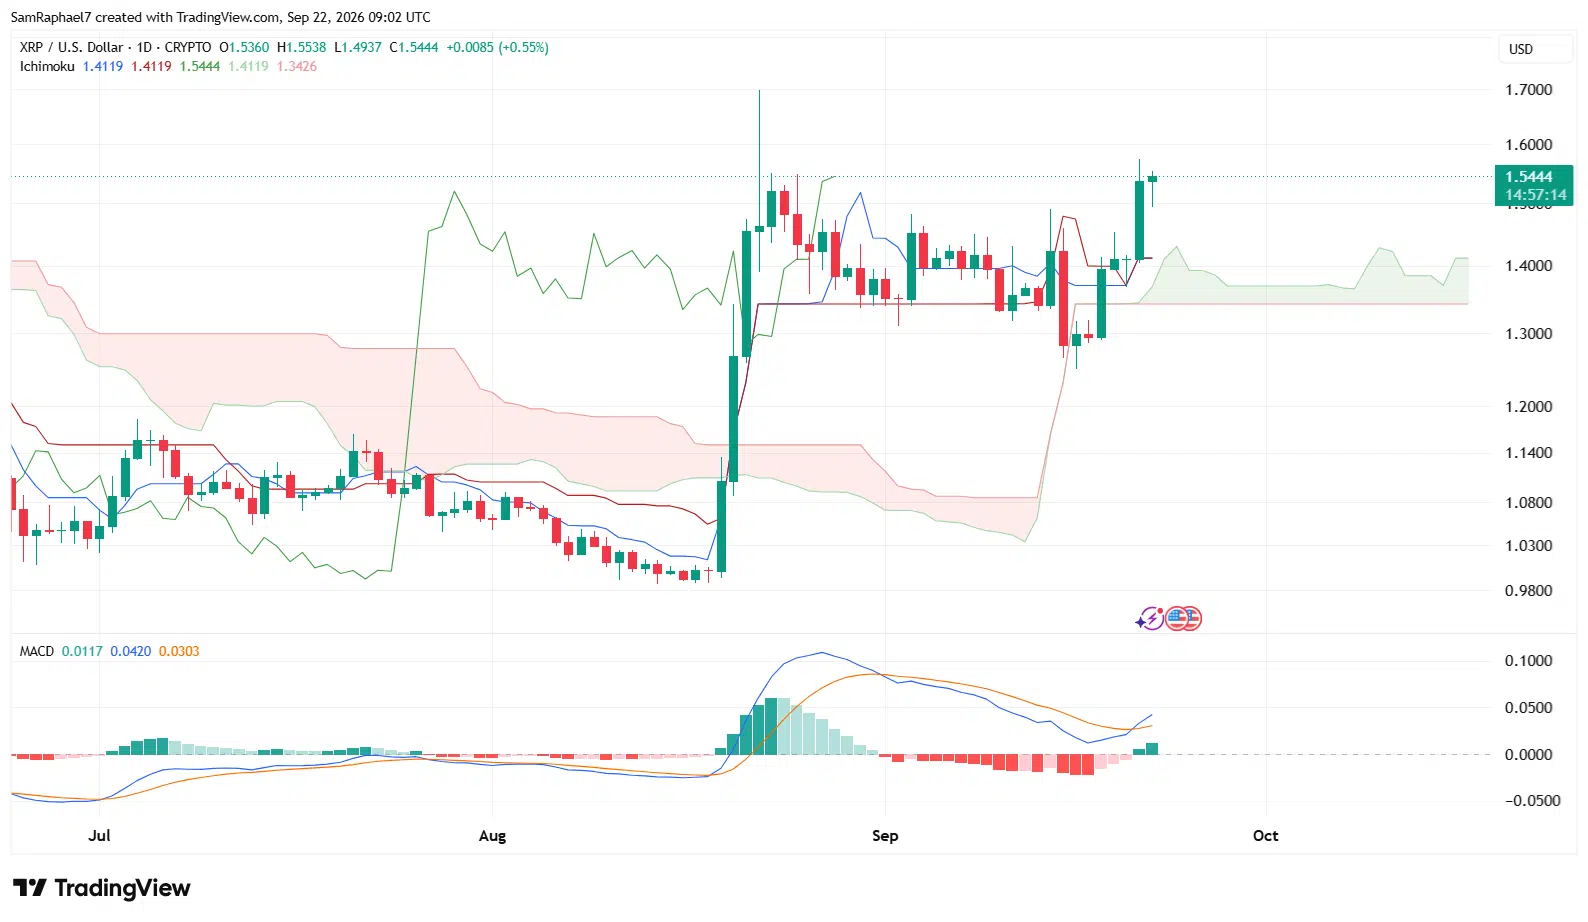
XRP’s daily chart confirms the improving on-chain picture. The price has broken above the Ichimoku Cloud. Specifically, XRP recently moved above the Kumo, which indicates a change toward a positive trend. 

The cloud extending into October is also green, meaning Senkou Span A remains above Senkou Span B. This structure suggests continued strength in the forward-looking part of the indicator.

XRP Ichimoku Cloud
XRP Ichimoku Cloud

Senkou Span A currently stands at $1.5444, matching XRP’s current price of $1.5444. This makes $1.5444 the immediate level to watch. If XRP holds above Span A, the cloud breakout remains in place. If the price falls below it, XRP could move back inside the cloud.

Senkou Span B stands at $1.4119 and marks the lower boundary of the forward cloud. The Tenkan-sen and Kijun-sen also sit at $1.4119, creating a strong support cluster around $1.41. 

The Tenkan-sen tracks shorter-term price momentum, while the Kijun-sen shows medium-term price balance. The Chikou Span stands at $1.3426 and compares the current price with price action from 26 trading days earlier. Its position also shows XRP trading above the earlier reference point.

Both Signals Suggest Room to Run

XRP’s NUPL and Ichimoku readings now show similar signs of improvement. NUPL has reached its highest level in eight months, while XRP’s daily chart shows the price above the Ichimoku Cloud. 

These two indicators show how much the market has recovered from the weakness seen during the middle of 2026.

The next key test remains $1.5444, where Senkou Span A currently meets XRP’s price. Holding above this level would keep the cloud breakout intact. On the other hand, $1.41 remains an important support area because Senkou Span B, the Tenkan-sen, and the Kijun-sen all meet at $1.4119.

Novo Nordisk Stock Slides 8% After 2030 Strategy; CEO Signals M&A as CagriSema Data Lands

0

Novo Nordisk (NYSE: NVO) shares suffered their sharpest decline in months after the drugmaker’s long-term strategy failed to ease concerns about slowing growth, pricing pressure, and its reliance on semaglutide, even as fresh Phase 3 data gave investors a more favorable look at next-generation obesity candidate CagriSema.

Novo’s U.S.-listed shares closed 7.96% lower at $39.80 on Monday, Sept. 21, down from $43.24 in the previous session. Trading volume reached about 49.34 million shares, more than four times its roughly 12 million-share average, underscoring the intensity of the reaction. 

The decline stood out against a strong day for the broader U.S. market. The S&P 500 advanced 1.49% Monday, while the Nasdaq Composite closed at a record high, suggesting the pressure on Novo was primarily company-specific rather than part of a broad risk-off move.

The selloff followed Novo’s Capital Markets Day in London, where management laid out its ambitions through 2030 but stopped short of providing the level of growth acceleration some investors had hoped for. A day later, CEO Mike Doustdar added another dimension to the developing story, saying Novo was prepared to look externally for drugs that could fill gaps in its pipeline or outperform medicines being developed internally.

Novo’s 2030 Targets Did Not Resolve the Semaglutide Question

Novo’s Capital Markets Day was intended to show how the company plans to sustain growth as competition intensifies and patent protection for semaglutide — the active ingredient in Wegovy and Ozempic — approaches expiration in major markets in the early 2030s. 

Management set several longer-term strategic ambitions for 2030. Novo wants to launch more than five medicines capable of generating multibillion-dollar annual sales by 2030, enter or complete at least five Phase 3 programs in obesity and diabetes and at least five in other therapeutic areas by 2030, and serve more than 60 million patients globally by the end of the decade. The company also wants to build enough capacity to serve about 15 million patients with oral obesity therapies.

Novo also said it aims to deliver 2026–2030 revenue CAGR in line with industry peers while maintaining a broadly stable operating margin, with both ambitions based on adjusted metrics. The company stressed that these are strategic ambitions, not financial outlook or guidance.

The problem for the stock was less the absence of growth than the level of growth implied. 

Reuters reported that BMO Capital Markets analyst Evan Seigerman interpreted Novo’s targets as pointing to roughly 3.6% annual revenue growth, a pace he said was already embedded in market expectations. Investors also questioned management about whether next-generation obesity medicines could maintain premium pricing after semaglutide loses exclusivity.

Those concerns are financially significant because Ozempic and Wegovy remain the core of Novo’s business. Reuters reported Tuesday that the two products account for about three-quarters of company sales. Competition is also intensifying, particularly from Eli Lilly, whose Zepbound franchise has gained ground against Wegovy.

Against that backdrop, Monday’s reaction suggested that ambitious pipeline targets alone were not enough to change investor expectations. Novo still needs to demonstrate that its next generation of products can replace enough of the growth and economics associated with semaglutide before the patent cliff becomes material.

CagriSema Data Improve the Pipeline Story — With an Important Dose Caveat

The investor-day weakness came despite encouraging new CagriSema results.

Novo said the REIMAGINE 5 Phase 3 trial tested once-weekly CagriSema at 1.0 mg of cagrilintide plus 1.0 mg of semaglutide against tirzepatide 5 mg in adults with type 2 diabetes inadequately controlled by existing therapy.

At week 60, patients receiving CagriSema lost an estimated 12.4% of body weight, compared with 9.1% for tirzepatide. CagriSema reduced HbA1c by 1.71 percentage points versus 1.67 points for tirzepatide, satisfying the non-inferiority objective for glycemic control.

Novo also reported results from the Phase 3 REDEFINE 9 obesity study. The 1.0 mg/1.0 mg dose of CagriSema produced 21.0% weight loss at 68 weeks, compared with 2.0% for placebo.

The findings add evidence that CagriSema can produce substantial weight loss at lower doses, but the tirzepatide comparison requires context. REIMAGINE 5 used the 5 mg tirzepatide dose rather than Lilly’s maximum 15 mg dose.

That distinction is particularly relevant because Novo’s earlier REDEFINE 4 head-to-head obesity study compared the higher 2.4 mg/2.4 mg dose of CagriSema with tirzepatide 15 mg. CagriSema produced 23.0% weight loss under the efficacy estimand versus 25.5% for tirzepatide, and the study failed its primary objective of demonstrating non-inferiority.

The new diabetes results therefore improve the evidence supporting CagriSema at lower doses, but they do not erase the earlier high-dose head-to-head result.

FDA Decision Could Turn CagriSema Into a Commercial Catalyst 

Novo filed CagriSema with the U.S. Food and Drug Administration in December 2025 for chronic weight management. The application covers the 2.4 mg/2.4 mg fixed-dose combination of cagrilintide and semaglutide. 

The company now expects an FDA decision in Q4 2026. If approved, Novo is targeting a launch in early 2027, potentially making CagriSema the first injectable treatment combining a GLP-1 receptor agonist with an amylin analogue.

The regulatory decision is important because it would move CagriSema from clinical development toward commercial execution at a time when Novo is trying to broaden its future growth base beyond its current semaglutide franchise.

Additional CagriSema development is already planned. The REDEFINE 11 Phase 3 study evaluating the full weight-loss potential of CagriSema 2.4 mg/2.4 mg is expected to report in the first half of 2027, while Novo has also planned development of a higher-dose combination.

Doustdar Opens the Door Wider to Acquisitions

Novo’s developing M&A strategy adds another potential route to rebuilding and expanding its pipeline.

Doustdar said Tuesday that Novo was willing to acquire outside assets when other companies have developed drugs that could fill gaps or perform better than Novo’s internal candidates.

“Let’s see where the gaps are, and let’s go out and see who has produced or is about to introduce better drugs than we can do on our own,” Doustdar told CNBC, according to a Reuters report.

The remarks reinforced comments from Monday’s investor meeting, where Novo said its balance sheet could support acquisitions larger than traditional bolt-on transactions. Importantly, the company said its target of more than DKK150 billion in 2035 pipeline sales is based on internal, risk-adjusted assets and does not include future M&A, meaning acquisitions could add to that target rather than simply help achieve it.

Doustdar indicated there may be greater acquisition opportunities in obesity-adjacent areas such as cardiovascular disease than in obesity itself. Such deals could broaden Novo’s pipeline while allowing the company to use its existing cardiometabolic commercial infrastructure.

NVOon Reflects the Equity Pressure in Tokenized Markets

Meanwhile, Novo’s selloff was also reflected in tokenized equity markets.

CoinMarketCap data showed Novo Nordisk Tokenized Stock (Ondo), or NVOon, at $40.55, down 4.81% over 24 hours, with about 52.36K tokens in circulation and a market capitalization of approximately $2.12 million.

NVOon is separate from the NYSE-listed ADR. Ondo Global Markets describes the instrument as a tokenized product designed to provide economic exposure similar to holding NVO, primarily for eligible non-U.S. users, and it can trade outside traditional U.S. exchange hours.

What Comes Next for Novo Nordisk Stock 

Novo’s next scheduled corporate catalyst is its first-nine-month 2026 results on Nov. 4. Separately, the FDA is expected to decide on CagriSema in Q4 2026. Approval would shift attention from clinical evidence toward commercial execution, where pricing, access, demand, and competitive positioning against Lilly will become increasingly important.

Investors will also be able to compare Novo’s new long-range strategy against near-term sales trends for Wegovy and Ozempic, margins, guidance, and progress in oral obesity treatments.

Monday’s nearly 8% decline showed that the market remains focused on whether Novo can convert its pipeline ambitions into a growth profile strong enough to offset the eventual erosion of semaglutide exclusivity. CagriSema, the FDA decision, and a more open M&A strategy now form three of the clearest tests of that plan.

Shiba Inu Network Activity Remains 99.96% Below 2025 Peak, Despite Shibarium Fix

0

Shiba Inu has rallied following positive developments surrounding Shibarium, but activity on the L2 blockchain remains significantly below its previous highs.

The past week has brought several positive developments to the Shiba Inu ecosystem, including an update on Shibarium’s ongoing reorganization and migration.

Mazrael, a Shiba Inu proponent, recently shared an update concerning the network’s migration. According to Mazrael, Kaal Dhairya, a major member of the ecosystem team, confirmed that the development team had resolved Shibarium’s reorganization issue.

However, one step remains. Mazrael said there is still a need for the DRPC to complete the transition. 

Shibarium Resolves Reorganization Issue

The latest update comes months after Shibarium shut down its previous public RPC endpoints. For context, RPC endpoints connect users and applications to blockchain networks. Therefore, transitioning this infrastructure represents an important step toward improving Shibarium’s reliability as the network continues to evolve.

Although resolving the reorganization issue marks another positive development for Shibarium, network activity has yet to show a similar recovery.

SHIB Rallies Above $0.000006

Days after the Shibarium update emerged, Shiba Inu climbed above $0.000006 and reached a multi-week high of $0.000006254.

The broader market rally appears to have provided the primary catalyst for SHIB’s move. Nevertheless, the positive developments surrounding the Shiba Inu ecosystem have also added to the improving sentiment.

As a result, some market participants expected the renewed interest in SHIB and the progress on Shibarium to translate into higher Layer-2 activity. The latest data portrays a different picture. 

Shibarium Activity Remains Near Multi-Year Lows

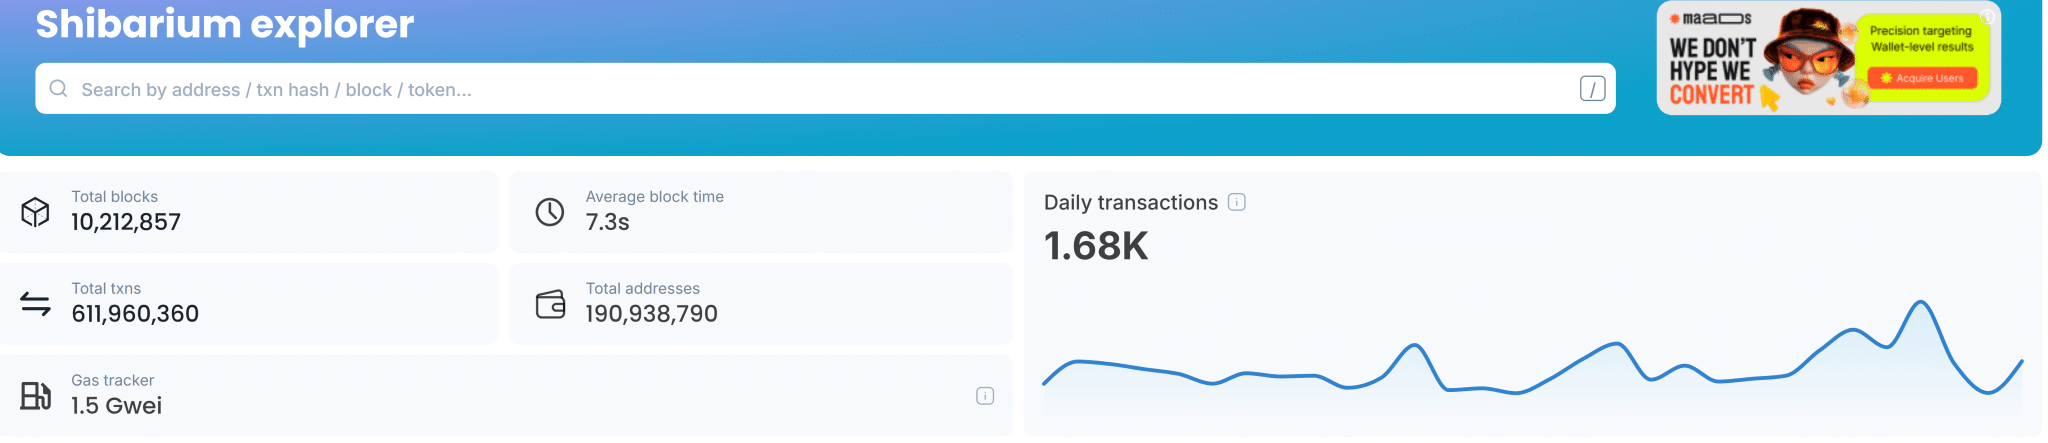
At press time, Shibarium was processing only around 1,680 daily transactions.

That figure represents a 99.96% decline from the 4.69 million daily transactions the network recorded on August 21, 2025. Consequently, current activity remains only a fraction of the levels Shibarium reached during its peak period.

The Layer-2 network also recorded significantly higher activity during its early months following its 2023 launch. At the time, Shibarium frequently processed around 4 million transactions per day.

That elevated activity helped drive the network’s cumulative transaction count above 1.56 billion.

Shibarium Explorer Continues Blockchain Indexing

However, the transaction figure displayed by Shibarium’s blockchain explorer requires some context.

The explorer currently shows 611.96 million total transactions, while Shibarium has processed more than 1.56 billion transactions since its launch.

This discrepancy results from the explorer’s ongoing indexing process. So far, only around 53% of Shibarium’s blocks have been indexed, meaning the displayed transaction count does not yet capture the network’s complete transaction history. 

Therefore, the 611.96 million figure should not be interpreted as Shibarium’s lifetime transaction count. 

Shibarium Activity
Shibarium Activity

Bitcoin Data Shows Few Strong Days Can Reshape Monthly Returns

0

Bitcoin commentator Quinten Francois recently argued that just a few strong trading days can make up most of BTC’s gains in a month.

Francois shared a chart showing Bitcoin’s monthly returns and what those returns would look like if the four best-performing days were removed. His point is that trying to perfectly time when to buy and sell Bitcoin can be risky.

Recent Examples

In August 2026, Bitcoin gained 24.9% for the month. But without its four best days, the gain would have been only 0.5%. In November 2024, Bitcoin gained 37.1%. Removing the four strongest days reduced the gain to 4%.

Earlier Examples

The difference was even bigger during some previous Bitcoin rallies:

  • March 2023: Bitcoin gained 23.2%, but fell 8.3% when the four best days were removed.
  • February 2021: Bitcoin gained 36.8%, but returned -5.2% without those four days.
  • April 2020: Bitcoin gained 34.5%, compared with -1.9% after removing the four strongest days.
  • May 2019: Bitcoin gained 62.5%, while the return was 2.6% without the four best days.
  • December 2017: Bitcoin gained 39.3%, but the return dropped to -22.6% after removing those days.

The examples show that a small number of very strong trading days can have a major impact on Bitcoin’s overall monthly performance.

Bitcoin monthly Return

X User Questions the Interpretation

The figures drew criticism from X user @b0tmkr, who said the analysis does not tell the full story because it only removes Bitcoin’s best-performing days. The user argued that removing only positive outliers can give a misleading picture of Bitcoin’s returns.

The criticism is mainly about the method used. The chart looks at what happens when investors miss Bitcoin’s four best days. It does not consider what would happen if they also missed the market’s worst days.

Francois responded that his main point was simply that a large share of Bitcoin’s gains can happen in just a few days. He said this is why investors who stay out of the market could miss some of its biggest moves.

Time in the Market vs. Timing the Market

This idea is similar to the common investment saying: “Time in the market beats timing the market.”

Investors who try to avoid market drops have to make two decisions correctly: when to sell and when to buy again. If they miss a strong recovery, their returns can suffer.

A Bank of Singapore analysis published in February 2025 also found that missing a small number of the market’s strongest periods can significantly reduce long-term returns. This shows how difficult it can be to predict short-term market moves.

Bitcoin’s August performance is a good example. Someone who was out of the market during Bitcoin’s four strongest days would have captured only a small part of the month’s total gain.

Bitcoin Reaches $87,300

Bitcoin rose to $87,300 on Tuesday, its highest level since January. The rally has renewed attention on the crypto market as many now believe the bull market is resuming.

Bitcoin was trading around $85,500 at the time of writing, up 4.4% over the past 24 hours and 11% over the past week. Now, its year-to-date loss has narrowed to about 2.3%, although it is still down around 23% over the past year.

The latest move also adds to Bitcoin’s recovery from its recent low. In particular, Bitcoin has gained about 51% from its low roughly two months earlier.

XRP Is Quietly Draining Off Exchanges, And Data Suggests the Next Move Could Be Up

0

XRP exchange data indicates that the token’s supply may actually be dropping on the Binance exchange despite recent whale inflows.

XRP entered Sept. 22 at an important point after climbing to $1.57 in the previous session and then pulling back to $1.51 at press time. While the pullback could look like a sign that the recent rally is losing strength, the data behind XRP’s supply remains bullish.

Binance Is Losing XRP Supply

XRP currently trades at $1.5176, while its daily range stands between $1.5062 and $1.5398. However, the more important development comes from Binance. 

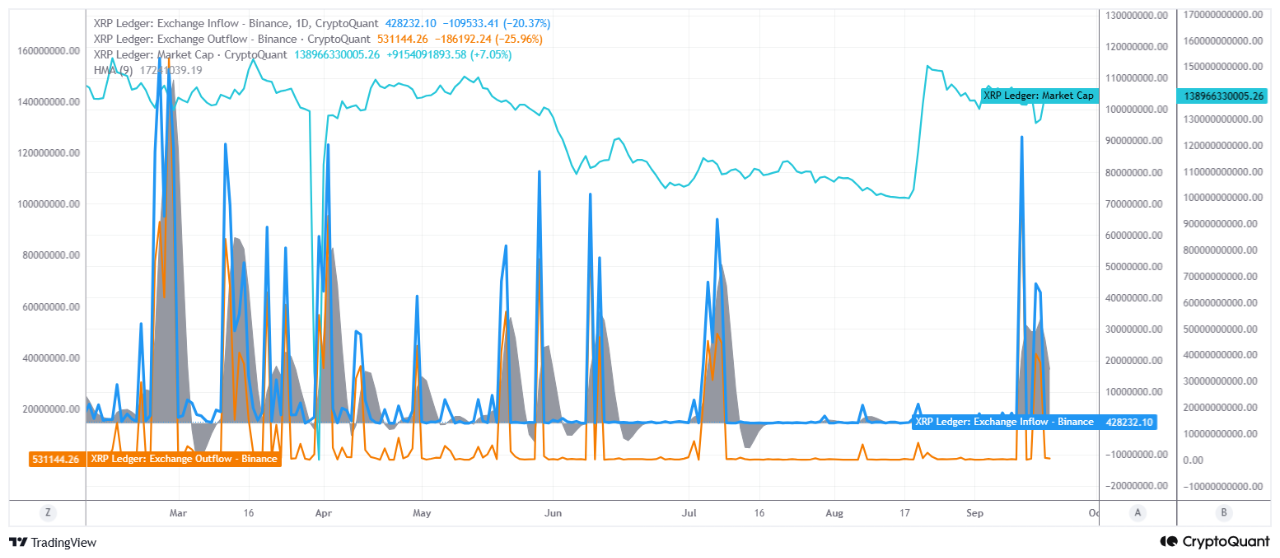
Specifically, XRP inflows to the exchange have fallen 20.37%, while outflows have declined 25.96%. Because outflows have dropped by a larger amount than inflows, Binance has recorded a net negative flow of roughly 102,912 XRP.

XRP Exchange Data | Source: CryptoQuant

This is important because XRP held on an exchange remains readily available for trading and selling. When holders move XRP from Binance into private wallets, they reduce the amount of supply immediately available on the market. 

As a result, the current flow data suggests that some holders are moving their XRP away from exchanges instead of selling into the recent price recovery. The fact that this decline in exchange reserves comes during a price rally is also important.

XRP Whale Flows Show Increased Activity

Nonetheless, CryptoQuant contributor Arab Chain recently reported that large-wallet inflows to Binance reached about 1.6 billion XRP over the previous 30 days. This marked the highest cumulative reading since March, after whale activity weakened through May, June, and July.

However, Binance’s XRP reserve has not risen by a similar amount. The exchange ended the week with 2,630,628,140 XRP, just 0.22% above its quarterly baseline and 0.34% higher than the previous week. 

The increase in whale inflows with the relatively small change in reserves suggests increased turnover and repositioning, not a wave of selling. Whales are moving large amounts of XRP, but the data does not yet confirm distribution.

XRP Market Cap Remains Elevated

The market cap data also confirms a less bearish reading of the correction. XRP’s fully diluted market cap, which counts all tokens in existence, climbed from around $103 billion earlier in the rally to more than $150 billion at the peak. It has since fallen back to around $138.97 billion.

The market cap based on XRP’s circulating supply currently sits closer to $94 billion. Despite the pullback from the rally’s peak, the market cap remains relatively high while net exchange flows remain negative. 

This suggests that the correction has not yet produced a fresh wave of selling strong enough to significantly increase XRP supply on exchanges.

September Seasonality Could Still Weigh on XRP

There is, however, one risk in the current setup: XRP’s September seasonal record. In seven of the last eight years, XRP’s September performance moved in the opposite direction of its August performance. 

On the two occasions when August ended with a gain, September followed with declines of 14% in 2020 and 19.6% in 2021.

This pattern is particularly relevant this year because XRP gained 30% in August, marking its strongest August performance since 2021. Seasonal trends do not determine XRP’s next move, but the historical pattern may add another headwind as the token enters the final stretch of September.

For now, the underlying data does not show a clear breakdown. The next important level on the upside is $1.55. A clean break above that level could open the way toward $1.68. On the other hand, buyers need to defend the $1.4860 support zone to keep the current structure intact.

MMCrypto Says Trading Very Risky XRP Bounce

0

MMCrypto Is Back on XRP, Says “I Am Trading This Bounce.”

Top Bitcoin trader MMCrypto is now focusing on XRP, sharing a nine-year XRP chart suggesting the token is starting another bounce after recovering from its August low.

 MMCrypto wrote on X:

I am Trading this Bounce [very risky]

Trading Opportunity on XRP

The chart shows XRP’s 9-year long-term price pattern, with two trendlines coming together. MMCrypto believes XRP’s recent price move up from the lower trendline offers a trading opportunity. Meanwhile, he warned that it is very risky.

XRP had fallen below $1 earlier this year, hitting $0.978 in August. It then recovered strongly, climbing to around $1.70 by the third week of August, a gain of about 72%.

The rally later slowed, and XRP dropped about 26.6% to $1.2468. It then recovered again, moving above $1.57 as of yesterday, its highest price for September so far.

At the time of writing, XRP was trading around $1.52, up 6.6% in 24 hours and 8.86% over the past week.

MMCrypto Returns to XRP Trading

Notably, MMCrypto is talking about XRP again after not publicly sharing an XRP trade since September 2025.

In a post from September 13, 2025, he showed an 11x leveraged XRP trade that he entered at around $2.31. When XRP was trading near $3.16, the trade had made more than $1.78 million in unrealized profit, or about 401%.

That trade happened when XRP broke above $3 during the 2025 crypto market rally. Since then, XRP has fallen sharply, dropping below $1 in August before starting its recent recovery. 

This means MMCrypto is returning to XRP under very different market conditions. His new chart shows two long-term trendlines: one rising and one falling. XRP is currently trading near the rising trendline, which MMCrypto sees as the possible starting point for another bounce.

Bitcoin Move Adds to Crypto Recovery

XRP’s recovery is happening at the same time as Bitcoin is moving higher. Bitcoin rose above $87,000 yesterday, reaching its highest level in about nine months. This has also helped the wider crypto market recover.

Bitcoin’s performance is important for XRP because XRP often moves dramatically when BTC price soars. If the overall market continues to recover, it will support XRP’s move higher.

However, MMCrypto called the XRP setup “very risky,” meaning he is not saying XRP will keep rising.

Traders Debate Timing of XRP Bounce

Responses to MMCrypto’s post highlight the mixed sentiment surrounding the setup. One X user, @Ripplesinwales, joked that “Hell has frozen over” as Bitcoin maximalists resume posting about XRP trades.

Another user, Majid Mansuri, argued that traders should wait for a correction before entering, pointing to Bitcoin’s price action as a potential risk factor for the XRP trade.

Meanwhile, @xrpcommuni654 highlighted the significance of the nine-year chart, writing that the bounce setup was risky but “definitely one to watch closely.”

AMD Market Cap Tops $1 Trillion Amid Meta Muse-Driven AI CPU Rally

0

Advanced Micro Devices Inc. (NASDAQ: AMD) entered the $1 trillion market-capitalization club for the first time on Monday as a broad rally in artificial-intelligence semiconductor stocks lifted the chipmaker to a record high.

AMD shares jumped 9.95% to close at $615.52 on Monday, Sept. 21, after reaching a new 52-week and all-time intraday high of $616.69. The move made AMD the fourth U.S. chipmaker to cross the $1 trillion threshold, following Nvidia, Broadcom, and Micron.

The stock pulled back in early Tuesday trading, changing hands at $608.99 at 05:40 a.m. ET, down 1.06% in premarket trading, according to Yahoo Finance.

Monday’s rally came amid renewed buying in AI infrastructure stocks after Meta Platforms’ Muse AI agent climbed to the top of Apple’s free-app rankings. Bloomberg reported that the development helped lift shares of companies exposed to server CPUs used in agentic-AI workloads, including AMD, Intel and Arm.

Meta’s Muse Lifts CPU-Linked Chip Stocks 

AI agents can perform multi-step tasks, coordinate applications, and handle inference workloads, increasing the use of server CPUs alongside accelerators.

Bloomberg cited Jefferies analyst Jacky He as saying broader adoption of AI agents should support server-CPU demand through increased inference, orchestration, and infrastructure workloads. Bloomberg also reported that Meta is AMD’s second-largest customer and accounts for about 5.5% of AMD’s revenue, based on data it compiled.

The move extended across the semiconductor sector. Intel rose 12.14%, and Arm Holdings climbed 17.16% on Monday, while the Philadelphia Semiconductor Index gained about 4.3%. The Nasdaq Composite advanced 2.26% to a record closing high.

AMD Deepens Its Meta AI Infrastructure Relationship

In February, AMD and Meta announced a multi-year agreement covering up to 6 gigawatts of AMD Instinct GPU deployments. Shipments supporting the first gigawatt are scheduled to begin during the second half of 2026 using a custom GPU based on AMD’s MI450 architecture, sixth-generation EPYC “Venice” CPUs, and the company’s Helios rack-scale platform.

The agreement also includes equity-linked terms. AMD issued Meta a warrant covering up to 160 million AMD shares at an exercise price of $0.01 per share, with vesting tied to GPU-purchase milestones and specified AMD stock-price targets. As of June 27, no shares under the warrant had vested or become exercisable.

AMD said in July that the companies are co-engineering AI infrastructure across GPUs, EPYC CPUs, Pensando networking, and ROCm software, with Meta serving as a lead customer for the Venice server processor.

The collaboration also supports AMD’s expansion beyond standalone chips through Helios, its integrated rack-scale AI platform.

Data Center Business Drives Recent Growth

AMD reported second-quarter revenue of $11.5 billion, up 50% year over year, while Data Center revenue climbed 107% to $6.7 billion. The company attributed the increase primarily to demand for EPYC server processors and Instinct MI350-series GPUs.

For the third quarter, AMD expects revenue of approximately $13 billion, plus or minus $300 million, with a non-GAAP gross margin of about 56%.

Reuters reported that AMD was trading at roughly 41 times 12-month forward earnings during Monday’s rally, compared with about 16.3 times for Nvidia. AMD shares had risen about 185% in 2026.

AMDB Tokenized Stock Rises in 24-Hour Trading

Meanwhile, Advanced Micro Devices Tokenized bStocks (AMDB) traded at $607.18 at the same reporting time, up 5.67% over 24 hours, according to CoinMarketCap.

Twenty-four-hour trading volume rose 209% to $11.22 million, while approximately 10,900 AMDB tokens were in circulation, giving the product a market capitalization of roughly $6.62 million.

CoinMarketCap describes AMDB as a tokenized bStock providing economic exposure to AMD shares. The product trades separately from AMD common stock and operates in a market with different liquidity and market capitalization.

Upcoming AMD Updates

AMD’s next quarterly report will provide an update on third-quarter revenue, margins, and Data Center growth. The company’s investor-relations calendar has not yet listed a date for the earnings release.

AMD said in August that Helios was in production, with initial shipments on track to begin in the third quarter and ramp through the fourth quarter and into 2027. OpenAI is expected to begin bringing Helios-based infrastructure online in the fourth quarter of 2026 under its separate agreement with AMD.

Dan Gambardello Warns Traders Against Writing Off Cardano as ADA Eyes $0.40

0

Market veteran Dan Gambardello has urged traders not to write off Cardano as ADA approaches a potentially important technical breakout. 

Cardano started the week on a positive note as the broader cryptocurrency market staged a recovery. ADA climbed from an intraday low of $0.23 to around $0.25, strengthening its recent rebound despite the token’s significant decline over the past several months.

While some critics have questioned whether Cardano can regain its previous momentum, Gambardello has taken a different view. He warned traders against dismissing the cryptocurrency, pointing to a technical setup that could support a sharp upward move.

Gambardello Sees Potential Move to $0.40

Gambardello specifically cautioned traders against “writing off” Cardano as ADA approaches a possible breakout.

Dan Gambardello chart of cardano
Dan Gambardello chart of Cardano

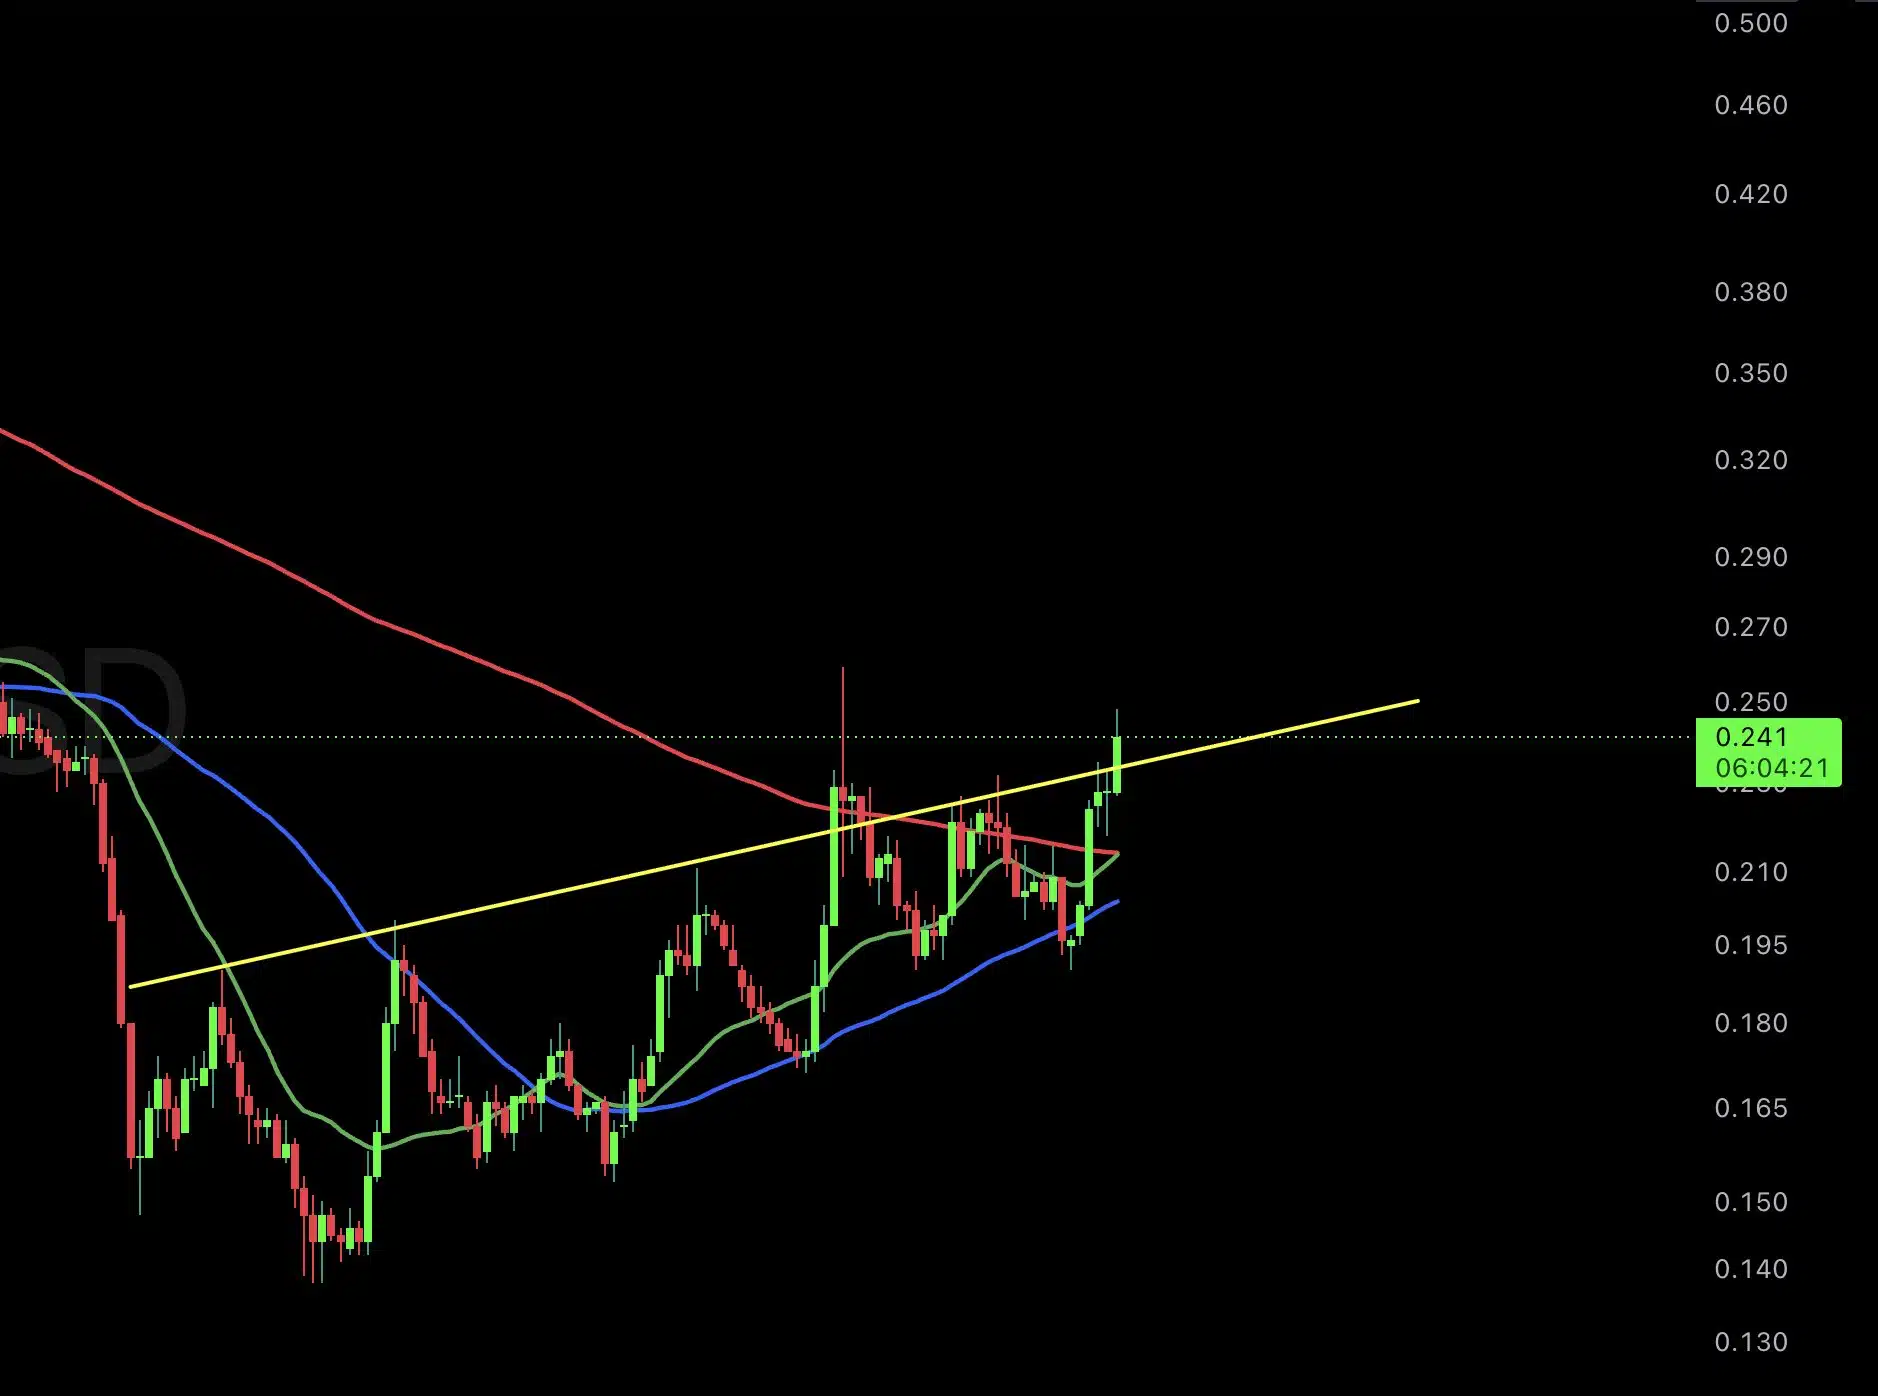
According to him, ADA could reach $0.40 “in an instant” if it escapes its current technical structure. His comment highlights the importance of the resistance levels ADA is currently testing and the possibility of a stronger rally if the token breaks above them.

The accompanying chart shows ADA trading around $0.241 while testing an ascending yellow trendline that has recently acted as resistance. Recent candles have moved above the trendline, suggesting that buyers are attempting to push the token into a stronger position above this level. 

ADA Builds Recovery Structure

Meanwhile, ADA has recovered significantly from its recent low near $0.14 and has formed a series of higher lows. The blue moving average has also turned upward and remains below the current price, indicating that short-term momentum has improved.

Nonetheless, ADA still faces resistance from the longer-term red moving average, which continues to trend downward from higher levels. Therefore, a sustained break above these resistance areas could play an important role in determining whether ADA can extend its recovery.

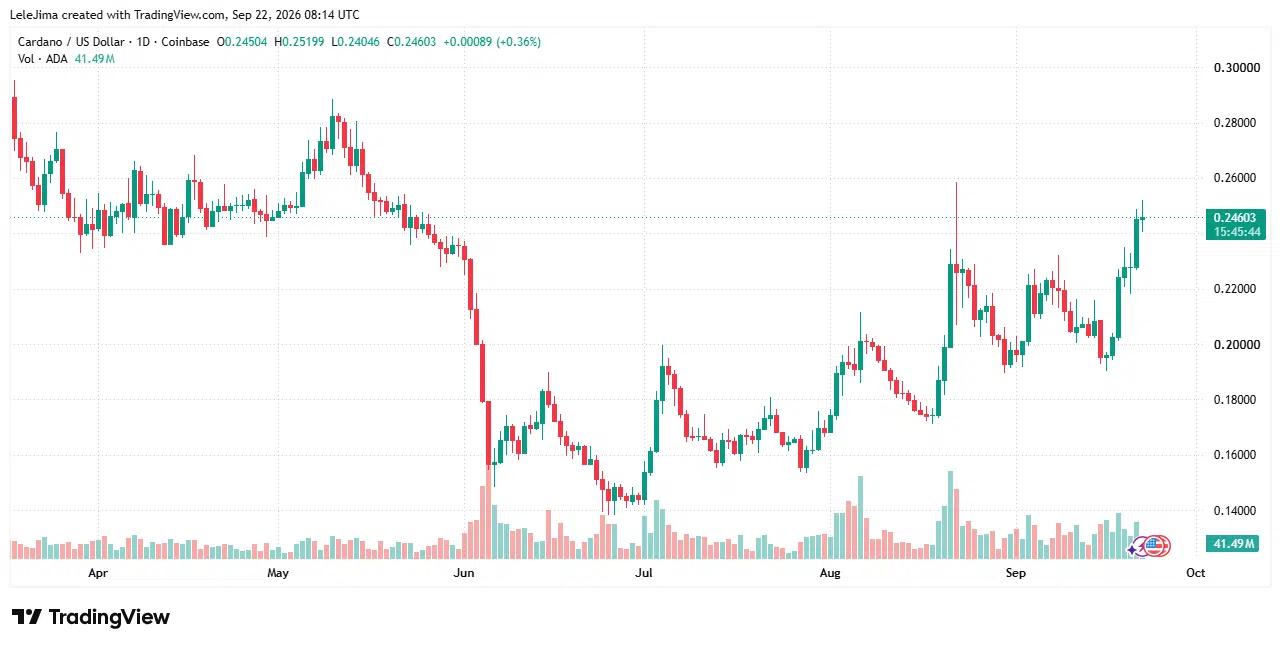
At its current price of $0.24603, ADA requires a surge of 62.58% to reach the $0.40 target highlighted by Gambardello. Notably, ADA last traded around the $0.40 level in January 2026 before losing ground. 

ADAUSD 2026 09 22 09 14 17

Gambardello Still Holds ADA

Gambardello’s latest comments also stand out because he previously reduced his Cardano exposure during the governance crisis that affected the ecosystem in June 2026.

At the time, he disclosed that he had moved part of his ADA holdings into Sui. Although he has since liquidated some of his Cardano position, Gambardello confirmed that he remains an ADA holder. However, the exact size of his current ADA holdings remains unknown.

Meanwhile, Cardano continues to retain much of the gain from yesterday’s broader market rally. ADA is currently up 5.63% over the past 24 hours, with its market cap rising by a similar percentage to $9.02 billion.

With this valuation, ADA ranks as the 14th-largest cryptocurrency by market capitalization on CoinMarketCap. Whether it can sustain the current recovery will depend in part on its ability to overcome the resistance levels highlighted in Gambardello’s analysis.

Hoskinson Says He Is One of Largest ADA Holders, Calls for Unified Platform for 1.4M Cardano Stakers

0

Cardano founder Charles Hoskinson has stated that he is one of ADA’s largest holders. 

Hoskinson reiterated his commitment to Cardano during a recent AMA session while responding to questions from the community. He described Cardano positively and emphasized that he remains heavily invested in the ecosystem. Specifically, Hoskinson highlighted the size of his ADA holdings, confirming that he remains one of the largest holders of the token.

Although Hoskinson has repeatedly described himself as one of ADA’s largest holders, he has not disclosed the exact number of tokens he owns. For context, Cardano’s initial token distribution raised over $60 million between 2015 and 2017. However, the amount of ADA allocated to Hoskinson from that distribution remains undisclosed.

Insight Into Hoskinson’s Holdings

Nevertheless, Hoskinson has previously provided some insight into the scale of his ADA holdings. Earlier this year, he disclosed that he had incurred more than $3 billion in losses as ADA declined sharply from its all-time high.

ADA reached a peak of $3.10 during the 2021 bull market. The token has since fallen more than 90% from that peak, with ADA trading around $0.24 at the time of the commentary.

Despite the substantial decline, Hoskinson continues to identify himself as one of the largest ADA holders, reinforcing his stated long-term commitment to the Cardano ecosystem.

Calls for Greater Community Coordination

Meanwhile, Hoskinson addressed another issue involving Cardano’s global community. While answering a user who asked what advice he would give his younger self five years ago, he highlighted the size of Cardano’s staking community.

According to him, around 1.4 million people stake ADA globally. However, he questioned why these participants do not have a more unified communication platform on services such as Discord or Telegram.

Instead, he argued that Cardano’s communication channels remain fragmented across numerous communities and platforms.

Proposed Dedicated Discord Server for Cardano Community

Hoskinson has previously proposed moving core community and governance discussions away from X and into a dedicated Discord server. Under the proposed structure, separate channels would accommodate different topics while stronger moderation would aim to limit hostility, misinformation, and disruptive behavior.

However, the proposal has also drawn criticism from some community members and crypto enthusiasts. Critics have raised concerns that extensive moderation could limit legitimate criticism or create censorship concerns.

Supporters of the proposal, meanwhile, argue that a dedicated platform could provide Cardano participants with a more organized environment for constructive discussions. They contend that greater coordination could also make it easier for community members to participate in ecosystem and governance conversations. 

Meta Stock Jumps 11% as Muse AI Traction Builds Ahead of Connect

0

Meta Platforms (NASDAQ: META) shares surged 11.34% on Monday to close at $741.25 as investors reacted to strong early adoption of the company’s new Muse personal AI agent ahead of Meta Connect later this week.

The stock gained $75.50 during the session and traded between $679.60 and $753.00 on volume of about 48.72 million shares, according to Yahoo Finance. That compared with Friday’s $665.75 close.

The broader technology sector also advanced Monday, with the Nasdaq Composite gaining 2.26% and the S&P 500 rising 1.49%. Reuters reported the Nasdaq closed at a record high amid strength across AI-linked stocks.

Muse Adoption Accelerates After U.S. Launch

Meta launched Muse in the U.S. on Sept. 8 as a personal AI agent designed to complete tasks including sending emails, booking travel, filling out forms, and making purchases with user approval.

The product is available through a standalone app and WhatsApp and runs on Meta’s Muse Spark models.

Wells Fargo, citing Sensor Tower data, said U.S. Muse downloads reached a record 264,000 on Sept. 19, marking the third consecutive day above 200,000 downloads. U.S. daily active users reached 448,000 on Sept. 18, 10 days after launch.

Meta said Muse is free for most use, with subscription plans for customers seeking greater access.

The rollout comes as Meta continues to increase spending on artificial intelligence infrastructure.

Meta reported second-quarter revenue of $60.8 billion, up 28% year over year, while capital expenditures reached $31.08 billion during the quarter.

The company expects full-year 2026 capital spending of $130 billion to $145 billion as it expands infrastructure supporting AI and its core businesses.

Wells Fargo Raises Meta Price Target to $796

Wells Fargo analyst Ken Gawrelski raised the firm’s Meta price target to $796 from $640 on Monday while maintaining an “Overweight” rating.

The brokerage kept its revenue estimates unchanged but increased the valuation multiple applied to its 2027 earnings forecast, citing progress in Meta’s AI products and signs of a new product cycle.

Wells Fargo valued the shares at 25 times its 2027 earnings-per-share estimate, up from 20 times previously.

Wells Fargo also cut its 2026 operating-income estimate by 12%, primarily reflecting Meta’s expected approximately $10 billion third-quarter legal charge tied to its agreement with state attorneys general, while trimming its 2027 and 2028 operating-income estimates by about 1%.

Separately, ARK Invest disclosed purchases totaling 51,477 Meta shares across its ARKK, ARKW and ARKF exchange-traded funds on Monday, worth about $34.3 million based on the reported trade data.

Meta Connect Scheduled for Sept. 23-24

Meta Connect is scheduled for Sept. 23-24.

Meta’s developer site confirms that CEO Mark Zuckerberg will participate in the keynote and that the event will cover developments in AI technologies, AI glasses, virtual reality, and Meta Horizon.

Wells Fargo expects the company to discuss early Muse usage and demonstrate additional functionality around Muse and its underlying models.

Muse Faces Growing Competition and Platform Constraints

Meanwhile, OpenAI is also developing additional personal AI assistant features, according to The Information, amid increasing competition in AI agents capable of carrying out multistep digital tasks.

Muse has also faced restrictions from some third-party platforms. 

Amazon has blocked the agent from making purchases on its platform, while Shopify has moved toward integration with Muse through its commerce infrastructure, according to reports. 

Separately, security researcher Patrick Wardle disclosed a local vulnerability in Muse’s macOS app that allows malware already running as the logged-in user to redirect Muse’s dictation traffic, potentially exposing prompts, injecting instructions, and obtaining authentication material associated with the agent. The reported flaw does not allow a remote attacker to compromise an otherwise clean Mac.

METAB Also Moves Higher

Meta’s tokenized bStock (METAB), a third-party tokenized security issued by BTech Holdings Limited that provides economic exposure to Meta shares, also moved sharply overnight.

METAB was trading at $743.92 at 3:27 a.m. ET, up 9.12% over the past 24 hours, according to CoinMarketCap. Its 24-hour trading volume rose 52.92% to $4.62 million.

With about 5,000 METAB tokens in circulation, the tokenized stock had a market capitalization of approximately $3.98 million.

The issuer says bStocks are backed by corresponding underlying equities and can be traded around the clock. The products provide economic exposure rather than direct ownership of Meta shares.