Peter Brandt Shares Long-Term XRP Chart with his XRP price prediction.
Veteran trader Peter Brandt has shared a long-term XRP chart that identifies $5.40 as a potential future price level, while making clear that publishing a market projection is separate from documenting an actual trade.

Brandt posted the monthly XRP/USD chart on September 21, stating that the technical structure shown on it implies a move toward $5.40 over the longer term. He did not provide a date or specific timeframe for XRP to reach that level.
The chart covers roughly a decade of XRP price action and displays several major market cycles. It includes a long-term ascending support line extending from previous cycle lows and a descending resistance line connecting major highs.
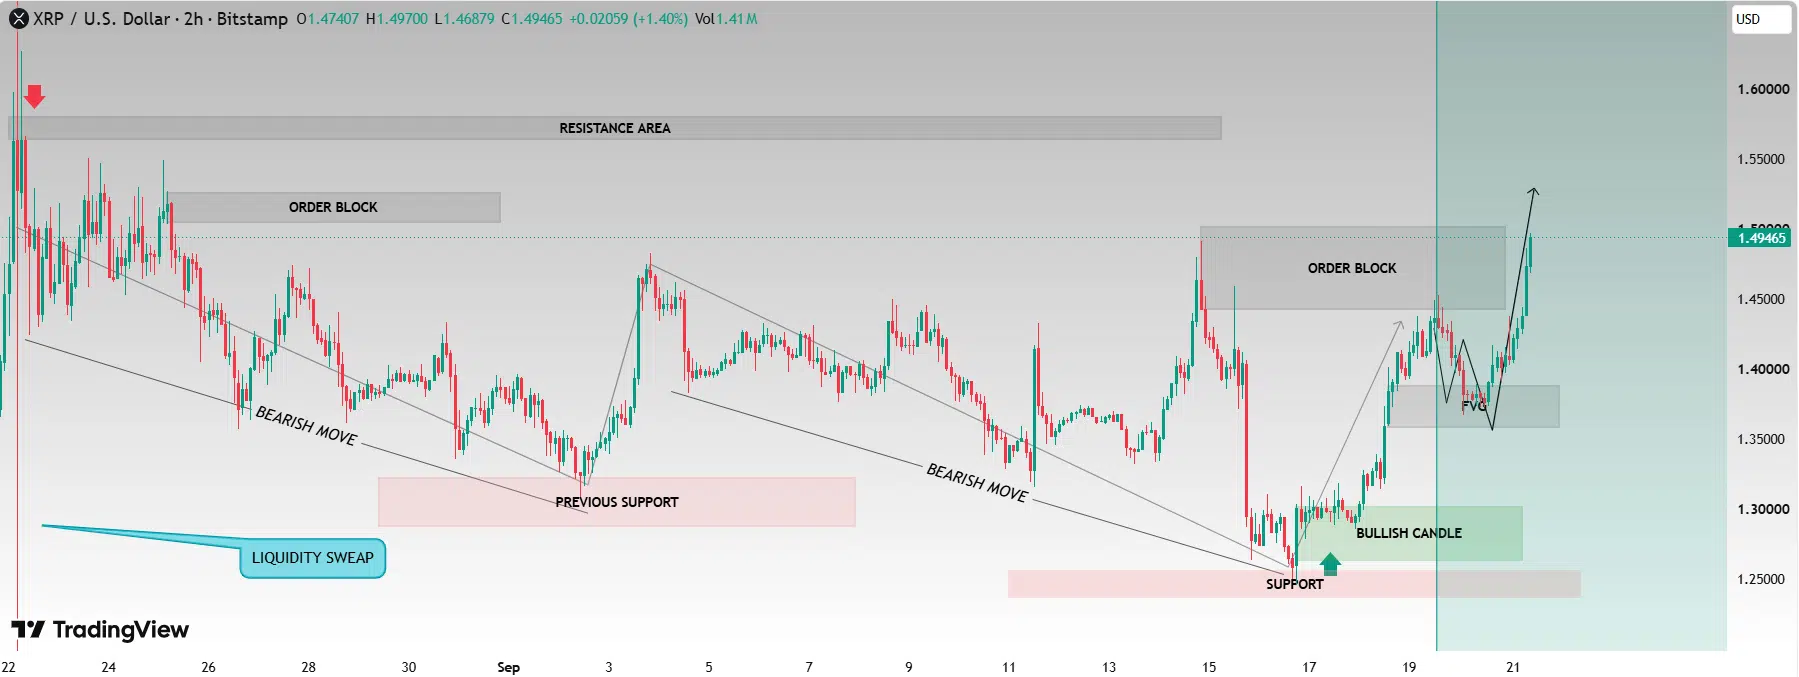
At the time shown on the uploaded chart, XRP was trading around $1.49, while an 18-month moving average was positioned near $1.88. The chart also shows XRP’s advance above $3 during 2025 followed by a correction into 2026.
XRP Would Require a 251% Increase From $1.54
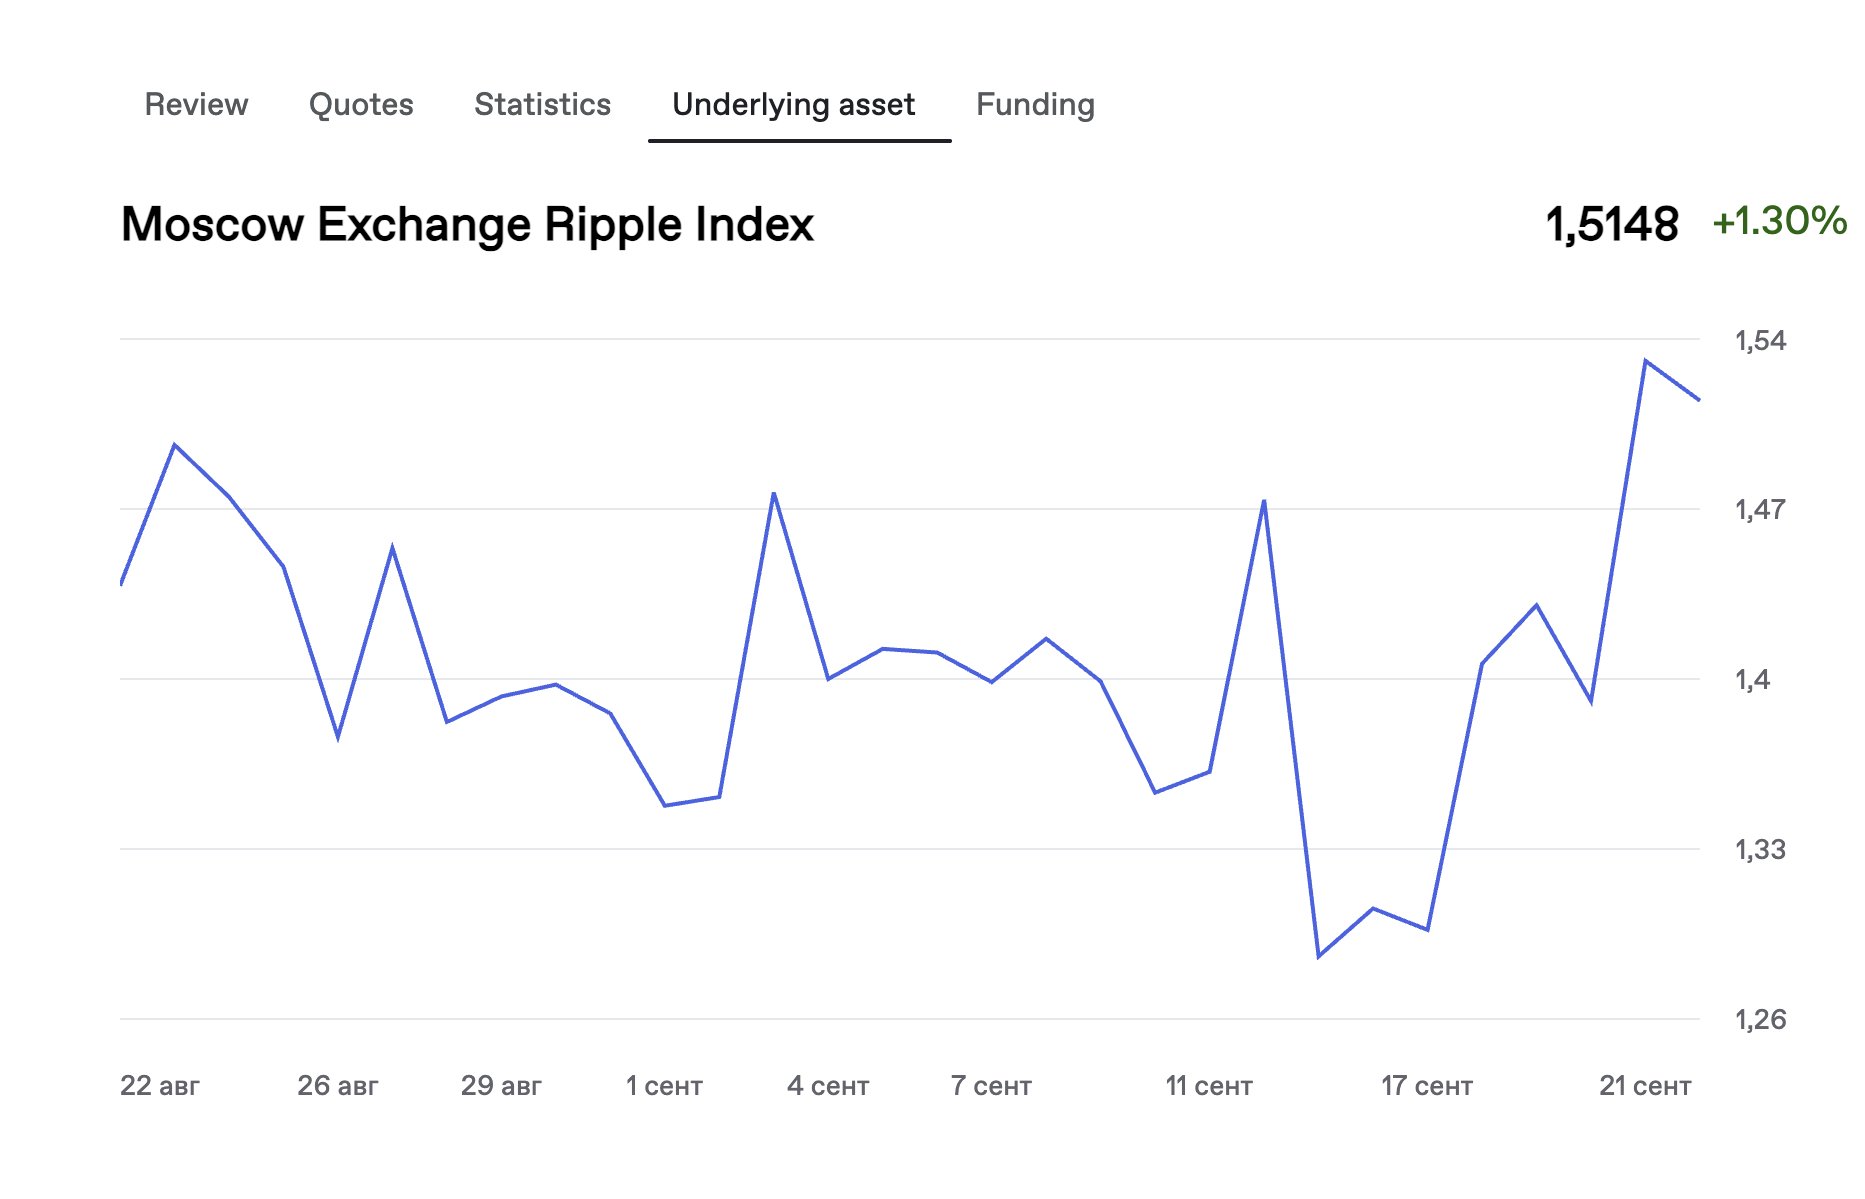
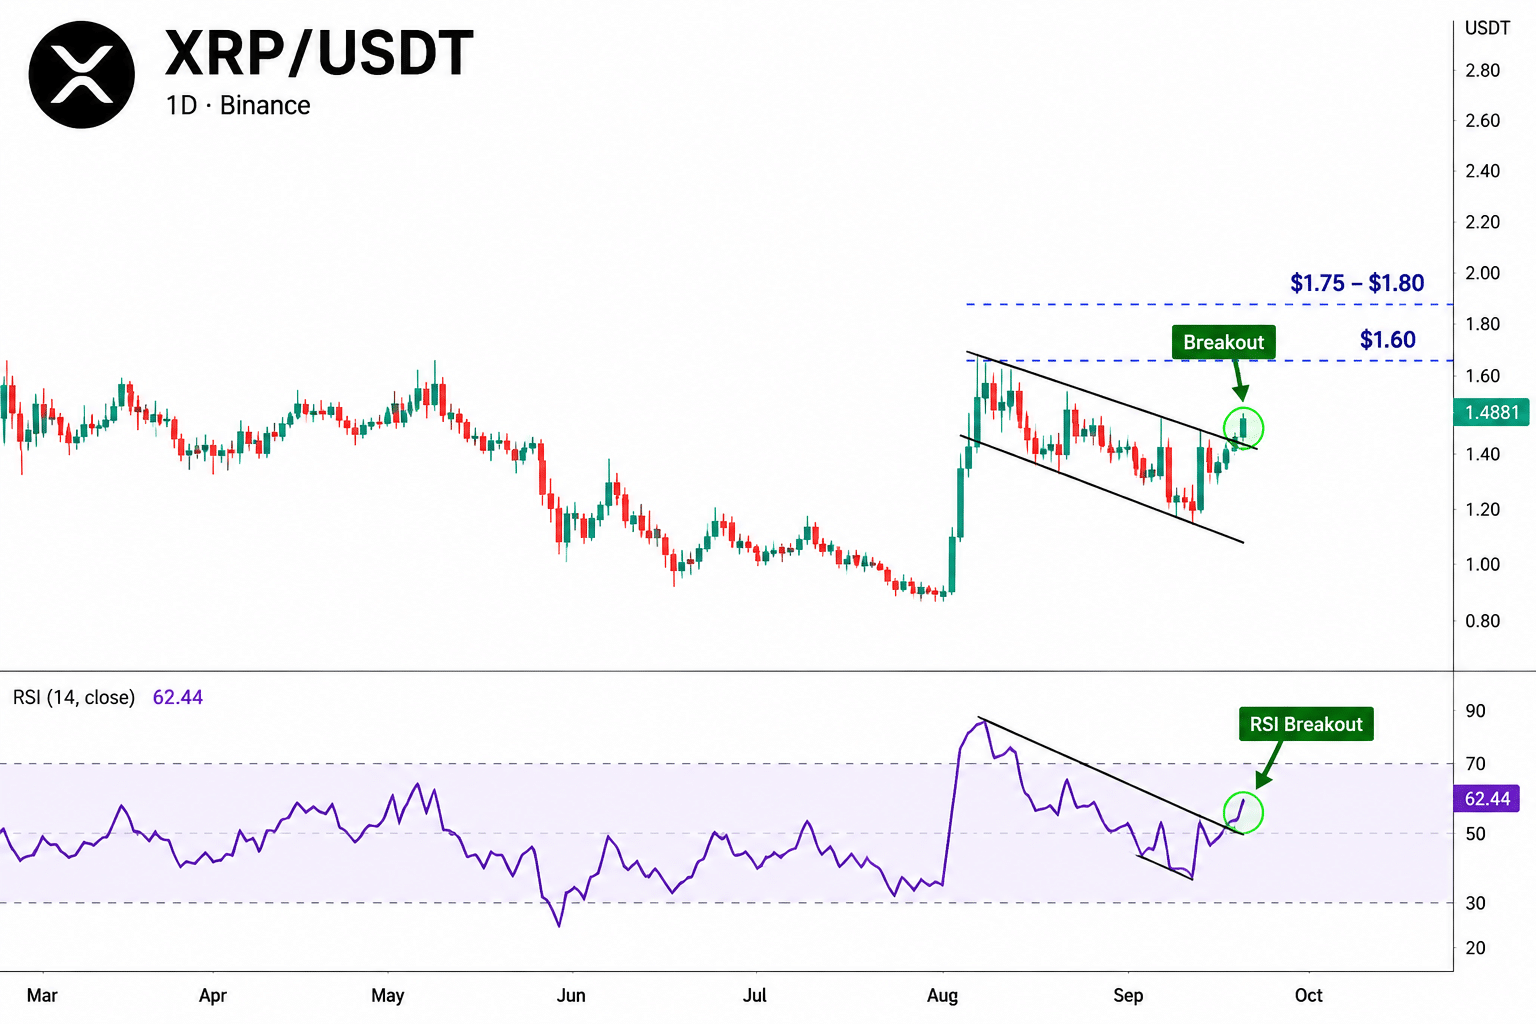
XRP was reported near $1.54 after gaining approximately 8.7% over 24 hours around the time Brandt’s chart received attention.
Using $1.54 as the reference price, XRP would need to increase by approximately 251% to reach $5.40. In price-multiple terms, $5.40 is about 3.5 times $1.54.
The $5.40 figure represents a technical projection derived from Brandt’s long-term chart rather than a price that XRP has already reached or a target accompanied by a stated completion date.
Detailed Brandt Chart Analysis
In his monthly XRP/USDT chart, Brandt is analyzing the multi-year structure rather than a short-term trading setup. The chart runs from roughly 2015 through September 2026 and uses a logarithmic-looking price scale. The latest displayed price is approximately $1.49.
What the long-term structure shows
The first major section is the 2017–2018 expansion. XRP emerged from its 2015–2016 base and accelerated sharply during 2017, eventually producing the large 2018 peak visible on the chart. That peak forms the starting point of Brandt’s long-term descending resistance line.
XRP then entered a prolonged contraction from 2018 through 2020. Monthly candles progressively moved lower and eventually established the major low area around 2020.
The 2021 advance created another major peak, but that high remained below the 2018 extreme. Connecting the 2018 and 2021 highs produces the downward-sloping dotted resistance line. In classical chart terms, this records a sequence of declining major cycle highs.
At the same time, XRP’s 2020 low and subsequent lows form a rising dotted support line. The descending upper boundary and rising lower boundary therefore created the enormous multi-year compression visible in the middle of Brandt’s chart.
The important change occurred in 2024–2025
XRP eventually moved out of that multi-year compression and advanced sharply into 2025. The monthly candles reached approximately the $3–$3.50 region, producing the highest sustained trading area on this chart since the 2018 cycle.
Brandt has drawn a horizontal line around the 2025 highs. That line is important because the market repeatedly stopped in roughly the same upper region rather than continuing directly higher.
After the 2025 peak, XRP began correcting.
The right side of the chart shows this correction developing inside a small downward-sloping channel/wedge. This is much smaller than the decade-long structure and represents the current consolidation following the 2024–2025 advance.
Where XRP stands now
The chart’s September 2026 reading is approximately $1.4901.
The orange 18-month moving average is around $1.877, meaning XRP is presently trading about 20.6% below that longer-term average.
That is one of the clearest features of the current monthly setup: XRP remains below the 18-month average while trading inside the declining structure drawn from its 2025 highs.
There is also a faster-moving average shown in gray. Price is interacting more closely with that shorter average, while the orange 18-month average remains overhead.
What Brandt’s $5.40 projection means
Brandt’s statement that the chart “implies an eventual advance to $5.40” needs to be read in the context of this monthly structure.
The $5.40 level is not actually printed on the screenshot as a horizontal target. Rather, it is the price objective Brandt says he derives from the long-term formation.
Using the chart’s current $1.49 price, $5.40 would represent approximately:
$1.49 → $5.40 = +262%, or about 3.6× the current price.
Using the roughly $1.54 market price cited when his comments were reported, the required increase is about 251%.
Importantly, Brandt used the word “eventual.” No completion date is supplied by this chart.
ADX and ATR
The lower indicators provide additional information.
ADX (14) is 27.59. ADX measures trend strength rather than whether the trend is bullish or bearish. A reading above roughly 25 indicates that the current monthly movement has developed measurable trend strength. Direction itself has to be determined from price, and the recent price structure is still a correction from the 2025 highs.
30-month Average True Range is approximately 0.6126. That means XRP’s long-term monthly trading ranges remain large relative to its current $1.49 price. ATR measures movement/volatility, not direction.
Latest five monthly candles
The final five candles are particularly useful.
They sit primarily within the small descending structure. Several have lower wicks, showing that prices below the candle bodies attracted buying during those months. At the same time, upper wicks and repeated failures to sustain moves toward the upper boundary show continuing supply at higher prices.
The latest candle is stronger and has pushed price back toward approximately $1.49, but it remains beneath the orange 18-month moving average near $1.88.
So the sequence shown directly on Brandt’s chart is:
2015–16 base → 2017 explosive markup → 2018–20 markdown/base →
2021 expansion → 2022–24 multi-year compression → 2024–25 breakout/markup →
2025–26 correction and consolidation.
From a Wyckoff-cycle perspective, the current monthly structure is a corrective/consolidation phase following the 2024–25 markup, rather than a fresh completed markup leg.
Brandt’s $5.40 figure represents the longer-term upside implication he assigns to the broader structure; the chart currently shows XRP at about $1.49, below its $1.88 18-month moving average, and still working through the smaller declining structure on the far right.