Home Blog Page 1047

Multiple Analysts Agree XRP Following 2017 Trend, Forecasting 4,250% Surge

0

Multiple analysts have observed that XRP is closely mirroring its 2017 patterns, suggesting a promising future for the asset.

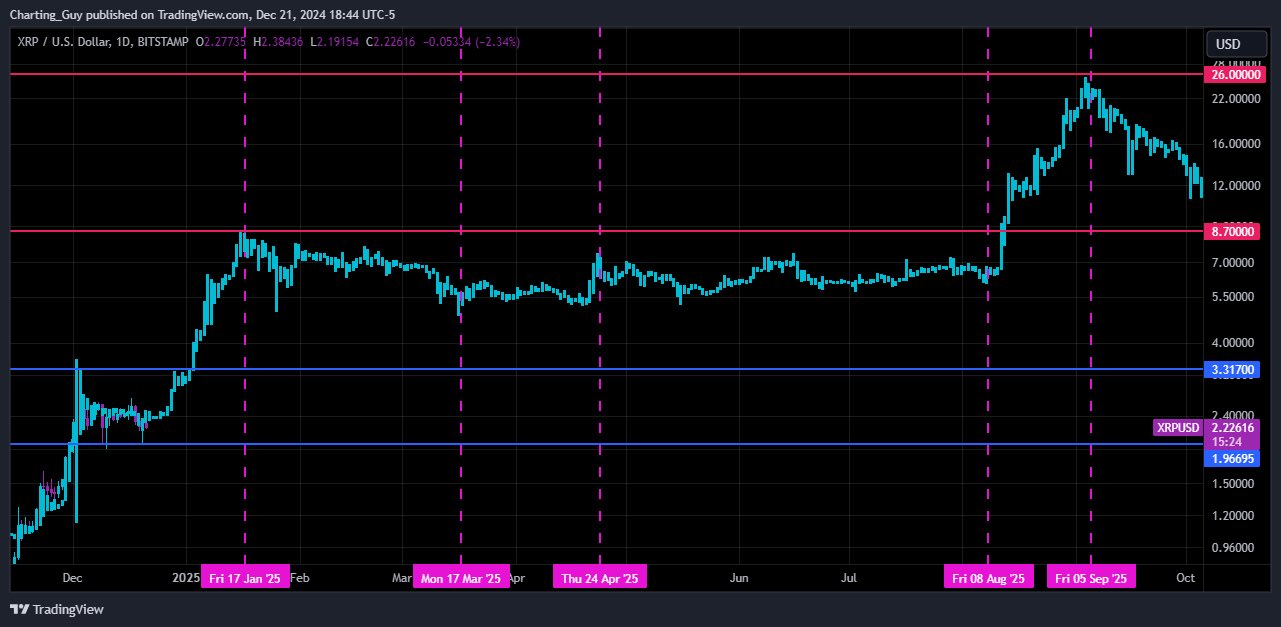
One such analyst, Charting Guy, a widely followed technical expert, has highlighted key pivot dates in XRP’s 2017 fractal.

According to him, if XRP continues to follow the same trajectory it has since last month, it could reach a new all-time high on its next leg up. He speculated that this could happen as early as January, less than two weeks away.

XRP Now vs. 2017

Notably, XRP’s historic bull run in 2017 gained momentum between November and December, with the asset establishing its all-time high by the first week of January. During this period, XRP surged from $0.1838 to $3.84, representing a massive increase of 1,989% over ten weeks. 

In comparison, from November to December this year, XRP has already risen by 491%, from $0.49 to $2.90. Currently, XRP is in a consolidation phase, with market analysts anticipating a major breakout toward a new all-time high.

Bold Projections for XRP Based on 2017 Patterns

Crypto Vilian, a market analyst from Cambridge, has also identified promising signs for XRP based on 2017’s market structure. He pointed out the sequence of a bearish decline, recovery, consolidation, and a subsequent breakout that mirrors the current situation with XRP.

His chart suggests that, when the bulls return, XRP could attain a $1.05 trillion market cap. This lofty market cap corresponds to a floor price of around $17 for XRP.

Image
XRP chart by Crypto Vilian

However, Vilian noted that this optimistic outlook depends heavily on Bitcoin’s performance. He further identified potential price levels between $8 and $13 for XRP, with the possibility of a three-fold price surge if the asset breaks through this range.

Forecast for XRP 4,250% Surge to $100+

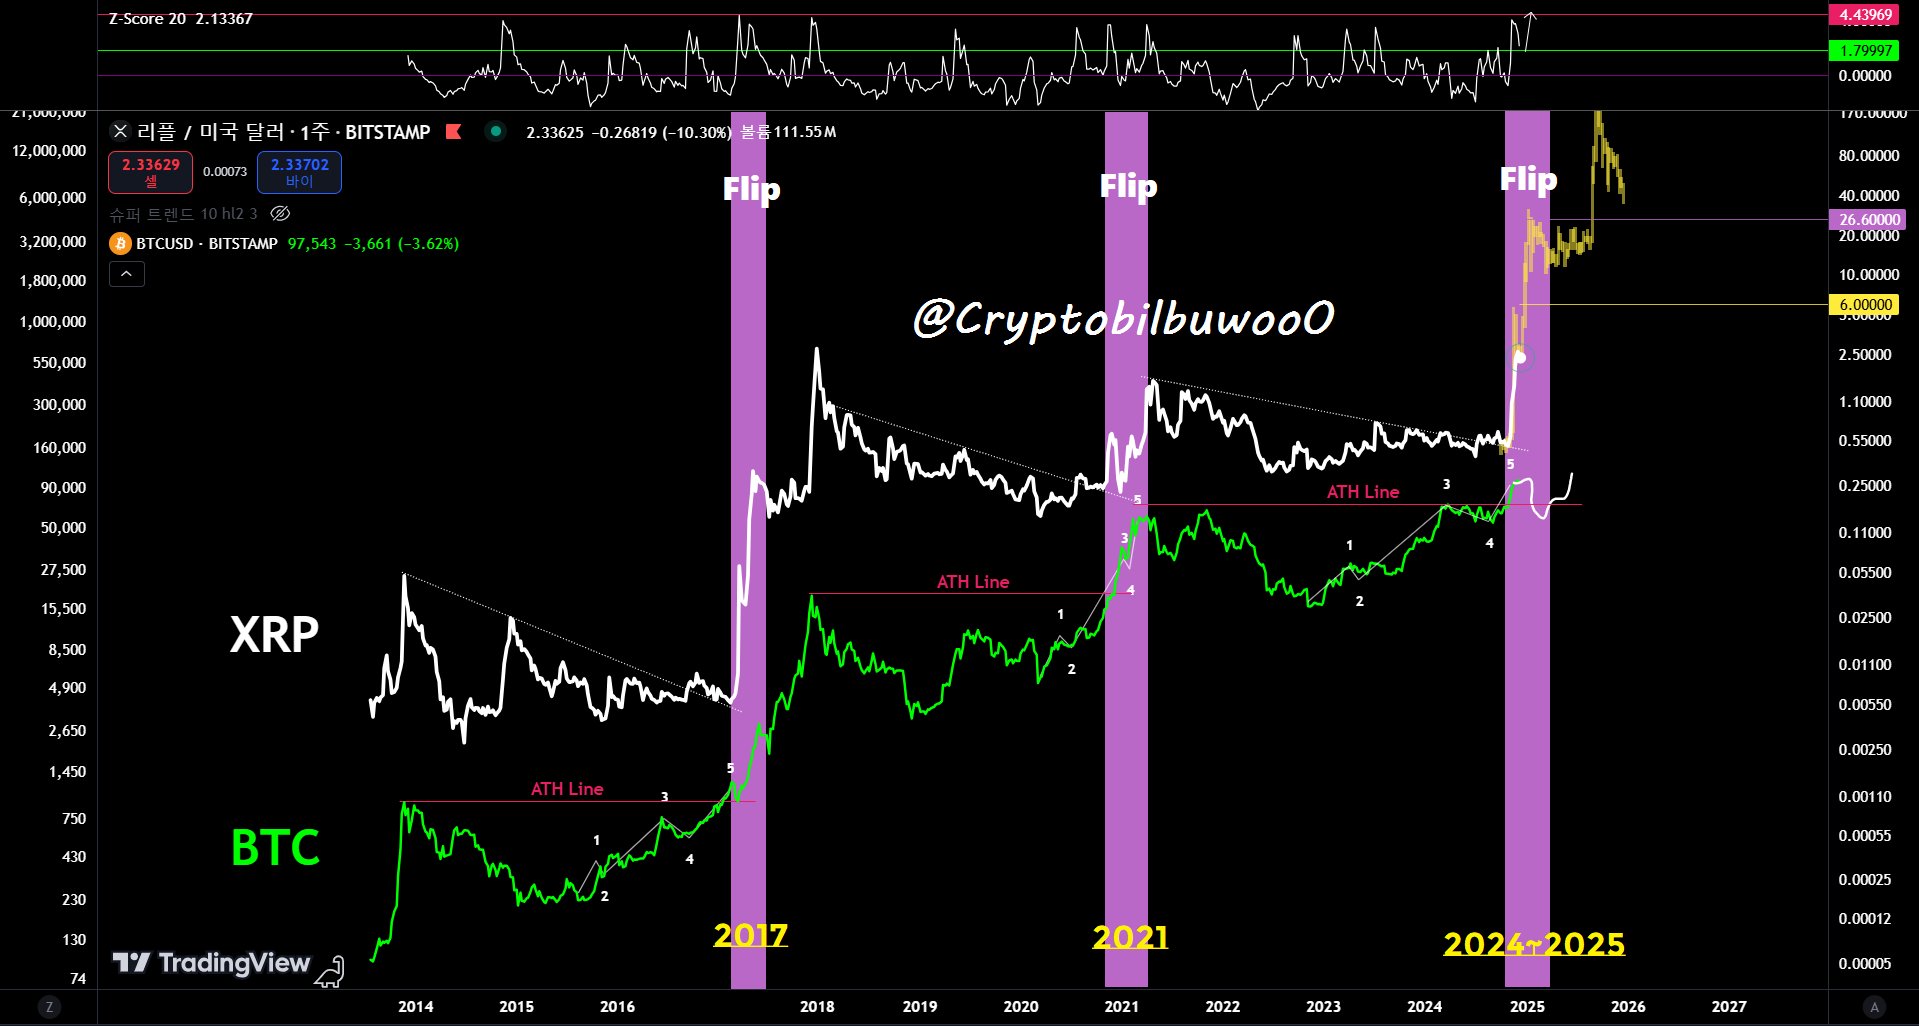
Meanwhile, analyst Crypto Bilbuwoo has proposed an even more ambitious target. While other analysts take a more conservative approach, Bilbuwoo’s chart predicts a scenario where XRP follows the 2017 trend, with initial peaks around $26, followed by a correction.

After that, the asset could soar above $100, according to his chart.
XRP
Image Source: https://x.com/Cryptobilbuwoo0/status/1870572549027062161

At press time, XRP is trading at $2.13. Attaining above $100 demands a growth of over 4,250%.

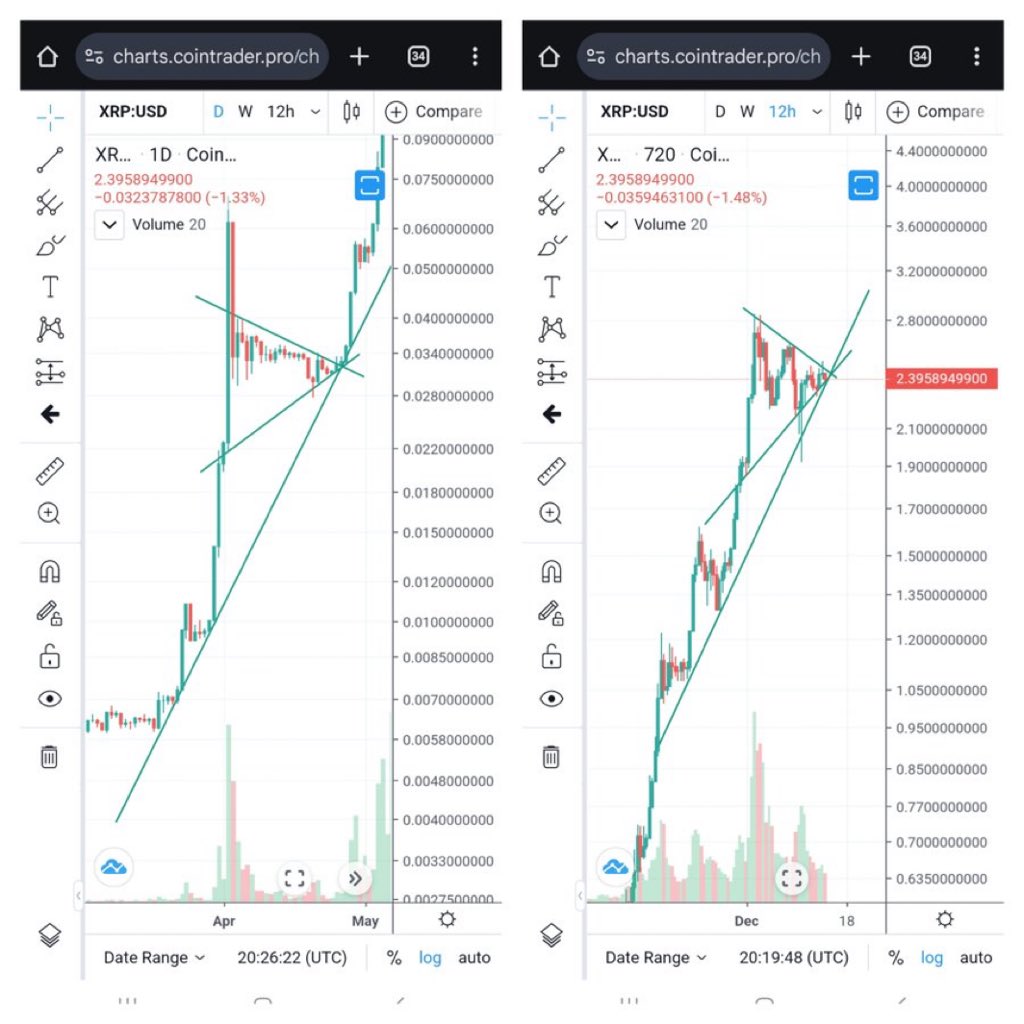
The Charting Guy suggests that XRP’s current price movement closely resembles its behavior during the 2017 bull market. Based on this fractal pattern and key pivot dates from 2017, he predicts that if XRP continues to follow this trend, it could reach a new all-time high during its next upward movement, expected later in January 2025.
XRP
Image Source: https://x.com/ChartingGuy/status/1870616624472244494

The below-mentioned chart below shows the similarities between the 2017 and 2024 XRP price movements.
XRP
XRP 2017 Vs. 2024

However, This more extreme projection has faced criticism. Some critics argue that XRP should first break its seven-year all-time high before considering such lofty price targets. 

“People posting charts like this showing $100+ have no idea how markets work. That would take years if it ever happens,” said X user Daniel G. 

420,000 BTC Remain Unaccounted For as Whales Use Privacy Transactions to Accumulate Bitcoin

0

Privacy transactions on the Bitcoin network have skyrocketed over the past two years.

Whales actively use methods like CoinJoin to discreetly accumulate large amounts of Bitcoin. CryptoQuant’s Ki Young Ju highlighted this trend in a tweet. According to the update, the annual average number of CoinJoin transactions has tripled since 2022.

Massive Spike in Bitcoin CoinJoin Transactions

CoinJoin transactions are a method to enhance anonymity by mixing multiple Bitcoin transactions. They have become a preferred tool for large-scale investors, as evidenced by the fact that CoinJoin transactions under 5K were the norm as of December 2022.

However, by December 2023, CoinJoin transactions surged to nearly 40K. The trend continued into 2024, with the average number of transactions remaining around 20K. This development suggests a growing priority on privacy as institutional and individual investors move large amounts of BTC.

Image
Chart of Bitcoin CoinJoin Transactions

Whales Accumulating BTC Discreetly

The spike in privacy transactions coincides with significant whale activity in 2024. Specifically, Young Ju highlighted that 1.55 million BTC flowed into accumulation addresses this year. These addresses are primarily associated with entities such as exchange-traded funds (ETFs), firms like MicroStrategy, and custodial wallets.

Indeed, U.S. Bitcoin ETFs have accumulated over 1.1 million BTC since January, exceeding the holdings of Satoshi Nakamoto. At the same time, MicroStrategy has significantly increased its holdings, now owning over 444,000 BTC.

While some of this accumulation is driven by institutional players, a substantial portion remains in the hands of unidentified whales. Specifically, Ju noted that entities have moved between 240,000 and 420,000 BTC have been to unknown entities.

This has sparked speculation about the identity and intentions of these entities. Nonetheless, this trend confirms the rising adoption of Bitcoin by institutional investors, seeking ways to move funds without drawing attention.

However, not all privacy transactions are above board. Some analysts believe the rise in CoinJoin activity may be due to hackers laundering stolen funds.

Meanwhile, Ju cited Chainalysis reports revealing total hacking-related losses of $2.2 billion in 2024. This figure represents just 0.5% of Bitcoin’s $377 billion in realized market cap inflows.

Ultimately, the surge in privacy transactions highlights how whales and institutions are increasingly prioritizing discretion, whether for strategic purposes or to navigate regulatory scrutiny.

Solana Sustains Capital Inflow Since September 2023, Hitting a Daily Peak of $776M This Year

0

Solana has maintained a trend of daily positive capital netflow over the past year, outpacing Bitcoin and Ethereum in price performance.

Particularly, Solana has experienced a consistent influx of capital since September 2023, reaching a peak of $776 million in daily inflows this year, according to blockchain analytics firm Glassnode. 

Solana Sees Capital Influx Despite ETF Absence

This growing liquidity has contributed to Solana’s impressive price appreciation, with the crypto asset rising over 2,143% from its November 2022 low of $9.64, a price point it revisited on the back of the contagion from the FTX implosion.

Solana Capital Influx Glassnode
Solana Capital Influx | Glassnode

Despite the absence of Solana exchange-traded funds (ETFs), SOL has managed to attract substantial investment. In contrast, Bitcoin and Ethereum have benefited from the introduction of spot ETFs, which have triggered greater institutional investment and contributed to their market growth. 

For instance, the approval of spot Bitcoin ETFs earlier this year led to impressive capital inflows, with investors injecting $36 billion into these funds, accumulating assets of about $110 billion. 

However, the U.S. Securities and Exchange Commission (SEC) has been hesitant to approve spot Solana ETF applications. The Crypto Basic confirmed that the SEC plans to reject filings from multiple asset managers seeking to launch such products. 

Notably, this stance is possibly due to regulatory uncertainties and concerns over investor protection. Despite facing regulatory hurdles, Solana has shown impressive growth and resilience. 

Since its November 2022 cycle low, the cryptocurrency has outpaced Bitcoin and Ethereum in price gains. According to Glassnode’s data, Solana outperformed Bitcoin and Ethereum in price movements on 344 of 727 days following the FTX collapse.

SOL BTC and ETH Price Performance Glassnode
SOL BTC and ETH Price Performance | Glassnode

SOL Has Room for Growth

Also, the capital inflows have driven a substantial rise in Solana’s Realized Cap, which reflects the total value of coins in circulation based on their most recent transaction prices. From January 2023 onward, Solana’s Realized Cap grew from $22 billion to an impressive $77 billion, representing a remarkable $55 billion increase in liquidity.

Solana Realized Cap by Age Glassnode
Solana Realized Cap by Age | Glassnode

Meanwhile, investor activity analysis shows that both short-term and long-term holders have contributed to profit-taking during this period. 

Coins held for periods ranging from one day to one week, one week to one month, and six months to one year have been contributors to sell-side pressure, each accounting for a substantial portion of realized profits. Nonetheless, this balanced distribution suggests that Solana appeals to a diverse investor profile.

Although profit-taking has occurred, Glassnode’s analysis shows that investors have yet to reach the unrealized profitability levels the market typically observes before long-term market peaks. This indicates that Solana’s value may have room to grow further in the ongoing market cycle.

Solana currently trades for $187.83, down 4.84% today after an impressive three-day performance that culminated in a run above $201 on Christmas Day. At this point, SOL needs to secure a full-body close above $200 to flip its momentum bullish.

Pantera Capital Issues Timeline for Bitcoin to Hit $117,000

0

Pantera Capital CEO Dan Morehead predicts Bitcoin could hit an all-time high of $117,000 by August 2025, marking the asset’s peak price for the 2024/2025 bull cycle. 

Morehead made the projection during a recent interview on the Bankless Podcast. During the interview, Morehead highlighted Bitcoin historical price alignment with the halving event occurring every four years. 

BTC Performance Before and After Bitcoin Halving

For context, Bitcoin’s price surged tremendously during the previous halving event, with the latest expected to follow a similar trend. The last halving occurred in April 2024, reducing miners’ rewards from 6.25 BTC to 3.125 BTC. 

Citing historical data, the Pantera CEO claims that the halving impact on Bitcoin’s price begins 400 days before the event. According to Morehead, the crypto market reaches the peak of a bull cycle around 480 days after the halving. 

Bitcoin to Hit $117K 

Based on Bitcoin’s historical price movements, Morehead forecasted that the premier cryptocurrency could surge to a peak of $117,000. He expects Bitcoin to clinch the target by August 2025, exactly eight months from now. 

Besides the anticipated rally accompanying Bitcoin halving, Morehead expects factors, such as macroeconomic and favorable political developments, to pave the way for Bitcoin’s potential surge to $117,000. The $117,000 target represents a surge of 22.53% from its current price of $95,484. 

Bitwise CIO Cites Condition for Bitcoin Potential Surge to $500K 

It is worth noting that Bitcoin has recently welcomed more ambitious predictions. Last week, Matt Hougan, CIO of digital asset manager Bitwise, predicted that Bitcoin’s 2024 rally would extend into next year, projecting that the firstborn crypto asset would reach a peak price of $200,000 by then. 

The Bitwise CIO highlighted three factors that could push Bitcoin to this target: spot Bitcoin ETF inflows, growing institutional demand, and increased interest in BTC among countries. 

Furthermore, Hougan speculated that BTC’s price would soar to $500,000 if Donald Trump established a national Bitcoin stockpile. 

The U.S. President-elect disclosed this plan during the Bitcoin Conference earlier this year. Following Trump’s reelection last month, several Bitcoin proponents, including Hougan, have highlighted the proposal’s potential impact on Bitcoin’s price. 

According to Hougan, other countries might follow the U.S. to establish a national Bitcoin stockpile. Consequently, he expects Bitcoin to surge to around $300,000 to $500,000 if this initiative comes to fruition. 

Meanwhile, some countries, like Japan, are not interested in creating a national Bitcoin stockpile. As reported earlier, the Japanese government believes Bitcoin and other assets are not foreign exchange. It emphasized that creating a Bitcoin reserve could jeopardize the security of the country’s foreign reserve. 

Analyst Says It Is All Noise for XRP Until One of These Two Things Happens

0

A notable market analyst provides two crucial XRP levels to watch, insisting that anything in between is all noise.

XRP’s bullish momentum has stalled at levels above its 2021 top of $1.96. The XRPL native token surged past the peak amid a November uptrend to $2.9097, posting an over 100% gain during the run.

However, since then, XRP has retraced 25%. Last week, the asset briefly retested below $2 amid a broader market retracement before rebounding to its current market price.

Amid the market uncertainties, market analyst Egrag Crypto has insisted it is all noise at the moment. In a recent commentary, the expert maintained that XRP’s reaction to two crucial price levels would reveal its next direction.

Two Crucial Levels to Watch

According to Egrag’s analysis, XRP will continue to trend within its current range until it breaks either the upper or lower boundary. The seasoned speculator mentioned in an earlier analysis that XRP has entered a micro range and will maintain a fluctuation between $2 and $2.9 until a confirmed breakout.

Meanwhile, Egrag suggested that a break below $2 would ensure lower prices for XRP. The analyst’s chart shows that if it loses this level, XRP will target $1.64 and probably $1.3700, as another commentator, Dom, speculated.

Furthermore, Egrag inferred that a push past $2.65 would spur a bullish breakout. From there, XRP could surge to higher prices like $3 and $5, as other analysts expect.

XRP Ready to Explode

Additionally, market analyst and community figure Gordon insists that XRP is ready to explode despite the recent downtrend. He tweeted that XRP’s chart is currently one of the most bullish in the crypto market.

In an accompanying XRP/USD 12-hour chart, he shared that XRP is currently forming a symmetrical triangle. The analyst mentioned that a breakout from the bullish pattern would catalyze a surge to a new all-time high.

XRP Analysis

Meanwhile, XRP trades at $2.1706, down 6% in the past 24 hours.

“Who Let the DOGE Out?” Elon Musk Shouts Out Dogecoin on Christmas Day

0

Tesla Chief and Dogecoin proponent Elon Musk gives a shout-out to the leading meme coin on Christmas Day.

From regular mentions to payment support for merchandise, the world’s richest man and Tesla CEO Elon Musk has long established himself as a champion of the popular doggy-themed meme crypto Dogecoin (DOGE). As such, it is no surprise that the billionaire did not miss the chance to shout out the popular crypto on Christmas day.

“Who Let the DOGE Out?”

Amid the Christmas festivities, Tesla CEO Elon Musk took time out to offer a Dogecoin mention with a play on the lyrics of Baha Men’s 2000 hit song “Who Let the Dogs Out.”

“Who let the DOGE out?” Musk wrote, captioning a photo of his dogs Gatsby, Marvin, and Floki in Christmas-inspired costumes in an X post on Wednesday, December 25.

But Musk’s DOGE shout-out did not end there as keen-eyed observers were quick to point out that the cape on Floki, a dog that has also inspired a successful meme coin of its own, was decorated with Dogecoin logos.

Many DOGE proponents and avid Musk followers are hopeful that the billionaire’s latest show of support will have bullish implications for the meme coin’s price. One observer pointed out that the last time the billionaire posted those words in reference to the meme coin, it went parabolic shortly after.

The post in question came up February 7, 2021. Besides an immediate price surge on the day, DOGE kicked off a parabolic rally to all-time highs of $0.73 roughly two months after in a run many have attributed to Musk’s unrelenting support and influence.

There is no clear indication that such a rally is imminent as DOGE trades 5% lower on Thursday, December 26, at $0.3162. Over the past month, however, analysts have continued to predict higher prices for the asset, arguing that it is replicating its price action from the 2017 and 2021 bull cycles.

While most DOGE proponents are okay with Elon Musk’s support, the billionaire’s antics have previously attracted a class action lawsuit bringing market manipulation claims. The lawsuit was dismissed with prejudice in August 2024.

Ethereum Bearish Signals Worsen as Genesis Whale Offloads $14.5M ETH

Ethereum shows bearish signals below $3,500 as the Adam & Eve pattern fails. Can Ethereum hold its support levels at $3,392 or $3,244?

As Bitcoin fluctuates under the $100,000 mark, Ethereum shows signs of weakness in its bullish trend. Will the biggest altcoin in the market face an extended pullback heading into 2025?

ETH price Analysis

As our previous Ethereum Price Analysis mentioned, the reversal from the 100-day EMA challenged the $3,500 resistance level. The short-term rounding-bottom reversal, forming the Adam and Eve pattern, has now entered a consolidation range.

The neckline of this bullish pattern coincided with the $3,500 psychological level and the supply zone extending from $3,520 to $3,568. After multiple price rejections in the 4-hour chart, the growing bearish influence suggests a breakdown of the consolidation range.

Ethereum Price Chart

Currently, Ethereum is trading at $3,431, reflecting a pullback of 1.79% over the last 24 hours. Amid the reversal, the 4-hour chart shows a potential death cross, which indicates increasing bearish momentum.

Additionally, a negative crossover between the 100 and 200 EMA lines could be on the horizon. The 4-hour RSI line has also dropped below the midpoint after moving sideways, reflecting an increase in selling pressure.

Whale From Genesis Era Continues to Offload ETH

As technical signals turn bearish, an Ethereum ICO whale offloaded 4,160 ETH tokens, valued at approximately $14.5 million. The whale chose Kraken as the exchange; the deposit occurred a few hours ago.

Notably, this whale received 20,000 ETH in July 2015, valued at $6.2K at that time. After staking the received tokens for rewards, the whale sold ETH during previous bullish peaks and still holds 7,943 ETH, worth $24.6 million at current prices.

Ethereum Price Targets

Technical indicators are flashing sell signals for Ethereum in the short term. Additionally, the failure of the Adam and Eve pattern highlights significant overhead supply.

As a result, Ethereum’s price is likely to test immediate support levels at $3,392 and $3,244.

On the flip side, if the broader market recovers, ETH could challenge the $3,500 supply zone again.

Analyst Says XRP Supply Shrinking, Predicts Next Big Move is ‘Only a Matter of Time’

0

Crypto analyst Steph points out that the total XRP supply is shrinking significantly while demand for the token remains high.

Steph cited data from the analytics platform CryptoQuant. The chart he shared depicted that XRP’s maximum supply of 100 billion is seeing a sharp decrease in recent years. In contrast to the decline in available supply, the price of XRP has been on a strong upward trajectory.

Accordingly, Steph suggested that demand for XRP is rising sharply. He asserted that the next price movement of XRP could be explosive and that it is only a matter of time before such an explosion occurs.

Notably, XRP has been in a bearish trend over the past three weeks, and this analyst used the token’s decreasing supply as a basis to argue for a major bull rally.

Is XRP Supply Really Shrinking?

However, it is important to note that while the shared chart depicted a strong declining pattern in XRP’s total supply, the actual figures tell a slightly different story.

In particular, out of XRP’s 100 billion supply, only 13,275,691 XRP, or 13.27 million tokens, have been destroyed and permanently removed from circulation. As a result, XRP’s total supply still stands at a staggering 99.986 billion tokens.

XRP supply CryptoQuant

This substantial volume contradicts the narrative that the supply is rapidly shrinking, casting doubt on the expectation of an imminent major price surge based solely on supply constraints.

XRP Supply on Exchanges Compared to Other Tokens

Moreover, the reserve of XRP on centralized exchanges has largely remained the same throughout 2024, with no steep decline as observable with other crypto assets.

Notably, the supply of XRP on the largest crypto exchange, Binance, decreased in November from 3.14 billion to 2.79 billion on December 16. Yet, it is growing quickly again toward the 3 billion mark. Besides, the current figure mirrors the volume that has been on Binance for most of 2024.

XRP supply on Binance

On the other hand, crypto assets like Bitcoin, Ethereum, and Shiba Inu are experiencing a sharp decline in available supplies on exchanges.

For instance, 167.34 trillion SHIB tokens were on exchanges last December, but the current figure is now 134.4 trillion. Similarly, Ethereum’s supply on exchanges, which was at 20.66 million a year ago, dropped to 18.6 million in September. While it is now back at 19 million, the overall trend shows a steep decline.

Likewise, Bitcoin, which started the year with 3.07 million BTC tokens on exchanges, has seen this number drop to 2.42 million.

Bitcoin supply on exchanges

Meanwhile, regardless of XRP’s supply data, analysts remain bold with XRP price predictions. Some argue that the current supply is inconsequential in the broader scheme.

A Much Better Dogecoin Rally Than 2021 Is Coming: Analyst

0

With Dogecoin close to its best third-year cyclical performance ever, a notable market expert suggests the meme coin leader will do better next year.

Dogecoin is on the path to its best cyclical third year ever. The largest meme coin by market cap has appreciated a staggering 243% in the past year, with a greater part from its November price explosion.

With the upsurge, the token improved its performance in 2016 and 2020. For context, Dogecoin grew 72.37% and 114.86% in these years, dwarfed by this year’s upsurge by miles.

Notably, the fourth year of each cycle has been the best-performing year for Dogecoin. The asset has trounced its previous cycle’s percentage uptick, and a community enthusiast known as “Investments CEO” expects a similar play next year.

Dogecoin to Better 2021’s 12,000% Uptick: Analyst

In a Christmas Day post, the analyst Investments CEO argued that Dogecoin would repeat its fourth-year cyclical performance. Meanwhile, he suggested that the meme coin would improve on its 2021 rally.

For context, Dogecoin rallied 12,000% in 2021, peaking at its all-time high of $0.73995. Notably, the year’s rally was more than double that seen in 2018, as the leading meme coin surged 5,000% six years ago.

Meanwhile, the notable community figure asserted that the historical trend would persist next year. A surge past 12,000% in 2025 would push Dogecoin to an unprecedented price above $40 per coin.

Dogecoin

Market Expert Supports Assertion

Despite the ambitious nature of this projection, the analyst is not alone in this sentiment. In fact, another analysis supports the Dogecoin enthusiast claims of an over 12,000% upswing.

For context, seasoned market analyst Ali Martinez teased the idea. In a recent commentary, he disclosed a similitude in Dogecoin’s last three bull cycles.

According to the commentary, Dogecoin surged 212% from the bear market lows, retraced 40%, and exploded 5,000% in 2017. The token’s price repeated a similar pattern in 2021, growing 476%, correcting 56%, and then appreciating 12,000%.

Martinez pointed out that Dogecoin has grown 440% and is in its correctional phase, retracing over 46%. If a similar pattern fully unravels, the meme coin market leader could see an uptick of over 12,000% in 2025.

In the meantime, DOGE trades at $0.3170, down 4.5% in the past 24 hours.

Cardano Bulls Bought $6B Worth of ADA on Christmas Day as Price Eyes $1

0

Cardano bulls accumulated a substantial amount of ADA tokens on Christmas day amid the recovery push from the broader crypto market.

For context, Cardano began Christmas with a $0.93 price but eventually witnessed a bearish spell hours into the day, dropping to retest the $0.91 price support. However, the bulls mounted an impressive defense, triggering a spike to knock at the $0.94 mark.

This rebound was rather short-lived, resulting in a mild pullback and subsequent consolidation. Notably, ADA aimed to build on a recent uptrend, which began on Dec. 23 with an impressive 4.8% intraday close. Nonetheless, the bears snuffed this momentum on Christmas day.

Cardano Bulls Buy 6B+ ADA

Despite this, Cardano bulls appear to have increased their appetite. Data from IntoTheBlock shows that these investors procured about 6.83 billion ADA tokens worth $6.352 billion on Christmas Day.

For context, bulls refer to market participants who purchased at least 1% of Cardano’s trading volume over a 24-hour period. While the latest purchase volume represented a drop from previous highs, overall net inflows marked an impressive two-week high.

Particularly, besides the bulls, Cardano bears saw a more substantial drop in their sales volume. Notably, these addresses sold 6.82 billion ADA on Christmas Day, their lowest volume in over a year.

Cardano Bulls and Bears IntoTheBlock
Cardano Bulls and Bears | IntoTheBlock

Interestingly, this bull-bear volume led to an excess demand of 7.53 million Cardano (about $7 million) yesterday, representing the highest demand ADA has witnessed since Dec. 10, which previously led to a three-day price uptick to $1.

As the crypto market shows signs of a potential recovery, a new trend of excess demand could grant the bulls enough strength to push Cardano prices above the current range-bound phase. However, this might not occur until the festivities are over.

For context, the market is relatively quiet during Yuletide periods as most market participants turn their focus away from trading. This reflects in Cardano’s large transaction volume, which slumped to a near two-month low of 4,330 transactions on Christmas Day.

ADA Large Transactions IntoTheBlock

Cardano Eyes $1

Despite this, analysts expect the recovery to trigger Cardano’s next leg up. Flash, a Bitcoin and crypto trader, asserted on Christmas Eve that Cardano is on the verge of properly starting its own bull market, which he believes could begin when ADA recovers the $1.25 level.

Meanwhile, at press time, Cardano trades for $0.8705, down 5.07% today as it corrects all the gains from the most recent rebound. ADA’s chances of a full-blown recovery hinge on its ability to reclaim $1, which would require a push above the 21-day EMA at $1.014.

Cardano 1D Chart
Cardano 1D Chart

Nonetheless, despite the bearish pressure, its technicals remain favorable. For instance, Cardano’s Commodity Channel Index (CCI) has dropped to negative 91, suggesting it might be oversold. Data from CryptoQuant also confirms that RSI has entered the oversold region, and a recovery is imminent.