Home Blog Page 1058

France Second-Largest Banking Group BPCE to Launch Bitcoin and Crypto Investment Service for Its 35M Users

0

BPCE Group, the second-biggest bank in France, reportedly plans to allow its customers to invest in Bitcoin and other cryptocurrencies in 2025. 

Local media outlet Big Whale reported the development today, noting that BPCE Group will launch the new service through its crypto subsidiary, Hexarq. 

Citing sources familiar with the development, the Big Whale claimed that Hexarq will integrate the service into BPCE Group’s Banque Populaire and Caisse d’Épargne networks to enhance customers’ loyalty. 

Hexarq Secures Crypto License 

In the meantime, Hexarq is already preparing to enable BPCE Group’s customers to invest in crypto. According to the report, the crypto subsidiary recently received PSAN authorization from France’s Autorité des marchés financiers (AMF), allowing it to offer crypto-related services. 

Under the regulatory approval, Hexarq users will be allowed to buy, sell, and hold cryptocurrencies. Per the report, Hexarq is the second bank after SG Forge and the fourth company to secure PSAN approval in France.

BPCE Group Profile 

For context, BPCE Group is a major banking company in France. It was established in 2009 following a merger between two retail banking groups, Groupe Banque Populaire and Groupe Caisse d’Épargne. 

It has become one of the biggest banking groups in France. As of 2023, BPCE Group ranked as the second-largest banking group in France and the 17th-largest global asset manager, with a net banking income of €22.2 billion ($23.1 billion). 

Data from Statista shows that the banking group’s assets under management amounted to €1.54 trillion ($1.6 trillion) as of 2023. 

Furthermore, it serves 35 million customers across more than 50 countries. As a result, BPCE Group’s decision to offer the new investment service could foster crypto adoption among its 35 million customers. 

Other Banks Introduce Crypto Trading Service 

Meanwhile, BPCE Group is not the only bank seeking to expose its customers to cryptocurrencies. Last month, Hong Kong’s largest virtual bank, Za Bank, launched a crypto trading service on its mobile application, allowing customers to buy and sell digital assets like Bitcoin (BTC) and Ethereum (ETH) on the platform. 

In September, Germany’s private banking institute Commerzbank also launched crypto trading and custody services for its clients. It initially rolled out the service to 26,000 corporate customers, granting them exposure to BTC and ETH. 

Market Veteran Eyes XRP Push to Three-digit Figure, Says Recent Drop Merely a Retest of Double Bottom Breakout

0

A notable market veteran says XRP could reach a three-digit figure, suggesting the recent drop is just a retest of a double-bottom breakout.

Gert van Lagen, a Dutch technical analyst, noted this while discussing XRP’s price movements on the weekly chart. He argued that the current XRP price retracement could be a necessary retest, setting the stage for an explosive run that could surpass $100. 

XRP Historical Double Bottom Structure

His weekly chart highlights XRP’s historical patterns, with a focus on its first cycle. For context, during this period, XRP formed a similar double-bottom structure. After achieving an all-time high of $0.0614 in December 2013, XRP collapsed. This slump led to the first bottom at $0.00281 in July 2014. 

Despite a recovery to $0.028 in December 2014, XRP failed to break its 2013 ATH. This resistance triggered another collapse, reaching a second bottom at $0.003 in January 2017. 

XRP 1W Chart Gert van Lagen
XRP 1W Chart | Gert van Lagen

However, in an interesting turn, a breakout from the double bottom led to a more substantial uptrend. After breaking above this double-bottom pattern in March 2017 and retracing to retest the breakout, XRP experienced a parabolic surge, reaching a new ATH of $3.31 by January 2018.

XRP Forms Similar Double-Bottom

Fast forward to the current cycle, XRP’s price movements are similar to the previous behavior. After reaching its ATH of $3.31 in January 2018, XRP entered a prolonged bearish phase, which led to the formation of a second double-bottom structure.

The asset found its first bottom at $0.1140 in March 2020 before rebounding to $1.96 in April 2021. However, this recovery fell short of reclaiming the $3.31 ATH. A subsequent collapse brought XRP to its second bottom at $0.2870 in June 2022, following the market-wide turmoil triggered by Terra’s downfall.

This double-bottom setup is again signaling the possibility of a massive bullish breakout. November 2024 marked a crucial turning point, as XRP rallied by 283%, echoing a similar 284% surge from March 2017. Van Lagen believes this rally confirmed the double-bottom breakout. 

A Healthy Retest

However, XRP has since retraced to $2.2 amid a broader market pullback. Van Lagen asserts that this pullback is a healthy retest of the breakout zone. Notably, such retests are essential for establishing strong support levels.

Van Lagen predicts that if XRP replicates the previous run, it could surpass $100 this cycle. Specifically, data from his chart shows a likely rally to $150, marking an upsurge of 6,718% from the current $2.2 price. For context, XRP rallied 12,592% to $3.31 after a similar retest in 2017.

Interestingly, EGRAG, another prominent market analyst, confirmed the bullish outlook. He noted that he and other confident market watchers have faced ridicule for projecting rallies to double-digit prices. However, market veterans are now expecting XRP to hit a triple-digit price.

For context, EGRAG has always been confident that XRP could reach $27. Most recently, he identified an XRP profit-taking zone between $4.42 and $27.86, based on Fibonacci extensions. He also recently introduced the “Bifrost Bridge” framework, which suggests XRP could reach $6 by December 2024 and $27 by January 2025.

Data Confirms XRP Historic Rally Dragged Down Bitcoin Dominance

0

Bitcoin dominance, a key metric reflecting its share of the total crypto market capitalization, recently experienced a notable 6% dip. 

Of this, XRP accounted for a significant 3% surge in its dominance. While Bitcoin dominance is now rebounding, the broader implications highlight evolving trends in crypto market liquidity.

News On XRP: CryptoQuant founder Ki Young Ju called public attention to this observation in a tweet.

Bitcoin and XRP market dominace update
Young Ju tweet

XRP Independent Rise

Over recent weeks, XRP has emerged as one of the few altcoins to attract fresh liquidity, contributing directly to Bitcoin’s temporary decline in dominance. Specifically, between November 3 and December 3, the price of XRP soared by approximately 500%.

In parallel, its market cap expanded by more than five times, from $28.99 billion to an all-time high of $154.83 billion. This major XRP move dealt a blow to Bitcoin’s dominance, which at one point hit 52%. Meanwhile, it is now around 60%. 

Image
Bitcoin and XRP market dominance update

The increase in XRP’s market share underscores a break from the traditional patterns where altcoins closely mirrored Bitcoin’s uptrend. Instead, XRP is carving out its own narrative, driven by heightened interest and independent adoption.

This trend aligns with a previous prediction by Ki Young Ju. Two weeks ago, he forecasted that the altcoin seasons would deviate from expectations, with only select altcoins gaining traction due to their unique ecosystems or market dynamics.

The State of Altcoin Season

Despite XRP’s surge, the current market does not resemble a typical “alt season,” where most altcoins outperform Bitcoin. 

According to Ki Young Ju’s recent commentary, BTC-to-altcoin rotations remain limited, and only a handful of altcoins, like XRP, are attracting meaningful liquidity. This marks a change from past cycles, suggesting that altcoins now require distinct utilities or market narratives to thrive.

This observation is further emphasized by market data showing that Bitcoin currently outperforms as much as 74% of the crypto assets in the top 100. With Bitcoin trading at $93K, it boasts a year-to-date growth of 1110%.

At the same time, altcoins like Celestia (TIA), Arbitrum (ARB), Polygon (POL, formerly MATIC), Optimism (OP), and DYDX are all posting staggering losses of over 50% in their YTD performance.

Young Ju suggested that altcoins are not seeing the traditional Bitcoin-to-altcoin rotation because BTC has created a paper-based Layer 2 ecosystem through ETFs and corporate treasury allocations. This is limiting liquidity flows to altcoins.

According to Young Ju, the two potential paths for altcoins to remain relevant are developing “paper-wrapped” versions similar to Bitcoin’s institutional products and building robust ecosystems that leverage stablecoins or Bitcoin as foundational elements.

Self-Proclaimed Bitcoin Founder Craig Wright Sentenced to 12 Months in Prison

0

Craig Wright, the self-acclaimed Bitcoin creator, has been sentenced to 12 months in prison after defying a UK court order.

Controversy is not always far off from Australian computer scientist and businessman Craig Wright. The self-acclaimed Bitcoin founder was entangled in another legal action on Thursday, landing jail time this time.

The British High Court has sentenced Wright to 12 months imprisonment for contempt. The December 19 ruling would see the computer scientist spend one year behind bars, including a 24-month suspension.

Prison Time for Five Counts of Contempt

The beginning of Wright’s woes stemmed from his case with the Crypto Open Patent Alliance (COPA), an NGO consisting of crypto establishments. The firm sued Wright over his escalating claims to be Satoshi Nakamoto, the pseudonymous Bitcoin founder.

Earlier this year, the Australian businessman lost the legal battle, with the court ruling that he blatantly lied in his claims. Furthermore, the judge issued a legal order constraining Wright from filing legal claims relating to Bitcoin.

However, Wright disobeyed the order and pursued fresh legal action against COPA. The association disclosed in a Wednesday hearing that the self-proclaimed Bitcoin founder sued it for £900 billion.

Meanwhile, the High Court tried Wright, who appeared on a video call and claimed he was too poor to afford a flight from Asia for the hearing on Thursday. The court charged him with five counts of contempt and sentenced him to a 12-month jail term.

Wright’s Years-Long Bitcoin Creator Claims Turning Soar

The computer scientist has incessantly made headlines over claims that he created Bitcoin, the largest cryptocurrency by market cap. A court earlier fueled his claims after ruling in his favor over a dispute with David Kleiman, a renowned computer forensics specialist.

However, several courts have thrown out other legal proceedings on his Bitcoin claims. The most recent ruling was in March when a court inferred that Wright was not the founder of Bitcoin.

Meanwhile, the search for who the pseudonymous founder is has continued. In October, an HBO documentary claimed that Peter Todd was Satoshi Nakamoto, an assertion the Canadian programmer has publicly denied.

Messari Founder Kicks XRP Amid Price Decline

0

The Messari founder takes a jab at XRP amid the latest market-wide bloodbath that has triggered a massive collapse in prices.

A popular saying goes, ‘Don’t kick a dog when it is down,’ but that likely means nothing to Messari founder Ryan Selkis, at least not when it comes to XRP.

Selkis Discourages XRP Buys

Messari founder Ryan Selkis has taken another jab at XRP. In an X post on Thursday, December 19, Selkis made a joke suggesting there is never a good time to buy the asset.

“Now that XRP has fallen below the value of Coinbase, Microstrategy, and Softbank (combined), it’s looking like a good buy again,” he wrote.

The latest criticism comes just days after he slammed members of the XRP community as worthless bot groups on X and as the asset experiences a price dip that some may see as a good buying opportunity.

XRP Slumps in Fed-Led Correction

Over the past two days, the crypto market has endured significant losses, and XRP has not been left out. The asset’s price has recorded a 21% decline from highs of $2.5921 on Wednesday, December 18, to lows of $2.0505 on Friday, December 20.

XRP/USDT daily candle chart
XRP/USDT daily candle chart. Source: TradingView

The losses come as the Federal Reserve looks set to pump the brakes on its quantitative easing measures, which promised to unlock more liquidity for risk markets like crypto.

Details from the Federal Open Market Committee (FOMC) meeting released on Wednesday showed that amid projections of persisting inflation, the central bank planned to engage in only two interest rate cuts in 2025, down from the initial projection of four as of September 2024.

Still, recent market volatility has not stopped some analysts from making bullish calls for XRP. One such analyst, “Amonyx,” has suggested that the asset could surge as high as the $251 price point if it can replicate its March 2017 to January 2018 price action. The asset rallied 60,000% from $0.0055 to $3.31 within this period.

Meanwhile, another analyst, “Casi,” has warned that holding support at $2 could be key to XRP’s recovery.

The bullish calls come as XRP still has regulatory and political winds blowing in its favor amid the incoming Donald Trump administration. At the same time, Ripple recently launched RLUSD, a stablecoin that promises to unlock greater liquidity and sophisticated DeFi applications.

Cardano Price Breaks Below 50-Day EMA: Downside Risk Targets $0.70

With Cardano (ADA) price crossing below key support levels, sellers are now targeting a retest of $0.70.

As the altcoin market faces a downturn with Bitcoin nearing $95k, top cryptocurrencies like Ethereum, Cardano, and XRP are falling below crucial support levels. Amid rising liquidations, ADA’s price trend marks its fifth consecutive bearish day.

The ADA trend signals significant downside risk with the price falling below $0.90. Could the volatile market drive Cardano’s price down to $0.70?

Cardano Price Analysis

On the 4-hour chart, Cardano’s price shows a bearish channel pattern. The ongoing correction within the falling channel has broken below a key support trendline.

Cardano price Chart
Cardano price Chart

This breakdown suggests a bearish continuation, with the price likely to extend the downtrend. Currently, Cardano’s market price is $0.839, and a bearish engulfing candle is forming on the 4-hour chart.

This engulfing candle breaks the support trendline and is on the verge of closing below it, which increases the likelihood of a drop to the $0.70 psychological support level.

The 200 EMA on the 4-hour chart also produced a bearish crossover. The 4-hour RSI has also entered the oversold territory, further indicating a sell signal for Cardano.

ADA Price Targets

On the daily chart, Cardano forms its fifth consecutive bearish candle. This undermines the previous accumulation phase above $0.90 and has resulted in a break below the 50-day EMA.

Cardano price Chart
Cardano price Chart

As the downtrend continues, Cardano’s price will likely test the 100 EMA at around $0.71. Therefore, the daily and 4-hour charts point to a downside risk of 13-15%.

However, if the 4-hour candle closes bullishly above the support trendline, a potential reversal could push the price back toward the 200 EMA at $0.976.

Ethereum Price Dips Below $3,400: Will $3,035 Support Hold?

Will the price of Ethereum (ETH) continue its freefall and test the $3,000 mark as Bitcoin (BTC) crashes below $96k?

Ethereum has dropped below the $3,500 psychological support as Bitcoin falls under the $96,000 level. As Bitcoin’s market cap dips below $2 trillion, Ethereum is holding on to its $400 billion valuation.

In parallel, Ethereum is holding onto the $3,400 support level as the crypto market turns red. Will sellers cause a breach at this level and push for a retest of $3,000?

Ethereum Price Analysis

Over the past seven days, Ethereum has dropped by 12.44%, reflecting the intense market correction. In the daily chart, the Ethereum price trend shows three consecutive bearish candles.

The bearish turn began after Ethereum faced a rejection at the $4,100 level. With the triple black crow pattern, Ethereum has cracked below the 50-day EMA line.

COINBASE:ETHUSD Chart Image by Trojan69420

Furthermore, the price has reached the 78.60% Fibonacci retracement level at $3,553. As the downtrend continues, Ethereum is now testing the $3,400 level, with the current market price at $3,404.

As the price decline persists, the daily RSI has fallen below the halfway mark and is inching closer to the oversold boundary. The momentum indicator shows an increase in selling pressure.

Ethereum ETF Turns Red

Amid the declining price trend, Ethereum ETFs experienced a massive outflow of $60.47 million. Leading the bearish pack, Grayscale dumped $58.13 million worth of Ethereum. This surge in selling pressure has ended the bullish run in the Ethereum ETF market.

Whale Activity on the Rise

As Ethereum’s price volatility increases, ETH tokens are selling at discounted prices. Capitalizing on this, Donald Trump’s World Liberty Finance has spent $2.5 million to purchase 722 ETH tokens.

However, despite Trump’s firm’s bullish outlook, the market has seen whales turning bearish. Due to the recent price drop, whales are forced to sell to repay debts.

One whale recently deposited 22,746 ETH tokens worth $77.7 million to Binance, while another one deposited 31,968 ETH tokens worth $122 million over the past two days.

Furthermore, another whale deposited 49,910 ETH tokens, worth $170 million, over Binance and will convert them into stablecoins worth $137.8 million.

Will Ethereum Price Drop to $3,000?

In conclusion, as the broader crypto market turns bearish, Ethereum is facing increased selling pressure. The downtrend will likely gain momentum with institutional support and retail demand fading.

Based on Fibonacci levels and technical indicators, the 200 EMA line at $3,035 remains a crucial psychological support level. Beyond that, the 50% Fibonacci level at $2,942 could be a potential bounce-back zone. Ethereum’s price could challenge the 78.60% Fibonacci level at $3,530 if the broader market recovers.

Timelines for Dogecoin to Hit $10, $20, $50 and $100

0

Various reputable entities have commented on the possible timelines for Dogecoin to reach double-digit values and even surpass $100.

Dogecoin has been one of the victims of the recent market downturn, dropping by 28% over the past week. However, with its current value of $$0.28, the meme coin still boasts a year-to-date growth of 250%.

Given its impressive performance so far in 2024, analysts expect Dogecoin to perform even better in 2025. Notably, some market watchers have speculated that Dogecoin could break the unit value milestone and extend even beyond $10.

For context, at $10, Dogecoin would have a market cap of $1.4 trillion. Considering the weight of this, The Crypto Basic sought input from Elon Musk’s AI Grok and OpenAI’s ChatGPT on when Dogecoin could reach a peak value of $10, $20, $50, and $100.

When Dogecoin Can Hit $10, $20, $50, and $100, According to Grok

Grok, the chatbot associated with Elon Musk’s X platform, provided a broad overview of the speculative timelines for Dogecoin reaching these price points. 

As for the $10 price point, Grok suggests that reaching $10 could be achievable around January 2040 or even as early as 2029, according to predictions from Changelly and CoinCodex.

Meanwhile, Grok aligns with popular estimates for $20, noting Dogecoin could hit $20 by March 2040 or 2045.

While Grok didn’t provide an explicit timeline for Dogecoin reaching $50, it is implied that such a milestone would likely be even more speculative.

Likewise, for the $100 price point, the chatbot noted that $100 for Dogecoin is viewed with skepticism, given the necessary market capitalization. Grok hinted that it is highly unlikely, as this would require a market cap exceeding $14.73 trillion.

While optimistic projections place this possibility beyond 2040, the consensus remains that this target might be unfeasible under current market conditions.

When Dogecoin Can Hit $10, $20, $50, and $100, According to ChatGPT

On the other hand, ChatGPT provided a more detailed analysis of Dogecoin’s potential to reach these four price points. 

ChatGPT predicts Dogecoin could hit $10 between 2028 and 2032, with a required market cap of approximately $1.41 trillion. For this to occur, Dogecoin would need to capture around 10% of a projected $15 trillion crypto market.

According to ChatGPT, achieving such a market cap could be realistic if blockchain technology continues to gain mainstream adoption and Dogecoin secures strategic partnerships and use cases globally.

Meanwhile, the timeline for Dogecoin hitting $20 is forecast between 2030 and 2035, with a required market cap of $2.82 trillion. This scenario assumes that the crypto market expands to approximately $30 trillion, with Dogecoin seeing a 10% dominance in this larger ecosystem.

Furthermore, for Dogecoin to reach $50, ChatGPT estimates a timeline of 2035–2040. This would require a market cap of $7.04 trillion.

However, ChatGPT is highly cautious about Dogecoin reaching $100, as it would require an unprecedented market cap of $14.08 trillion. The timeline for this target is beyond 2040, with the crypto market needing to exceed $100 trillion for this price point to become even remotely feasible.

ChatGPT emphasizes that this is speculative and would likely require revolutionary shifts in global finance.

Bitcoin “Buying the Dip” Mentions Surge to 8-Month High as Price Drops to $95K

0

Bitcoin dipped below $96K on Friday, marking its third consecutive day of losses, as macroeconomic factors and profit-taking exerted pressure on the market.

The cryptocurrency’s decline accelerated on Thursday following comments from Federal Reserve officials suggesting slower interest rate reductions in 2025.

At the time of publication, Bitcoin was trading at $95,012, reflecting a 6.5% drop over the past 24 hours and a 5.1% decline for the week.

Spike in “Buying the Dip” Mentions

As Bitcoin’s price fell below $96,000, discussions surrounding “buying the dip” surged across social media platforms. According to market intelligence provider Santiment, mentions of the term reached their highest level in over eight months. 

Notably, this trend aligns with previous periods of heightened optimism among investors, including the major sell-off in August. Since then, Bitcoin’s market capitalization has rebounded significantly, rising by 81%. Historically, such moments of heightened social interest have coincided with eventual market recoveries, as reflected by Bitcoin’s increase in market cap.

Image

Holder Accumulation and Exchange Outflows

Elsewhere, data from blockchain analytics firm IntoTheBlock showed notable shifts in Bitcoin ownership trends. Over the past seven days, holdings among large investors increased by 3.30%, suggesting heightened accumulation amid the price correction. 

Bitcoin Large Holders Inflow

However, the 30-day metric revealed a 95.02% decline, likely reflecting profit-taking activity during Bitcoin’s recent record highs. Despite short-term fluctuations, a 90-day ownership increase of 136.17% demonstrated sustained buying interest over the longer term.

In addition to rising holdings, outflows from aggregated exchanges have increased, signaling a preference among investors to transfer Bitcoin to private wallets. Surges in outflow volumes consistently aligned with recent price drops. 

Exchange Outflow Volume

A 24-hour increase of 4.83% in exchange outflows highlighted renewed accumulation activity, although the past week showed a decline of 4.28%.

Key Support Levels Shift Amid Pressure

In a related evaluation, blockchain data revealed critical support zones for Bitcoin below the $100,000 mark, underscoring significant demand. Analysis from IntoTheBlock indicated that approximately 1.45 million BTC, valued at $141.37 billion, were accumulated around the $97,500 price point. 

However, this support failed to hold as selling pressure intensified, forcing Bitcoin below $96,000.

WhiteBIT Expands Crypto Lending: 60+ New Assets!

0

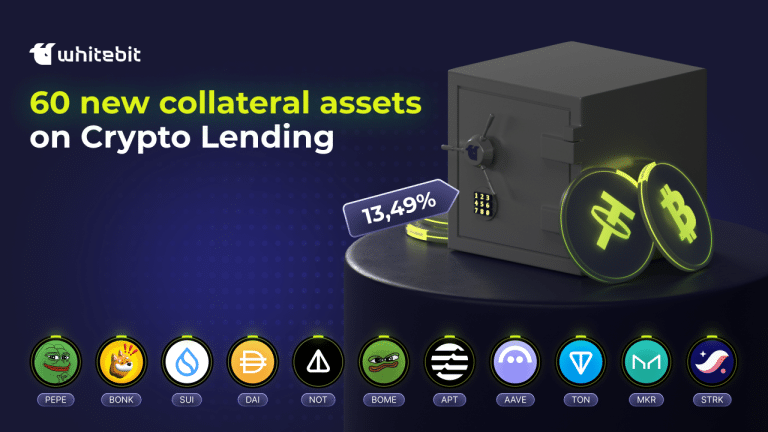
WhiteBIT, the largest cryptocurrency exchange in Europe, continues to impress its users with groundbreaking innovations! The Crypto Lending feature is now even more rewarding with the addition of 60 new assets, which can be used not only for margin and futures trading but also for crypto lending, unlocking new opportunities for those looking to invest and earn income effectively.

How does it work?

Crypto Lending allows you to lend your cryptocurrencies to WhiteBIT by selecting a flexible plan of 30, 90, 180, or 360 days. It offers the opportunity to earn up to 13.49% annual income in the same cryptocurrency you lend. This unique tool is ideal for crypto traders seeking to grow their assets with minimal risk.

Why choose Crypto Lending with WhiteBIT?

  • A variety of assets. The list of newly added cryptocurrencies features some of the most popular and in-demand assets: PEPE, BONK, SUI, DAI, TON, BOME, MRK, and many others.
  • Security and convenience. Your funds work for you on a platform with top-tier security standards, while a user-friendly interface simplifies the investment process.
  • Wide access. Lending plans are available for both beginners and experienced investors. Low minimum lending amounts make it easy to start, even with a small budget.

What does WhiteBIT offer?

WhiteBIT makes cryptocurrency investments accessible to all! By expanding its asset lineup and offering flexible terms, the exchange empowers users with unparalleled freedom. This creates an opportunity for crypto traders and investors to earn passive income while staying engaged in the fast-paced world of digital assets. 

Plus, with automatic plan execution, your earned interest is seamlessly credited to your balance, and, if you need to withdraw funds from the Crypto Lending plan, the operation is carried out instantly and without any penalties. More details about Crypto Lending can be found here.

Choose a plan that suits you and start earning with WhiteBIT today. Your assets are your power!

WhiteBIT is the largest European centralized cryptocurrency exchange founded in Ukraine in 2018, offers over 600 trading pairs, 300 assets, and supports 9 fiat currencies. As part of the WhiteBIT Group holding, the platform serves more than 30 million customers globally. WhiteBIT collaborates with Visa, FACEIT, FC Barcelona, Trabzonspor, the Ukrainian national football team, and lifecell. The company is dedicated to driving the widespread adoption of blockchain technology in Ukraine and worldwide.