Home Blog Page 1075

Expert Says Dogecoin Surge to $0.66 is Easy, but Few Will Believe It

0

Dogecoin continues to attract bullish commentary from analysts and market watchers amid its ongoing price action.

In this dogecoin price news, According to “Crow,” a notable Bitcoin analyst in the crypto community, Dogecoin’s path to a new multi-year high at $0.66 is straightforward, but many remain skeptical. He shared this sentiment in a tweet following Dogecoin’s rebound after testing crucial support in the $0.30 region.

Notably, on Tuesday, Dogecoin’s price dropped to $0.36 but has since rebounded to trade at $0.4234 today, marking a 15% resurgence since the dip.

Dogecoin “Easy” Path to $0.66

Following this rebound, analyst Crow shared a chart predicting the patterns Dogecoin could follow in the coming days based on the meme coin’s consistent price action within an ascending pattern. He expects Dogecoin to first rise to near $0.48 before facing a rejection that would drive its price back down to $0.46.

Dogecoin initially encountered a rejection at this level on December 8, which led to a retest of $0.36 shortly after. However, this analyst expects a smaller pullback this time, which would set the foundation for a run to a fresh multi-year high at $0.52.

This level aligns with the top of the ascending channel, and the analyst envisions another short-term correction to test the $0.50 psychological level. A successful rebound from this move is expected to send Dogecoin toward the $0.66 region.

According to Crow, it is easy for Dogecoin to follow this pattern within the next two weeks, but critics who believe the meme coin has lost momentum would likely disagree.

Image
Dogecoin chart by Crow

Views of Other Analysts on Dogecoin’s Bull Run

In a separate post, analyst Crypto Scofield expressed a similar sentiment about Dogecoin. He acknowledged that Dogecoin’s bullish momentum is back; this time, it is stronger than the momentum seen in November.

Other analysts have also pointed out that while Dogecoin’s price over the past few weeks may have been unimpressive, the lackluster trend is coming to an end when looking at historical patterns.

For example, market watcher “Cantonese Cat” emphasized that Dogecoin is ready for its next move, which is to break its all-time high in the $0.74 range. This prediction is based on a similar pattern from 2021.

Dogecoin Price Targets Beyond $1

Meanwhile, beyond the near-term targets below the $1 price range, analysts have pointed to Dogecoin’s potential to rally to $3 in the next few months. Analysts holding this view include Ali Martinez and Crypto Scofield.

Martinez has even more speculative outlooks, predicting $18 and $23 based on various technical indicators.

Here Are Timelines for XRP to Claim $6 and $27 As Per Bifrost Bridge Analysis

0

A prominent market analyst presents timelines for XRP to claim new heights, leveraging pointers from his “Bifrost Bridge” analysis.

The analysis comes on the back of XRP’s recent positive performance. The asset surged 283% in November, marking its best monthly performance in seven years. December is continuing this momentum, with XRP gaining an additional 26.4% just 12 days into the month.

Market analyst EGRAG has compared the ongoing rally with XRP’s trajectory in the 2017 cycle. He suggests that this current price behavior mirrors patterns observed before XRP achieved its all-time high (ATH) of $3.31 in January 2018. 

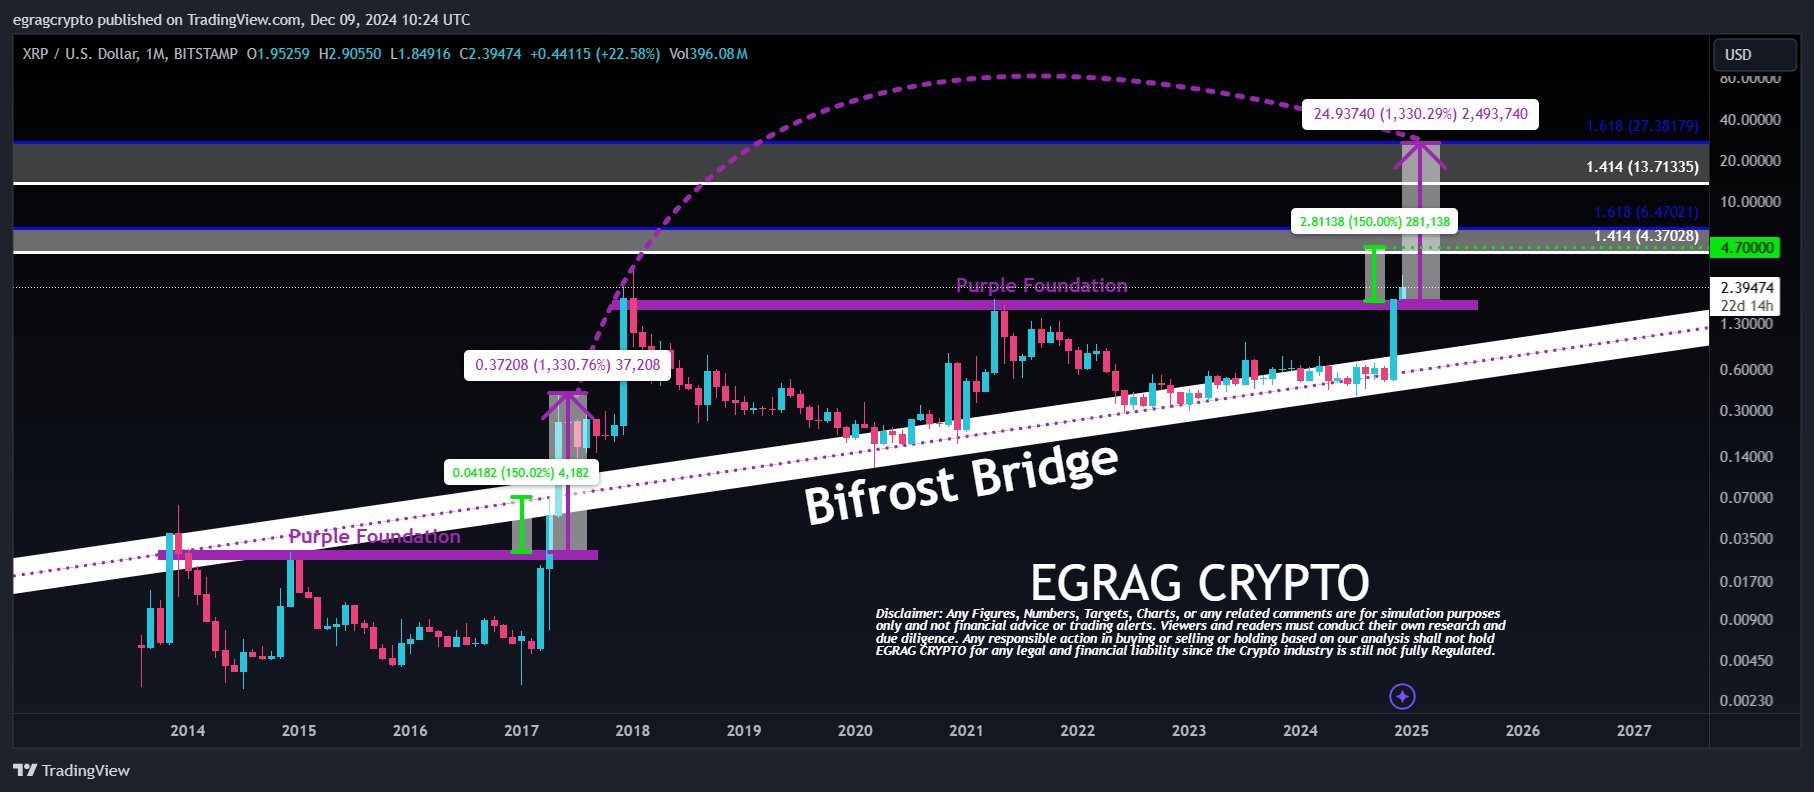
Using his “Bifrost Bridge” analysis, EGRAG forecasts two potential price milestones for XRP: $6 and $27. Notably, he based these targets on Fibonacci retracement levels and historical price movements.

XRP Could Target $6 and $27

In his analysis, EGRAG highlighted XRP’s early 2017 market moves. For context, in March 2017, XRP rallied 150% from a critical support zone, which the analyst calls the “purple foundation.” 

Interestingly, this initial rally set the stage for a more extraordinary 1,330% gain in May 2017. EGRAG projects that XRP’s ongoing uptrend could follow a similar trajectory. If the same percentage gains repeat, XRP may achieve new heights.

In the current December monthly candle, the analyst believes aims for the “gold region,” situated between $4.3 and $6.4. Data from the chart shows that these initial price targets align with Fibonacci retracement levels of 1.414 and 1.618.

XRP 1M Chart EGRAG Crypto

Meanwhile, for the next monthly candle, January 2025, EGRAG sees a massive 1,330% rally that could push XRP into a second gold region. He expects this gold region to rest between the lofty prices of $13.7 and $27.3, aligning with another retracement zone. 

EGRAG Dismisses Market Cap Skepticisms

Notably, previous skepticism about achieving such targets had emerged. They often center on the increased liquidity and larger market cap in today’s crypto markets. However, EGRAG addressed this by comparing the total market caps for 2017 and 2024 (TMC). 

In May 2017, the crypto market cap stood at $60 billion. Today, it has ballooned to $3.7 trillion, marking a 6,000% increase or a 61x multiple. EGRAG suggests applying this same multiplier to XRP’s 2017 market cap of $15 billion. This would result in a hypothetical $900 billion XRP market cap.

Interestingly, to contextualize these figures, XRP would need to capture between 9% and 18% of the TMC, depending on whether it grows to $5 trillion or $10 trillion. Given XRP’s use cases in cross-border payments, such dominance in market share is considered feasible.

For context, Ripple CEO Brad Garlinghouse previously predicted that the TMC could rise to $5 trillion. Today, XRP trades for $2.48, boasting a market cap of $140 billion and 3.96% market dominance. If its dominance reclaimed the 2017 peak of 31%, this would translate to an XRP market cap of over $1 trillion.

Dogecoin Gears Up for $0.50 Breakout: Can $0.44 Hold the Bulls?

Will Dogecoin reach the $0.50 psychological milestone for a new 52-week high as the broader market recovers?

As the crypto market cap reclaims $3.65 trillion, the meme coin sector is back on its feet. The market cap of meme tokens has surged to $125 billion, driven by the massive gains of Dogecoin, FLOKI, and PEPE.

Over the past 24 hours, Dogecoin has increased by 5.33%, followed by FLOKI’s 9.07% rise, with both tokens ranking among the top performers. Amid the bullish recovery, Dogecoin’s market cap has reached $61.17 billion, with a 24-hour price increase of $0.4157.

Dogecoin Price Analysis

In the 4-hour chart, Dogecoin’s price action shows a sideways trend within two crucial boundary levels. The support level is at $0.3488, with overhead resistance at $0.4681. This range has remained consistent for the past few sessions, reflecting a consolidation phase in the market.

Dogecoin price Chart
Dogecoin Price Chart

Multiple doji candles on the 4-hour chart indicate indecisiveness, signaling a potential bearish turnaround. However, the ongoing bullish momentum is attempting to shift this sentiment.

Currently, Dogecoin’s price action shows a bullish reversal from $0.3656, which has reignited optimism among traders. The recovery rally, contributing to a 14% surge, has helped Dogecoin reclaim the psychological mark of $0.40.

This milestone has restored confidence in the market. The S1 pivot level aligns with this level, reinforcing its significance as key support.

Amid the recovery rally, the MACD and signal lines have given a positive crossover, accompanied by new bullish histograms. This momentum suggests a potential shift in market dynamics.

Thus, the technical indicators support Dogecoin’s bullish outlook, with a possible challenge to the overhead trendline, which could serve as the next major resistance.

Dogecoin Price Targets

Despite short-term indecisiveness, the underlying surge in demand as the broader market recovers suggests a bullish comeback for Dogecoin. Based on the pivot levels, the uptrend will likely challenge the center pivot level at $0.4465.

In the event of an extended rally, the meme coin could reclaim the $0.50 psychological mark, creating a new 52-week high. On the other hand, a bearish reversal could lead to a retest of the S2 pivot support level at $0.35.

Solana Flashes Channel Breakout Chances, $271 in Focus

As Solana V-shaped reversal gains momentum amid rising demand, breakout opportunities target the $271 level, which could be the next all-time high.

With bullish sentiments in the crypto market, Solana is witnessing a surge in buying pressure. Over the past 24 hours, the cryptocurrency has surged by 5.26%, bringing its market cap to $110 billion.

Having surpassed the $230 barrier, the broader market anticipates Solana’s price could soon break past the $250 milestone. Will bulls drive the price to a new all-time high in 2024?

Solana Price Analysis

On the 4-hour chart, Solana’s price action forms a falling channel pattern. The bullish recovery from the critical support trendline near the psychological $200 mark signals a V-shaped reversal within this channel. This rally is a strong indicator of renewed market momentum.

Solana Price Chart
Solana Price Chart

The reversal rally is currently testing the 23.6% Fibonacci level at $231.41. Resistance levels also show confluence with the simple moving average lines and the overhead resistance trendline.

A close above this level would signify a major recovery, reinforcing bullish expectations and boosting the chances of a breakout rally. However, the prolonged decline within the falling channel pattern has raised concerns about a potential “death cross” event, where the 50-period simple moving average crosses below the 200-period simple moving average on the 4-hour chart.

Despite this, the V-shaped reversal has pushed the 4-hour RSI above the halfway mark, and the 14-day SMA has risen. As a result, the momentum indicator maintains a positive alignment, even with the bearish signals from the simple moving averages.

Solana Price Targets

With breakout opportunities on the horizon, the Fibonacci levels suggest an immediate rally target of $246.73. However, the falling channel breakout projects a possible move toward the 50% Fibonacci level, around $259.

Improving market sentiment increases the likelihood of Solana reaching new all-time highs. The Fibonacci levels suggest that $271 and $289 are potential targets for the next all-time highs.

Meanwhile, a bearish reversal could see Solana retesting the $220 support level, followed by the $200 psychological mark.

As Bitcoin Reclaims $100K, Will The Rally Push Above $106K?

With a triangle breakout rally on the 4-hour chart, will Bitcoin (BTC) surpass the $103,000 milestone?

Bitcoin has reclaimed the $100,000 price level, reaching a 24-hour high of $101,961, sending a wave of positive sentiment across the market. The 24-hour recovery stands at 2.85% as the market cap approaches the $2 trillion mark.

Despite the BTC price being above the $100K level, a short-term retest raises concerns about a potential bearish slip. Will this slip lead to an extended crash, or is a post-retest reversal set to push Bitcoin to a new all-time high?

Bitcoin Price Analysis

After a quick reversal from a long-standing support trendline, Bitcoin reclaimed the $100,000 milestone. The BTC price action suggests a triangle breakout rally, having surpassed the local resistance trendline.

Bitcoin Price Chart
Bitcoin Price Chart

Currently, BTC has shown a minor pullback to retest the broken resistance trendline, retracing 0.48% over the past four hours.

The simple moving average lines remain in a positive alignment on the 4-hour chart, supporting the bullish trend. Additionally, the MACD and signal lines have crossed into positive territory, with bullish histograms showing a surge. As a result, technical indicators continue to signal a buy for BTC.

Bitcoin ETFs See Inflow Record of $223M

Amid the sudden surge in BTC’s price, institutional demand remains strong, with growing inflows into the U.S. Bitcoin spot ETFs. On December 11, the total daily net inflow into U.S. Bitcoin ETFs reached $223.03 million.

Bitcoin ETFs
Bitcoin ETFs

Leading the bullish charge, Fidelity (FBTC) recorded an inflow of $121.90 million, followed by ARK N21 shares ARKB with $52.67 million. Surprisingly, BlackRock’s buying spree has paused, with a net zero inflow.

The total net assets of U.S. spot Bitcoin ETFs have now reached $113.72 billion, accounting for 5.67% of Bitcoin’s market cap.

Bitcoin Price Targets

Currently, BTC is trading at $100,614, with a projected retest of the broken trendline. Based on Fibonacci levels, the breakout rally failed to reach the 38.20% Fibonacci level at $103,102.

Nonetheless, the potential post-retest reversal is likely to challenge the Fibonacci resistance. In the event of a bullish breakout, the immediate price target is $106,921 at the 50% level.

On the other hand, if BTC closes below the broken trendline, it will test the simple moving average line at $98,974.

Lucky Trader Turns $2.5K Into $200K Trading XRP in 3 Hours

0

An unknown trader turns $2,560 into $200,000 within three hours of investing in XRP Futures. 

The anonymous trader made a massive bet on XRP by opening four XRP Futures positions worth $2,560 on crypto trading platform Rollbit. 

Transaction Details 

Data from pseudonymous Rollbit partner ChimpZoo shows that these positions came up on December 10 with a 500x leverage. 

The user opened the trades at different prices, ranging from $1.9019 to $1.9049. Notably, the trader narrowly escaped liquidation, set at $1.8998, $1.9004, $1.9025, and $1.9027, respectively. 

With XRP soaring by over 20% after Ripple announced the NYDFS’ approval of the RLUSD stablecoin, the altcoin rebounded above the $2 mark. Following the surge, the trader closed the positions between $2.13 and $2.29, achieving returns ranging from 5,137% to 9,160%. 

According to ChimpZoo, the unknown trader successfully ‘80x’ed their net worth,’ turning $2,560 to $200,000 within three hours. 

Need for Caution 

Notably, there have been several cases of traders making huge returns with minmal capital. The Crypto Basic has covered most of these developments, including how a trader turned $20,000 into $1.7 million trading XRP and how an $800 investment became $400,000 with Solana-based memecoin Moo Deng (MOODENG). 

Nonetheless, it is rare to find stories of traders achieving hefty returns by trading crypto futures with a 500x leverage. These trades will likely be liquidated, leaving investors in regrets. 

As a result, it is imperative to exercise caution while trading futures by using lower leverages. 

XRP and USDT in Tight Contest for Third Position in Global Crypto Ranking 

In the meantime, XRP is changing hands at $2.44, reflecting a 24-hour gain of 4.59%. It has been challenging Tether (USDT) to get third place in the global crypto ranking, with both assets frequently flipping each other over the past few days. 

At the moment, XRP is ranked as the fourth-biggest cryptocurrency, with a market cap of $139.52 billion. USDT currently occupies the third position, thanks to its $139.71 billion valuation. 

The 46th Richest Man in the World Recommends 2-3% Portfolio Exposure to Bitcoin

0

American multi-billionaire Thomas Peterffy recommends that investors have some Bitcoin, suggesting a 2-3% portfolio exposure to the premier asset.

Bitcoin is becoming a crucial global financial tool. Termed the digital gold, the asset’s intrinsic value lies in its limited cap and decentralized nature.

Notably, Bitcoin’s recent emergence into the limelight has seen public entities scramble for a share of the premier asset. Wealth managers have also started recommending the asset to their clients, signaling growing institutional interest.

Meanwhile, the 46th wealthiest man in the world has recently called on investors to own Bitcoin. In an interview at the Bloomberg Talk podcast, Thomas Peterffy implied that holding the flagship cryptocurrency is a necessity.

Peterffy Suggests a Substantial Portfolio Exposure to Bitcoin

The Interactive Broker’s chair called cryptocurrencies an “interesting” asset. He admitted that the demand for the asset class has recently surged considerably but expressed skepticism about their underlying value.

Peterffy stated that Bitcoin can “get to any price” as the asset is a figment of imagination. However, he recommended that every investor hold Bitcoin as it has enormous upside potential.

Furthermore, he prescribed a 2-3% net worth exposure to the premier asset. Notably, the billionaire investor allowed room for buying more allocation but insisted that more than 10% is too risky an exposure to Bitcoin.

Interactive Broker Chair Warns of a Bitcoin Downturn

Meanwhile, Peterffy asserted that Bitcoin may correct next year, citing an increase in margin balances. He then urged investors to be cautious and diminish leverage exposure to the cryptocurrency market.

Peterffy pointed out that the Chicago Mercantile Exchange (CME) margin charges on Bitcoin futures are extremely low, allowing investors to “overextend themselves.” Hence, a correction in Bitcoin price would be catastrophic for investors.

Notably, Peterffy’s correction speculation contradicts the consensus among market analysts for next year’s Bitcoin outlook. For context, Bernstein and Standard Chartered analysts provided a bullish outlook for the premier asset, insisting that a surge to $200,000 by next year is conservative.

Cardano Price Defies Peter Brandt With 100% Surge Since Bearish Call, Or Did It?

0

Proponents call out Peter Brandt as Cardano’s price surges considerably following his bearish outlook, but there’s a catch.

Cardano latest news: Possibly borne of the constant need to defend themselves and their views, crypto investors have strong emotional ties to their assets and often do not tolerate negative perspectives about them, no matter how constructive.

As such, it is not unsurprising that crypto investors often feel the need to dish out ‘I told you so(s)’ and take a victory lap when they think they have proven naysayers wrong.

One such crypto market participant has recently brought attention to a months-long Cardano (ADA) analysis from veteran trader Peter Brandt, suggesting that the analyst had widely missed the mark. 

But did Brandt make a wrong call?

Cardano (ADA) Proves Brandt Wrong?

“If you are long ADA Cardano, look out below,” veteran commodities trader Peter Brandt quipped in a light jab at ADA investors in April 2024.

The analyst made this statement while presenting a daily ADA chart. The chart showed the formation of a bearish head and shoulders chart pattern that suggested that the asset risked a significant price dump if it broke the neckline around the $0.55 price point. For context, the asset was exchanging hands for $0.564 at the time.

However, as one crypto market participant recently highlighted, ADA is up over 100% since Brandt’s analysis. 

“This aged well ADA climbed over 100% since,” the market participant wrote in a Thursday, December 12 X post.


To be sure, the asset is trading at $1.1724 at the time of writing. 

However, there is just one problem with the criticism of Peter Brandt’s April ADA analysis: it played out as the analyst warned.

While current prices may not reflect it, on April 12, the exact date Brandt shared his ADA analysis, the asset broke the neckline of the head-and-shoulders pattern, kicking off a months-long decline to lows around the $0.28 price point.

ADA/USDT daily candle price chart showing price movement between April and August.
ADA/USDT daily candle price chart showing price movement between April and August. Source: Trading View

The recent gaff highlights a problem with how crypto participants view and respond to perceived critics. Indeed, responding to the market participant, Peter Brandt exasperatedly wrote:

“April 12 — SERIOUSLY. I am a trader. I’ve probably changed my mind 10 times since then. When circumstances change, I change my mind. What do you do????????”

As reflected by ADA’s price and Brandt’s statement, crypto market circumstances have significantly changed since April. Buoyed by shifting macroeconomic winds as the Fed cuts interest rates and overwhelming pro-crypto sentiment ahead of an incoming Donald Trump administration, crypto assets, including ADA, have flourished in recent weeks.

Top Exchange Exposes Shiba Inu L2 Shibarium to 40M+ Users with Recent Wallet Integration

0

Leading crypto exchange Bitget integrates the Shiba Inu Layer-2 blockchain Shibarium into its Web3 wallet, boasting more than 40 million users.  

In an interesting development, Bitget has added Shibarium to the list of supported blockchains on the Bitget Wallet. The wallet’s team made the move without issuing an official announcement about the integration. 

Shibarium Not Yet Supported on Bitget Exchange

However, Shibarium Update, in an X post yesterday, called the attention of Shiba Inu community members to the development. The channel attached a screenshot to the tweet, corroborating its claim that Shibarium is now supported on the Bitget Wallet.  

Furthermore, it clarified that while Bitget now supports Shibarium on its wallet, the blockchain has not been integrated into the exchange.

Potential Benefit for Shiba Inu 

Integrating Shibarium on the Bitget Wallet is a significant feat for the prominent Layer-2 blockchain. The development enables Bitget Wallet users to interact with Shibarium, allowing them to store, transfer, swap, and stake assets within the Shiba Inu ecosystem. 

Launched in May 2018, Bitget Wallet is a non-custodial wallet that allows crypto users to store, trade, earn, swap, and stake assets. It claims to have over 40 million users across 168 countries. Its large user base could be beneficial for Shibarium as it could likely boost the network’s activity significantly.

The development comes a week after Shibarium recorded two major milestones. As reported earlier, the network surpassed 2 million wallets over the weekend, with its total transaction count surging above 600 million. 

At press time, Shibarium boasts a total transaction count of 641.18 million and a daily count of 4.66 million. The number of wallets that have interacted with the blockchain since its August 2023 launch now stands at 2,006,140 (2 million).  

Shibarium Adoption on Exchanges and Wallets 

Despite Shibarium’s remarkable performance, only a few top wallets and exchanges have integrated with it. Currently, Gate.io and BluBit are among the leading exchanges that have integrated Shibarium into their platforms.

Similarly, wallets like Frontier and GroveX currently support Shibarium. Also, MetaMask users can connect to Shibarium using the wallet’s Chainlist feature. 

In the meantime, Shiba Inu community members are still calling on major crypto platforms, like Binance, Coinbase, and Ledger, to support Shibarium as they continuously push their demands on X. 

6-Time NBA Champion Sparks Debate on XRP Leading Ethereum in 2025

0

Scottie Pippen, a 6-time NBA champion, has sparked a conversation in the crypto community regarding which of XRP or Ethereum will lead the 2025 bull run.

In this XRP breaking news, Scottie Pippen, a 6-time NBA champion, mentions XRP and Ethereum.

“Who’s changing the game between ETH and XRP in 2025?” Pippen asked in a post on his X social media account on Wednesday.


Community Reactions

The tweet quickly attracted attention, with community members expressing their views on which of the two would lead the market next year. XRP proponents believe their favorite coin will take the lead, citing the ETFs related to XRP that are currently under review by the SEC.

According to X user Scott Trades, XRP will probably outperform the rest of the market in this cycle. However, he believes Ethereum’s much-anticipated all-time high run will eventually bring a life-changing altcoin season as usual.

Meanwhile, a commentator from Cape Town pointed out that ETH and XRP are fundamentally different and target separate solutions, suggesting that comparing the two may not be meaningful.

Another X user remarked that XRP would lead the way, citing months of lackluster price action with ETH. This user argued that many people bought ETH not for its underlying value but to make profits and are now giving up on it. The user even suggested that XRP might help Ethereum scale in the future.

Will XRP Overtake Ethereum in 2025?

Notably, the discussion around XRP overtaking Ethereum as the new altcoin king in 2025 has gained traction in the crypto scene. The momentum picked up following XRP’s spectacular price performance in November, during which Ethereum saw minimal growth.

For instance, XRP saw a low point of $0.4937 in November but expanded by 296% to $1.9549 that month. It even went on to hit $2.87 in the first week of December. During this time, XRP’s market cap rose from $28 billion to $164 billion, putting it right behind Ethereum in the rankings.

Meanwhile, Ethereum’s value only appreciated by 59% in November, growing from a low of $2,359 to a high of $3,740.

Ethereum later broke the $4K level in the first week of December, but its market cap did not vastly improve compared to XRP, which continued to close the gap.

Prominent market commentators like Ben Armstrong, aka BitBoy, have reiterated the bold view that XRP will overtake Ethereum’s position by next year. They see XRP reaching between $16 and $22, requiring up to 805% growth, while expecting Ethereum to see less comparable growth.

Notably, XRP would approach Ethereum’s current market cap should its value appreciate toward the $8.5 price.