Home Blog Page 1093

Wall Street Analyst Says Selling XRP Now is Like Selling Shares of Berkshire Hathaway in Early Days

0

In a bold statement on social media, Wall Street analyst Linda Jones compared the current state of XRP to that of Berkshire Hathaway in its early years.

She made this audacious comparison to urge XRP investors to hold onto their positions for the long term. Jones emphasized that XRP, the digital asset Ripple uses for cross-border payments, is far more than just a speculative token or “meme coin.”

“XRP is not a meme coin,” Jones tweeted, “XRP is not a regular crypto.” In this context, the financial analyst warned investors that selling XRP now is like parting with Berkshire Hathaway shares in the company’s early days. “All you have to have is patience,” Jones said.

Her comments come as XRP has experienced significant volatility over the years, often caught in the crossfire of regulatory battles and fluctuating market sentiment.

However, sentiment around XRP is improving. The token is currently trading at $2.73, up 450% in the past 30 days. This price places XRP just 29% below its all-time high.

Jones believes that XRP’s unique use case, specifically its role in cross-border payments, positions it for even greater long-term success, much like Berkshire Hathaway’s value became apparent only after years of growth and development.

XRP Like Berkshire Hathaway’s Shares

Notably, Berkshire Hathaway is one of the most successful investment firms in history, led by renowned investor Warren Buffett, the company’s chairman and CEO. While many early investors did not recognize its long-term value, those who held onto their shares have seen substantial returns.

According to market data from TradingView, Berkshire Hathaway’s Class A shares (BRK.A) boast an all-time return of 292,100% from their current position.

Essentially, the Wall Street analyst suggests that those who choose to hold onto XRP now could find themselves in a similar position when the asset’s true value is realized.

Notably, the audacious comparison of XRP to shares of successful companies has been a recurring theme in the crypto scene. Other market commentators have also compared XRP to shares of the FANG companies. Some have used this analogy to argue for an 8,000% price surge for XRP into the future.

Long-Term Bitcoin Holders Continue to Dump BTC Amid Prolonged Wait for $100K

0

Bitcoin faces resistance near the $97,000 level as long-term holders reduce their balances and network activity declines.

Bitcoin’s efforts to surpass $100,000 have encountered strong resistance from bears, resulting in increased volatility in recent days. On Monday, Bitcoin was rejected near $97,500, falling about $3,000 in just a few hours before stabilizing slightly above $95,000.

Today, Bitcoin continued its downward trend, dropping 1.9% to $93,940 on Tuesday. This price decline coincides with a noticeable reduction in long-term Bitcoin holdings, adding complexity to the market outlook.

Declining Long-Term Bitcoin Holdings

Recent data from IntoTheBlock reveals a significant trend: long-term Bitcoin holders have been gradually reducing their holdings. As of now, these holders—defined as wallets that have held Bitcoin for more than 155 days—control around 12.45 million BTC, the lowest level since July 2022.

This marks a decrease of nearly 10% in long-term holder balances during this cycle, a less severe drop compared to previous market corrections. In 2021, long-term holders reduced their balances by 15%; in 2017, the decline reached 26%.

This trend suggests that Bitcoin holders are either selling off for profits or shifting their holdings to alternative storage options like cold wallets or exchanges. 

Shrinking Network Activity

Alongside the decrease in long-term holdings, Bitcoin’s network activity also shows a notable decline. IntoTheBlock’s data highlights that the number of new Bitcoin addresses in the last seven days dropped by 5.94%. Active addresses, which represent the daily users transacting on the network, have decreased by 1.25%. 

Bitcoin Addresses Change, IntoTheBlock

Furthermore, there has been a 10.50% reduction in addresses with zero balances over the same period. These declines in network activity suggest that Bitcoin may be experiencing user fatigue, which could be a result of ongoing market corrections or broader disinterest. 

US Government Moving Bitcoin Amid Passive Market

In related news, the U.S. government has resumed transferring Bitcoin after a nearly four-month hiatus. On Monday, a government-linked wallet moved 19,800 BTC to a Coinbase Prime wallet, valued at $1.92 billion at the time of transfer.

Despite some skepticism surrounding the move, analysts suggest that the transfer is more likely related to custody actions than asset sales. The US Marshals Service, which oversees Bitcoin-related assets seized by the government, selected Coinbase Prime as a custody provider earlier this year.

Here are Two Crucial Points of Interest if Bitcoin Dips

0

Bitcoin’s march toward the coveted $100K milestone is entering a period of patience, with analysts warning of a potential dip before a bounce back.

The leading cryptocurrency has maintained a stable price at around $95K for several consecutive days without any decisive price movement.

In a recent commentary, analyst Michaël van de Poppe emphasized that Bitcoin needs to break through the $98K resistance to build the momentum necessary for a $100K rally. Once this key psychological barrier is surpassed, he believes the move to the widely anticipated $100,000 mark will become achievable.

However, while optimism remains high, Van de Poppe acknowledged that the wait may take longer than many expect. 

Points of Interest if Bitcoin Dips

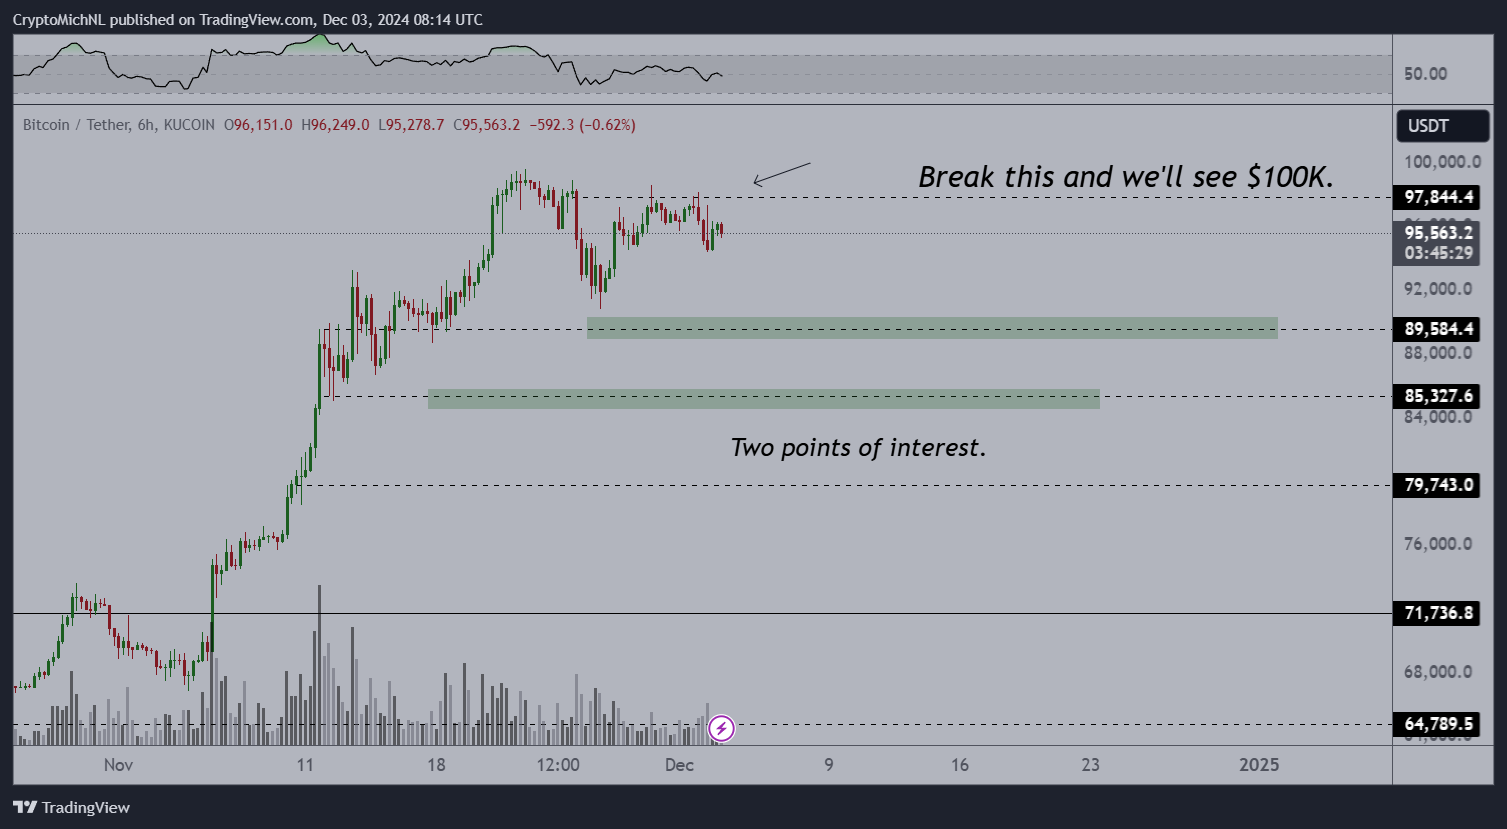
In the event of a dip, he identified two critical support zones, which he referred to as “points of interest.” These zones lie around the $89,500 and $85,300 levels. 

Image
Bitcoin chart by Michaël van de Poppe

Should Bitcoin retrace to these areas, traders might find a potential rebound opportunity. Below these levels, the next major support lies at $79,700. The analysis suggests that Bitcoin’s bullish trend would remain intact unless these lower support levels are breached. “Good times are coming,” Van de Poppe reassured market participants.

Meanwhile, analyst Ali Martinez has expressed a similar outlook on Bitcoin’s potential targets if the market dips. Sharing Bitcoin’s chart on the four-hour timeframe, he highlighted key buying interest zones around $90,500 and $85,200 as critical support levels to watch.

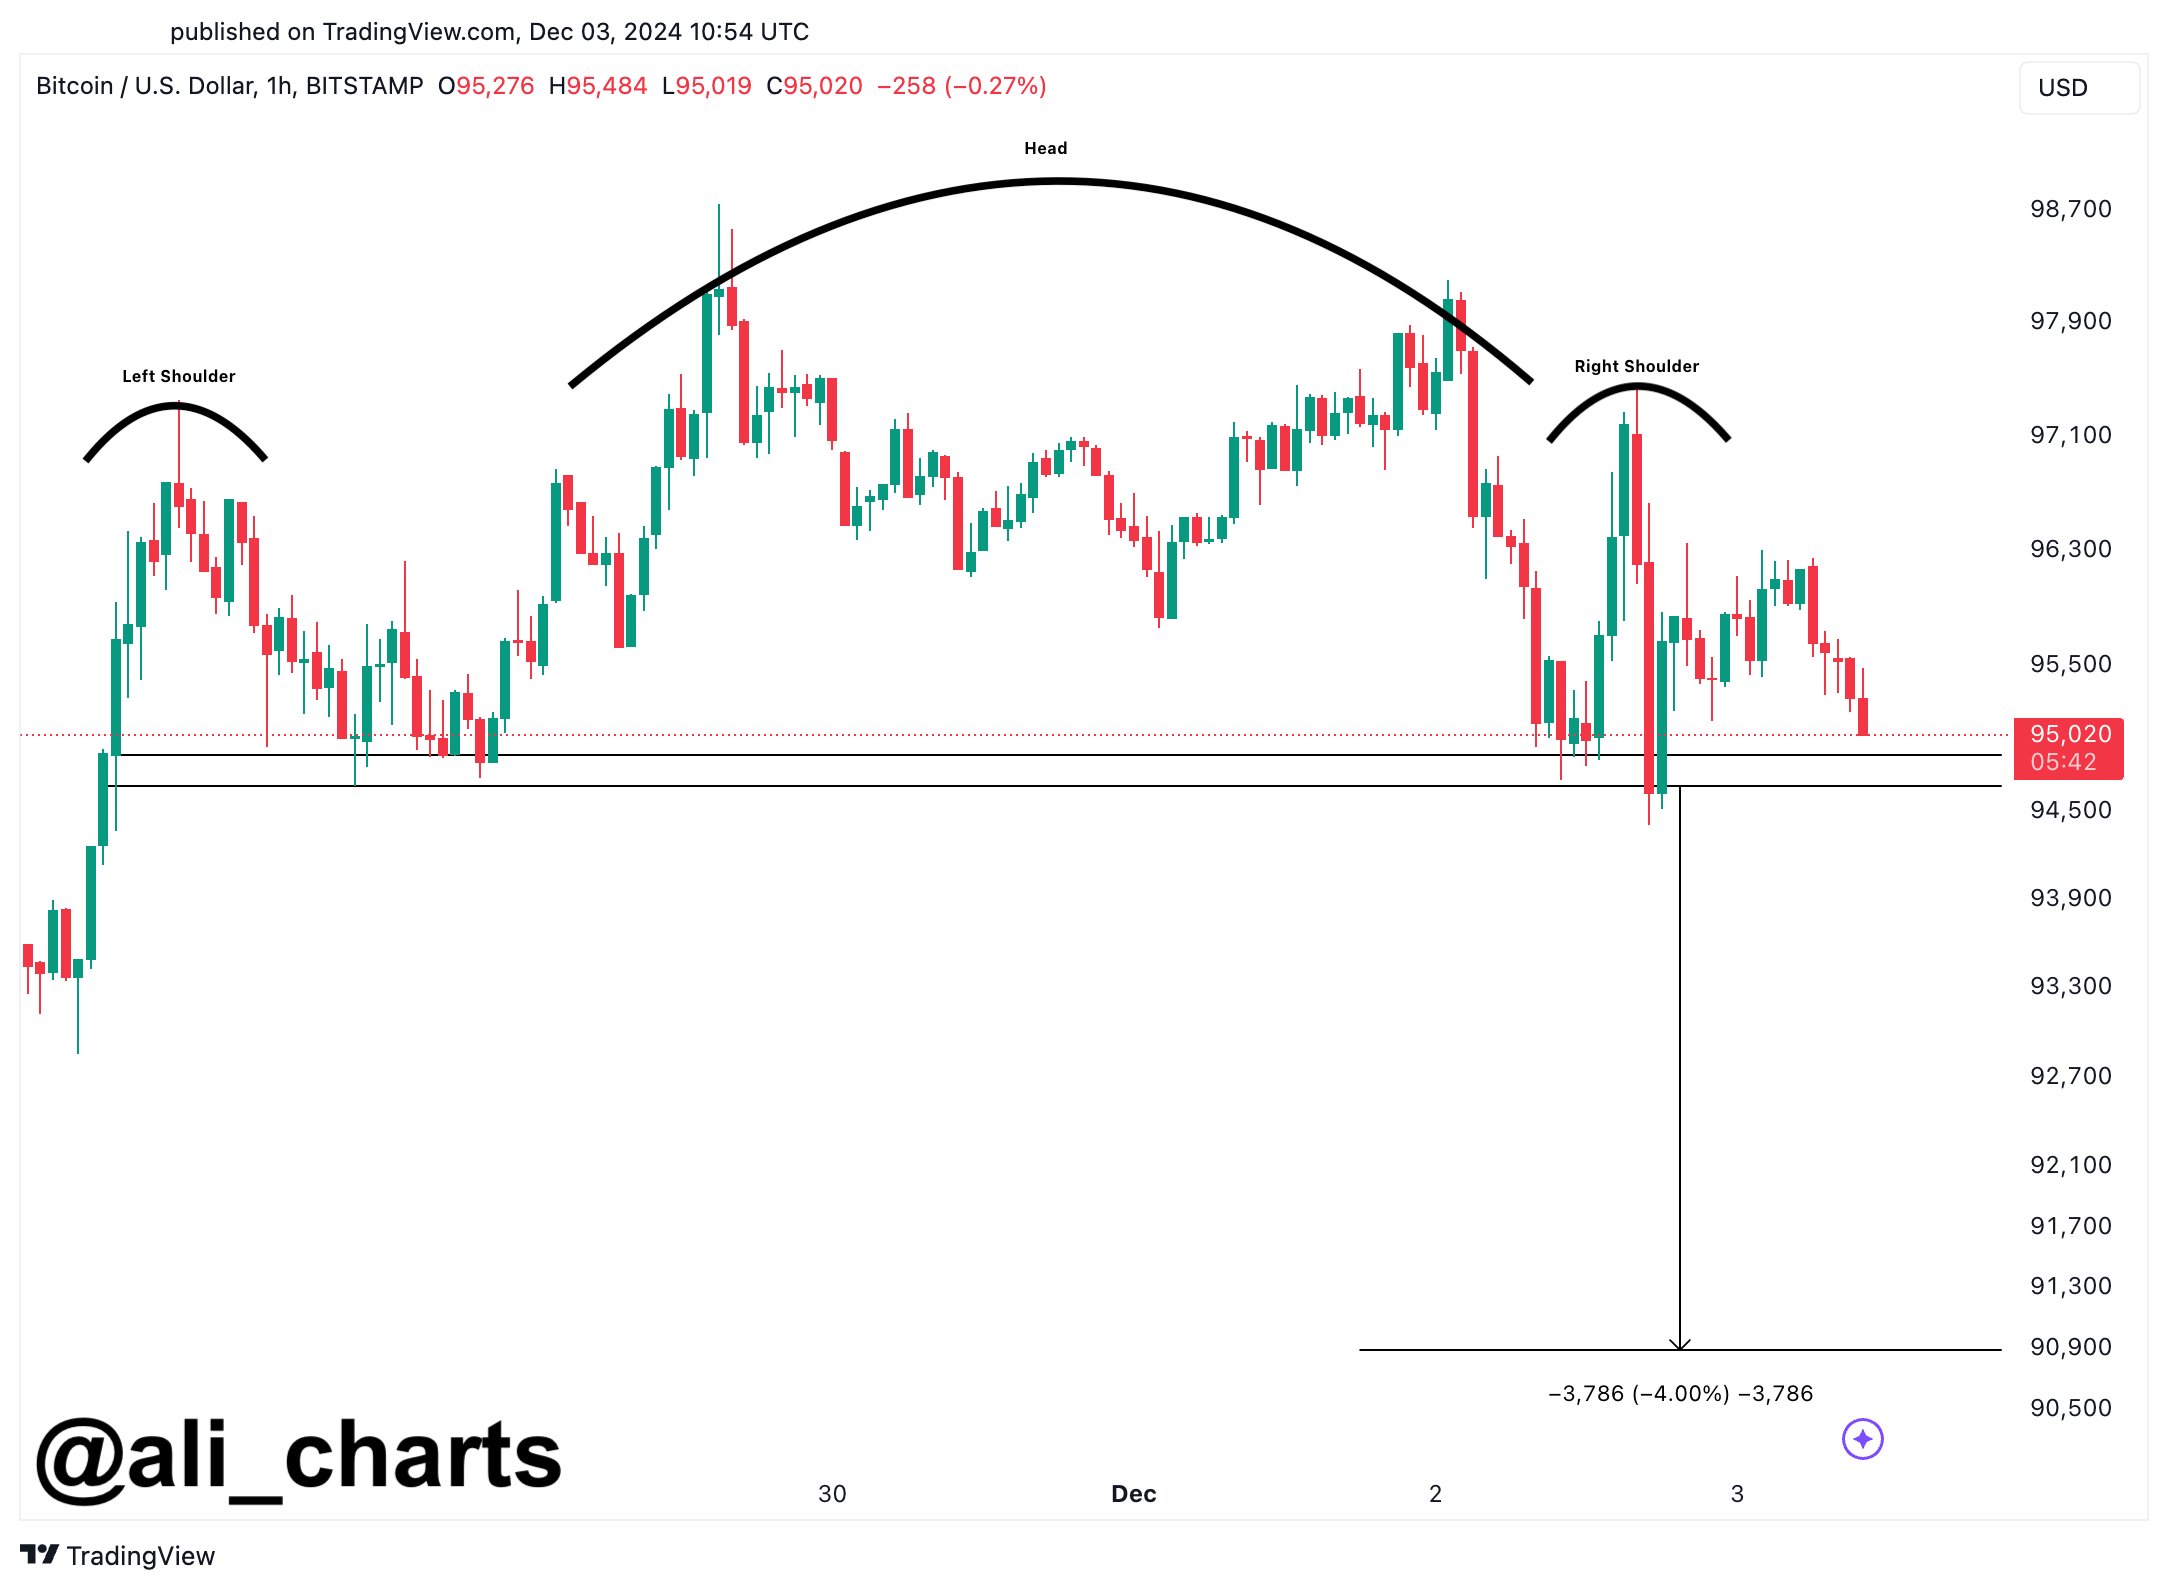
In another update, Martinez pointed out that Bitcoin’s price action was forming a head-and-shoulders pattern, a historically bearish indicator. He emphasized that this pattern further supports the likelihood of a drop to $90K. At press time, Bitcoin has dipped by 1.26%, trading at $95,110.

Image

Additionally, as Bitcoin continues to stall around the $95K mark, data from Santiment reveals that daily active wallets, whale activity, and transaction volume have all slowed over the past week. Martinez emphasized that the Bitcoin market needs a spike in these metrics for the uptrend to continue.

Bitcoin’s Bull Potential 

Amid these bearish signals, Bitcoin still has a major bullish thesis. Analysts have noted that historically, the market tends to move in the opposite direction of the prevailing market sentiments.

Essentially, as many continue to call for a $90K Bitcoin, the market could oppose this sentiment, with Bitcoin potentially breaking out significantly to the upside while many expect dips.

Martinez suggests that, in this case, the market could see Bitcoin reach $120K to $150K before experiencing its first major cycle dip of around 30%.

Bitcoin Dumped to $66,000, XRP to $1.16 in South Korea Amidst Martial Law

0

The prices of cryptocurrencies traded against the won on the South Korean exchange Upbit glitched on Tuesday following political developments in the country.

Despite growing speculations of an imminent Bitcoin crash, the pioneering cryptocurrency has held above $90,000. However, Bitcoin on the largest crypto exchange in South Korea, Upbit, crashed to $66,000 on Tuesday.

Upbit’s Cryptocurrencies Grapple

Data shows that Bitcoin and all other cryptocurrencies traded against Korea won and grappled following growing political tension in South Korea. According to the data, Bitcoin fell as low as $66,000 (88,266,000 won) before quickly recovering to trade considerably lower than the asset’s prices in other exchanges.

In addition to Bitcoin, XRP crashed to $1.16 (1,623 won) but has recovered to trade above $2.4 (3,412 won) at the time of writing. Although the assets are gradually recovering, they still trade at a discount compared to other exchanges.

XRP Upbit Crash
XRP Upbit Crash

Data from CryptoQuant shows that the Korean Premium Index has crashed to a low of -14.16. This means that Bitcoin and other crypto assets are trading at a massive discount on Upbit compared to the global crypto market.

Notably, the broader South Korean financial market, like stocks and bonds, also saw a similar scenario following the president’s martial law declaration.

For context, President Yoon Suk Yeol of South Korea declared an emergency martial law today, becoming the first to do so since the late 1980s. The leader cited growing plots among his opposition to overthrow him and deprive the country of free democracy.

Global Crypto Market Feels Heat

Meanwhile, the Upbit price dump and pump affected the global crypto market. The speculation spurred increased market sell-offs, temporarily pushing Bitcoin’s price to an intraday low of $93,619.

The market volatility also sparked a position liquidation frenzy, with over $121 million liquidated in one hour. Notably, XRP and Bitcoin topped the liquidation chart as a combined $52.78 million worth of open positions were wiped out from the asset traders.

However, Bitcoin and XRP have recovered from the sudden dip. BTC trades at $95,558, while the third-largest cryptocurrency by market cap exchanges hands at $2.529 per coin.

Expert Predicts VeChain to Claim a New ATH of $0.63

0

Amid the ongoing VeChain (VET) uptrend, a prominent market commentator expects further price growth to at least double the 2021 all-time high.

Notably, VeChain (VET) has captivated the market with an impressive rally so far in December, surging by nearly 40% within the first three days of this month.

This uptick follows its outstanding 116% rally in November, making VET one of the best performers of the month. Despite a retracement from a multi-year peak today, VET maintains the $0.06 level. As a result, analysts expect more upside in the coming weeks.

Market watcher EGRAG has forecasted that VET could potentially climb by 3,000% in the next 100 days. He based his prediction on patterns from VET’s price action, which mirrors its previous market cycles. 

VET in a Bullish Phase

According to the accompanying weekly chart, VET appears to have entered a bullish phase. The chart outlines important features that support EGRAG’s bullish outlook.

For context, last year, VET broke out of a prolonged descending channel, which spanned several years. This breakout indicated a shift in momentum. A key milestone was the Break of Structure (BOS), a bullish signal marked by the breakout above prior resistance levels.

Notably, following this breakout, VET leveraged the first phase of the bull run to hit a peak of $0.055 in February 2024. However, as the market corrected, VeChain witnessed a massive 65% from the $0.055 peak, reaching a low of $0.01890 in August 2024. 

VeChain 1W Chart EGRAG Crypto
VeChain 1W Chart | EGRAG Crypto

Interestingly, this decline mirrored a similar drop in VET’s past market cycles, as identified by EGRAG. In these previous cycles, the drop preceded a strong rally. EGRAG believes VeChain will replicate the bullish pattern from the previous cycles in the ongoing season.

Notably, since the 65% drop, the asset has embarked on an upward trajectory, reclaiming a two-year peak of $0.0720 this month. This has bolstered the market analyst’s conviction that VeChain will witness more substantial price growth.

VeChain Fibonacci Targets

For when this price growth materializes, EGRAG outlines Fibonacci levels, which serve as potential price targets for VET. With VeChain now trading for $0.06134, the first target, at Fib 0.5 ($0.06021), has already been surpassed.

From this position, the next levels of interest being Fib 0.702 ($0.11147) and Fib 1.0 ($0.27651). However, the most ambitious targets are the Fibonacci extensions: Fib 1.272 ($0.63) and Fib 1.618 ($1.58).

EGRAG stressed that a 3,000% surge from current levels would place VET near the Fib 1.272 level, doubling its previous ATH of $0.2798 from April 2021. 

Several factors also contribute to the optimistic outlook for VET. VeChain’s inclusion in Coinbase’s COIN50 Index is a major milestone. This development bolsters VET’s visibility to institutional and retail investors.

Additionally, VeChain’s strong partnerships and real-world utility add to its appeal. The blockchain platform has established itself as a leader in supply chain solutions and continues to expand its use cases, solidifying its long-term value proposition.

Tron Price Hits New ATH Above $0.24, Breaks Its 2018 Record

0

Tron (TRX) achieves a historic milestone today, setting a new all-time high (ATH) record after its price spiked by over 16% in 24 hours. 

Tron has performed incredibly well over the past few weeks. As of November 3, TRX was priced at $0.1598 per token. The token has witnessed a 50.93% spike since then to a new all-time high (ATH) record of $0.2412, according to data from CoinGecko.    

Prior to this new record, Tron’s previous all-time high was registered in June 2018, when its price surged to $0.22. However, the token waited over six years before it finally set a new record of $0.2412. 

This milestone follows a multi-week rally that began on November 12. Tron’s price surged 12.72% at the time, soaring from $0.1658 to $0.1869. Afterward, Tron registered slight gains until December 3, when it witnessed its biggest daily increase of 16.2%. This rally pushed TRX’s price to the new ATH of $0.2412. 

Massive Whale Activity 

The development comes shortly after the asset witnessed a spike in whale activity. On December 2, data from IntoTheBlock showed that large transactions worth at least $100,000 spiked 195.90% in 24 hours to 722 from the previous day’s record of 244. 

Interestingly, the total TRX traded within this period amounted to 2.04 billion tokens, representing a surge of 238.63% from the 602.42 million TRX volume on December 1. 

It is worth noting that an increase in whale activity typically drives up retail demand for the asset. 

100% Tron Addresses See Profit 

Although Tron has retraced slightly from its peak price to $0.2358, all addresses holding TRX in on-chain wallets are currently in profit. 

IntoTheBlock’s Global In/Out of Money (GIOM) indicator shows that 159.35 million addresses, representing 100% of all Tron on-chain addresses, are in the money.

Tron GIOM Indicator
Tron GIOM Indicator

Amid the price surge, Tron’s market cap also increased to $20.9 billion today, marking a new ATH valuation for the asset. Despite retracing to $20.57 billion, Tron still ranks as the 12th biggest cryptocurrency on CoinGecko, ahead of Toncoin (TON), which boasts a market cap of $16.77 billion.

Bitcoin ETFs Almost Equal Satoshi Nakamoto’s Stash as Demand Heightens

0

The US spot Bitcoin ETFs are nearing a significant milestone, with their holdings almost equaling founder Satoshi Nakamoto’s Bitcoin stash.

Notably, the US Bitcoin ETFs have been a gamechanger for the crypto sector since their launch on January 11. The investment vehicles have spurred Bitcoin’s price upsurge while turning the pioneering cryptocurrency into a mature asset class.

Since their market debut, Bitcoin ETFs have been one of the fastest-growing funds, with two of them entering the top ten biggest ETF funds launched this decade. As of December 2, the US Bitcoin ETFs have seen a cumulative inflow of $31.06 billion.

Bitcoin ETFs Near Satoshi Nakamoto’s Bitcoin Holdings

Meanwhile, these investment products’ impressive exploits have drawn them closer to a notable milestone. The funds are now a few BTC tokens away from topping founder Satoshi Nakamoto’s stash of the premier asset.

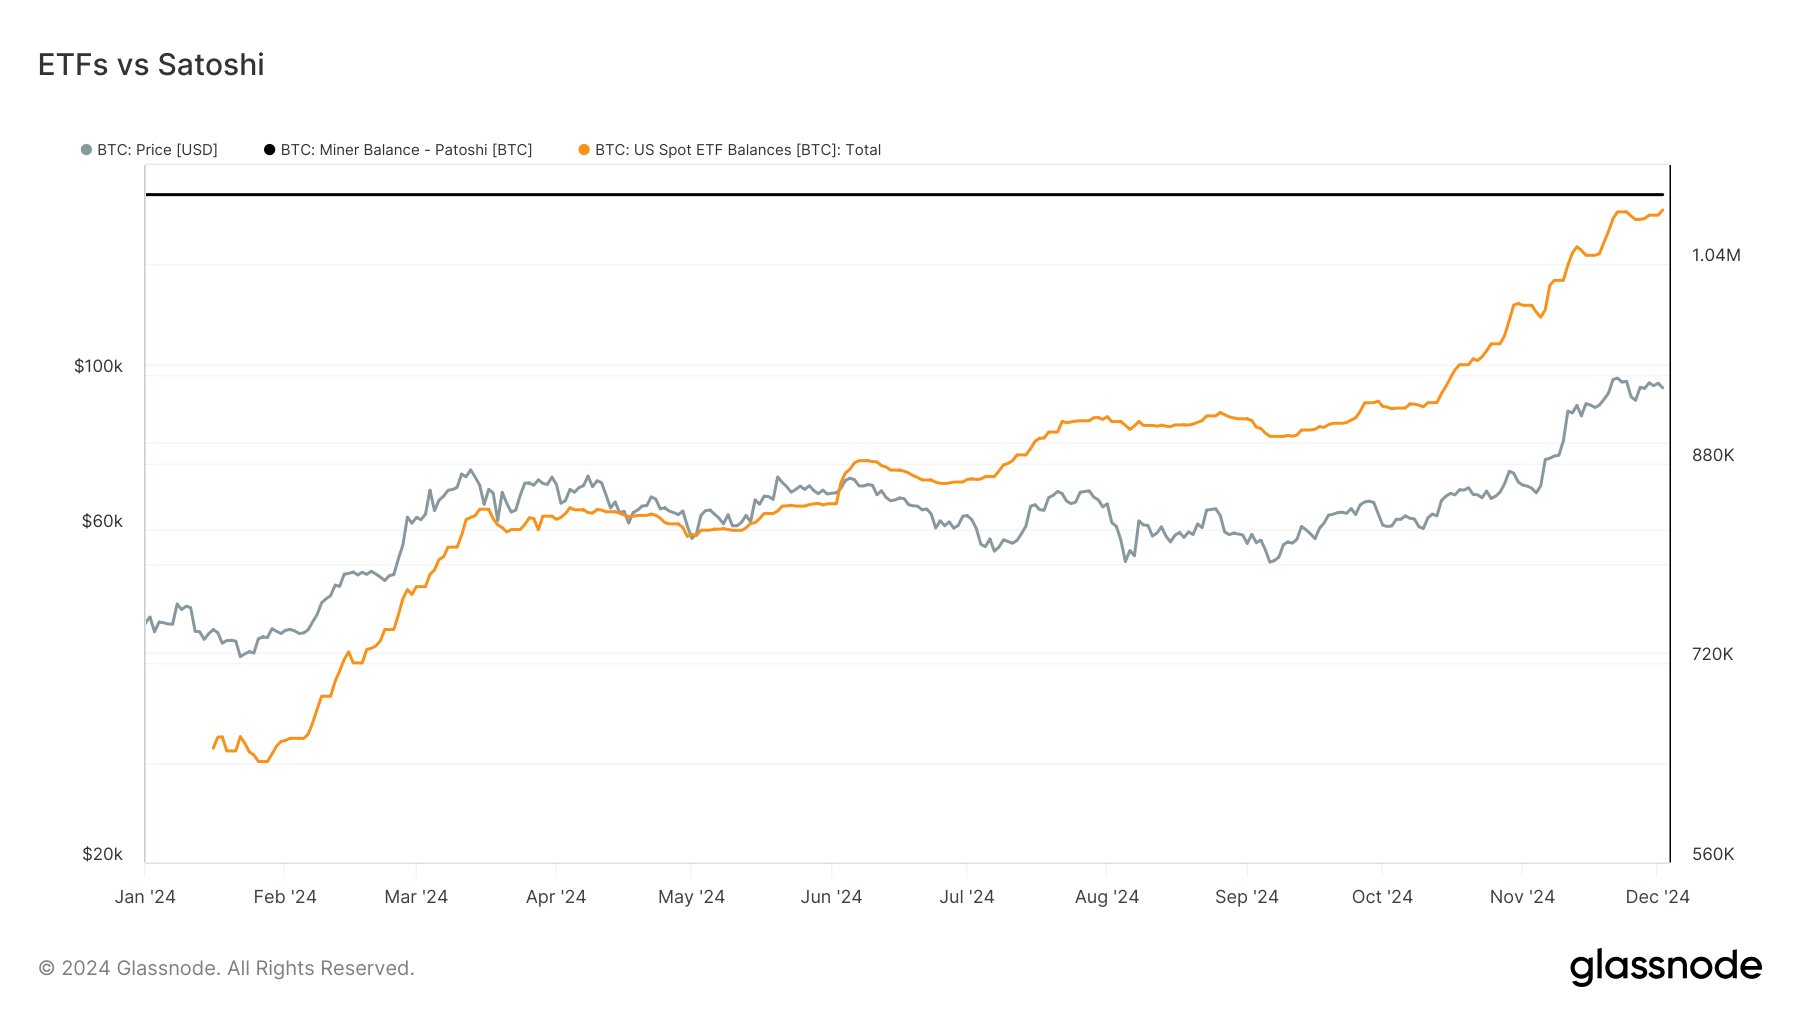
According to data, the pseudonymous founder holds over 1 million BTC, specifically 1.096 million of the asset. Satoshi Nakamoto is the largest Bitcoin holder, keeping a staggering 5.22% of the asset’s total supply cap.

Bitcoin ETFs vs Satoshi

However, the US spot Bitcoin ETFs are already looking to upset the founder’s years-long accolade. Having surpassed Michael Saylor’s MicroStrategy earlier in the year, the funds are 13,000 BTC tokens away from reaching Satoshi’s.

Per Sosovalue, the spot ETFs’ $353.67 million inflow on Monday brought their total holdings to 1.083 billion BTC. Interestingly, the products would need an inflow worth $1.23 billion at the current market price to reach the impressive milestone.

BlackRock’s ETF Surpasses 500,000 BTC

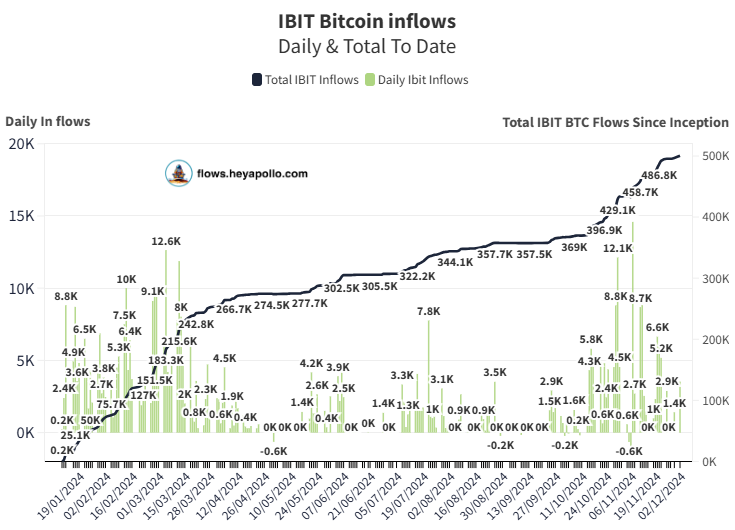
More particularly, BlackRock iShares Bitcoin Trust’s (IBIT) Bitcoin holdings have also surged to a remarkable level. On Monday, the leading issuer acquired 3,525 BTC ($338.33 million), taking its stash above the landmark figure.

IBIT Inflows

Notably, IBIT has seen a cumulative inflow of $32.08 billion since its inception and now holds a net asset of $48 billion. Impressively, this is still above MicroStrategy’s 402,100 BTC as of December 2.

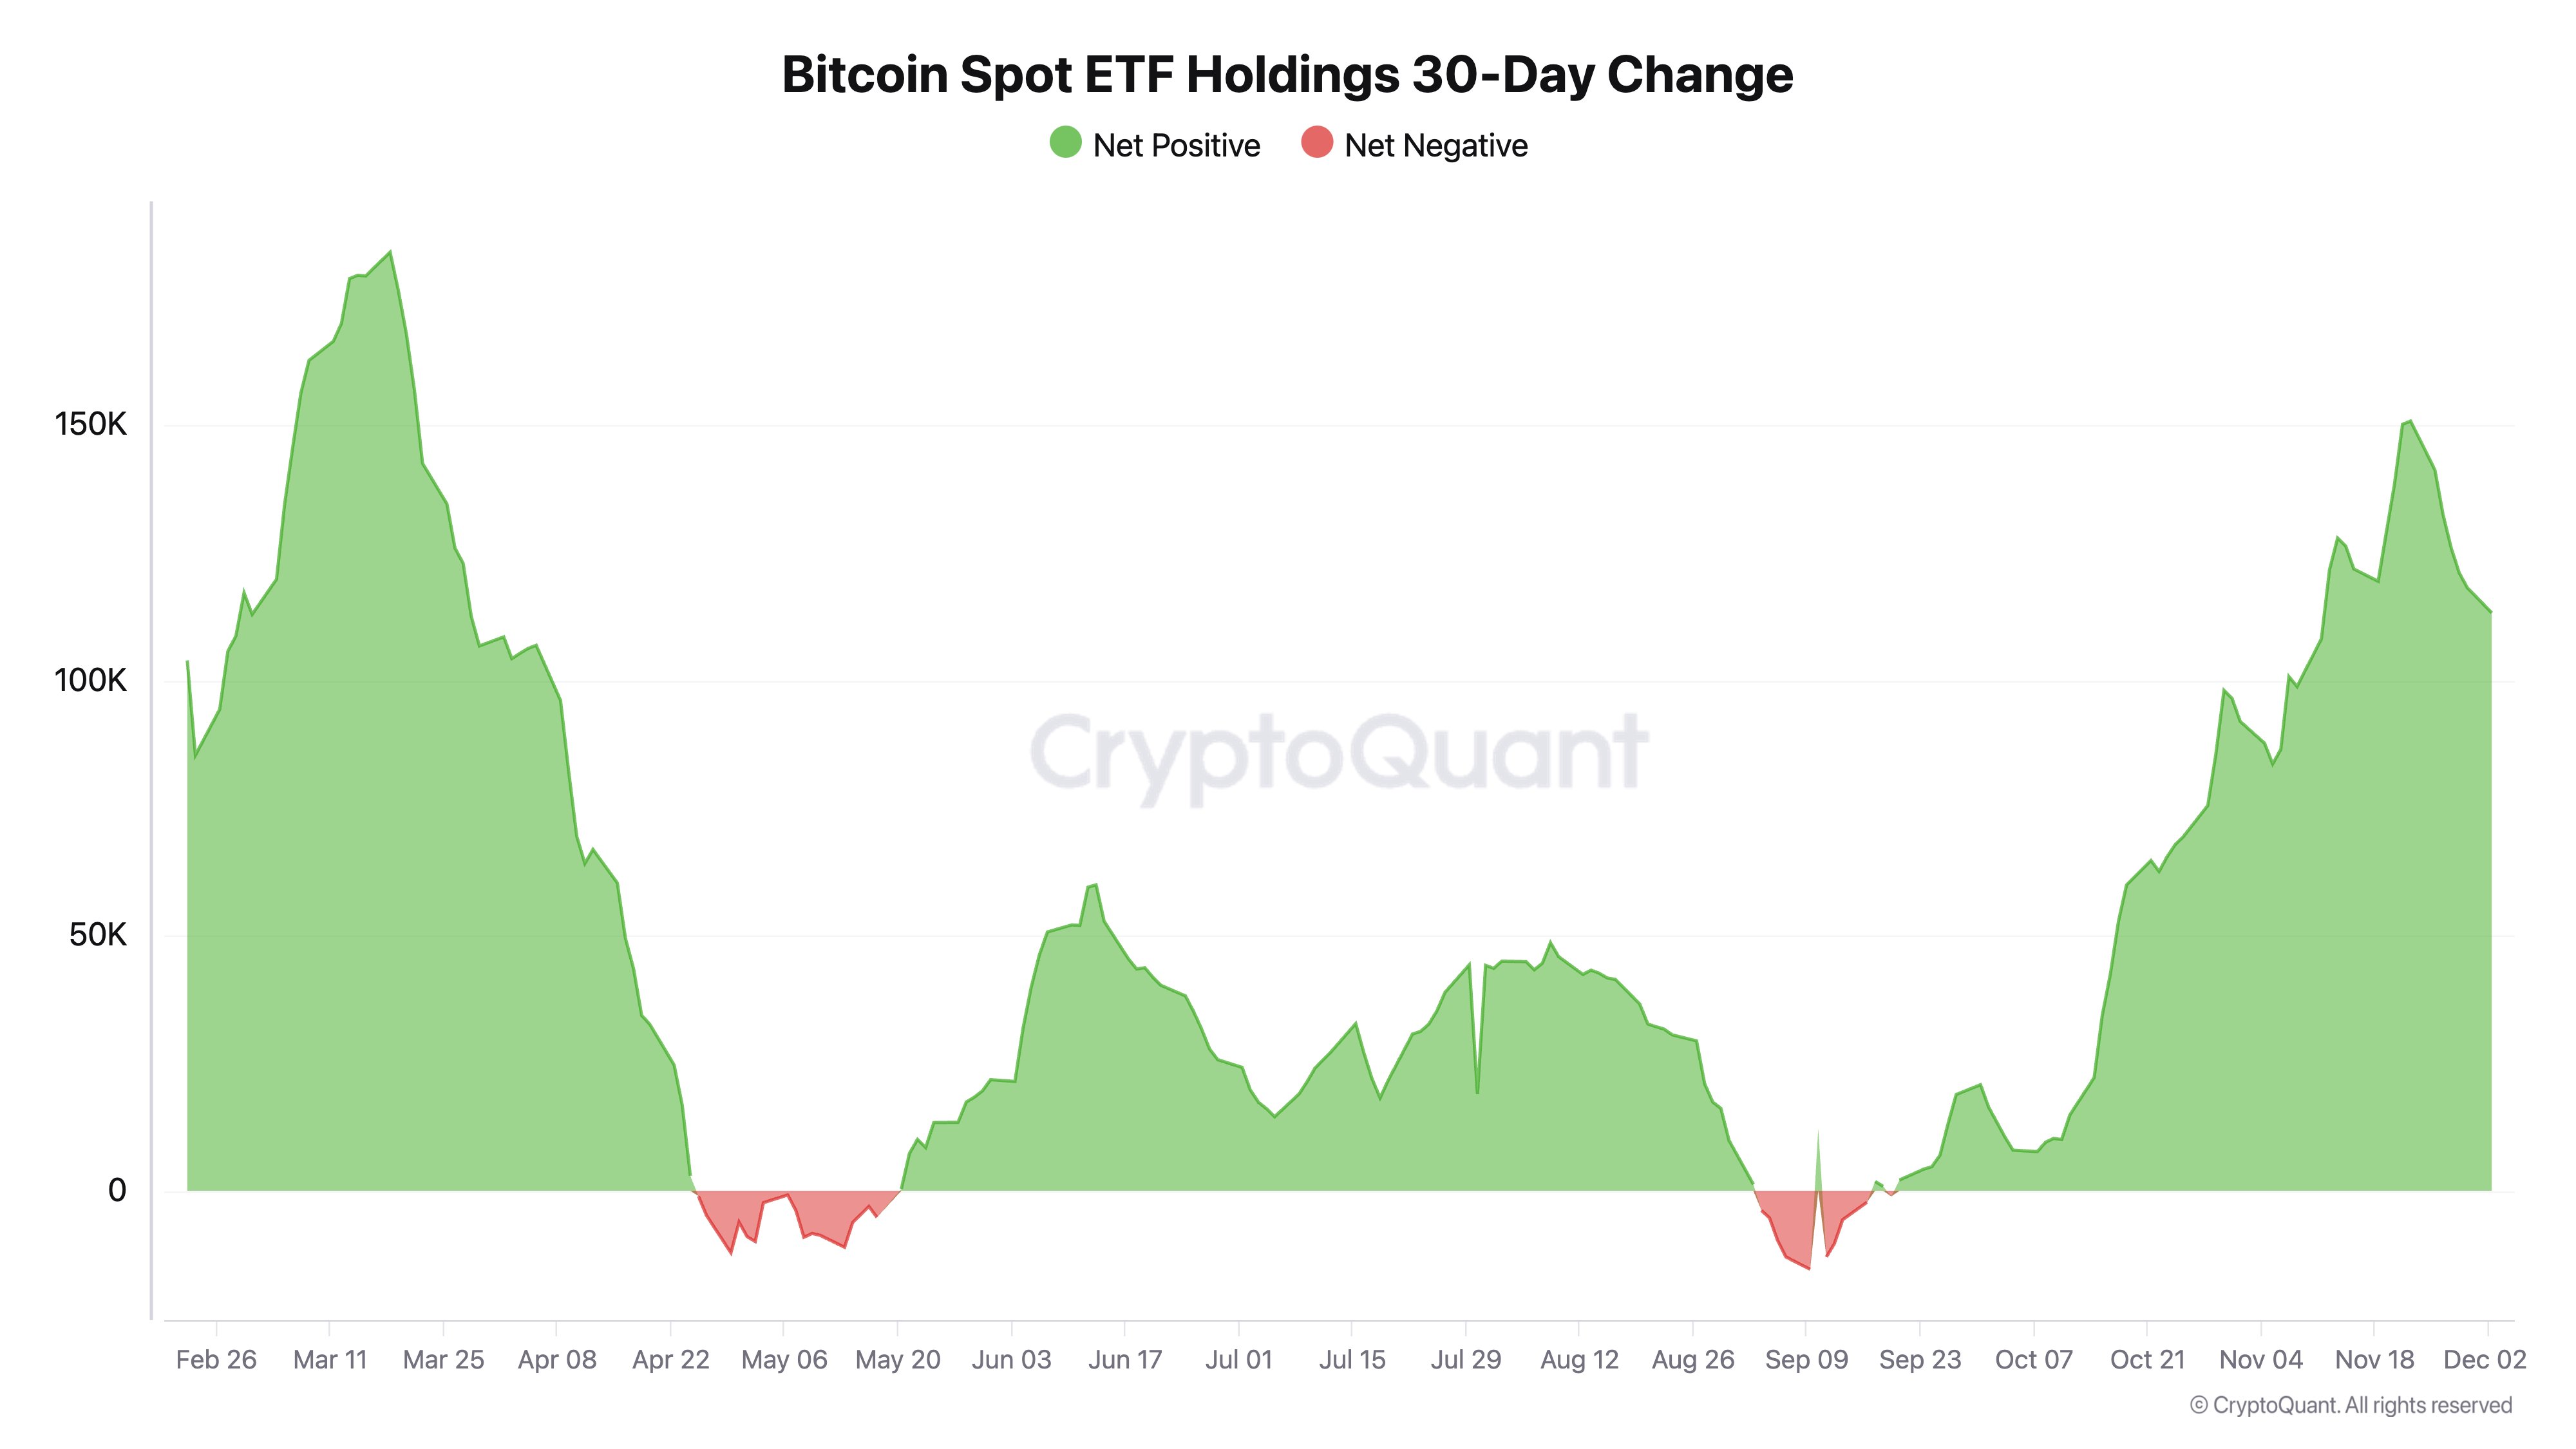
Meanwhile, the buzzing US spot ETF inflows mirror growing traction for the funds. In a tweet today, CryptoQuant’s CEO Ki Young Ju shared an analysis showing that demands for the investment vehicles have reached the levels seen when they first made their market debut in January.

An accompanying chart shows that the net positive 30-day change in Bitcoin spot ETF holdings recently reached the 150K BTC mark. Notably, the funds had a turbulent time between April and May and in September as outflows dominated the scene.

Bitcoin ETFs 30-day Change

However, investors have rekindled their interest in the products following Donald Trump’s November election win. On the back of the victory, the Bitcoin ETFs recorded a single-day net inflow of $1.37 billion on November 7, their largest since inception.

Chainlink Stages Major 33% Comeback, Eyes $30 Target

Will the parabolic moonshot in Chainlink (LINK) prices reach $29 this week following the 33% jump last night?

The DeFi market cap is approaching $150 billion, currently at $144 billion. Amid the growing DeFi sector, Chainlink is one of the top performers.

With a 26% surge in the past 24 hours, Chainlink’s market cap has now surpassed a $15 billion valuation. Will this parabolic rise push the price above $30 in December? Let’s explore.

Chainlink Weekly Price Performance 

On the weekly chart, Chainlink’s price action shows a breakout rally gaining momentum after a trendline breakout. Similar to a previous trendline breakout during the 2022-23 crypto winter, this current rally is accompanied by significant momentum.

Chainlink Weekly Price Chart

Additionally, with increased buying pressure, LINK’s price trend is now marking its third consecutive bullish week. Chainlink prices have risen nearly 80% in the past 16 days.

The rally began at $13.76 and has now reached a market price of $24.81. On the weekly chart, the positive alignment of the EMA lines and the MACD indicator indicates a bullish long-term trend.

Moreover, this week’s recovery rally has surpassed the 61.80% Fibonacci level at $21.66. As a result, Chainlink’s bull run is now set to challenge the immediate resistance at the 78.60% Fibonacci level of $31.96.

Chainlink Price Analysis Targets $29.21

On the daily chart, Chainlink’s price action shows the formation of a new 52-week high following a 33% surge last night. It is currently testing the 1.272 Fibonacci level at $25.01 and facing an intraday pullback.

Chainlink Price Chart

The 2.18% intraday pullback signals minor bullish exhaustion after the massive bullish engulfing candle. The surge in buying pressure has led to a bullish crossover between the 100-day and 200-day EMA lines.

Additionally, a bearish crossover between the MACD and signal lines has been avoided, which confirms the continuation of the bullish trend. As a result, the surge has triggered a buy signal from the technical indicators.

The daily chart analysis suggests a price target at the 1.618 Fibonacci level of $29.21. However, if the broader market loses momentum, a potential retest of the $21.71 breakout level could occur.

Here are 3 Reasons XRP Is Rising, Ripple CEO Shares His View

0

Amidst the XRP price explosion, analysis has identified the three likely factors spurring the asset’s recent surge to multi-year highs.

XRP has recently become one of the brightest crypto assets, drawing attention from market spectators and speculators alike. For context, the asset has surged over 400% in the past month, surpassing its price peak in the last cycle.

Amidst the surging traction, questions about the asset’s driving force have emerged. With investors growing increasingly curious about what is behind the recent XRP face-melting price upsurge, here are three substantial reasons.

Gensler’s Resignation

The XRP Ledger (XRPL) native token has been one of the biggest beneficiaries of the planned resignation of the Securities and Exchange Commission (SEC) chair Gary Gensler. For context, XRP broke past a three-year price high of $1.40 after the unpopular regulator’s boss announced he would leave office in January 2025.

After XRP trumped Solana and USDT to become the third-largest cryptocurrency, Ripple’s CEO Brad Garlinghouse shared his thoughts on the remarkable achievement. In a tweet, Garlinghouse tied the XRP’s recent form discovery to Gensler’s resignation, noting that “after Gensler, all boats rise.”

Ripple’s CLO Stuart Alderoty also shared the same narrative. After XRP’s push past the $150 billion market cap, he mentioned that it seems the SEC has been the sole proprietor of the prolonged price suppression seen in the crypto market.

Koreans Steering XRP’s Explosion

Meanwhile, data shows a chunk of XRP’s trading volume since it resumed its bullish upsurge has come from South Korea. On-chain analytical firm Scopescan indicated that Upbit played a crucial role in the XRP price uptick, as a considerable amount of the asset’s liquidity came from the exchange.

Per Scopescan’s analysis, the 24-hour trading volume on Upbit’s XRP/KRW spot pair surged to $3.8 billion, accounting for almost 30% of the exchange’s total volume. Notably, this staggering trading activity on XRP was 11 times that of Bitcoin and also beats the XRP volume on Binance, the largest crypto exchange by volume.

Furthermore, Bithumb, another South Korean exchange, also saw a similar trend. On Bithumb, XRP’s trading volume surged to $1.12 billion, accounting for 32% of its total volume.

XRP Trading Volume Per Exchange

Meanwhile, other exchanges also saw increased trading traction towards the third-largest cryptocurrency by market cap. For instance, XRP’s trading volume on Coinbase accounted for 22.29% of the exchange’s 24-hour volume, beating that of Bitcoin by three and a half times.

Massive Accumulation from Coinbase

CryptoQuant’s CEO Ki Young Ju also shared another propellant of the XRP price surge. He tweeted that XRP whale accumulation on Coinbase was a major driving force in the latest rally.

Young Ju argued that in the past 30 days, the Coinbase XRP Premium—an indicator of buying pressure on an exchange—has ranged between 3% and 13%. Meanwhile, Upbit’s premium has remained almost insignificant, indicating that most of the XRP accumulation spree came from Coinbase.

XRP PremiumIn the meantime, XRP trades at $2.62, up 8% in the past 24 hours.

Fundstrat’s Tom Lee is Confident Bitcoin Will Surpass $100,000 by Year End

0

Tom Lee remains optimistic Bitcoin will exceed $100,000 by the end of the year, predicting a major pump after defeating the psychological barrier.

Bitcoin has experienced significant price fluctuations recently, resembling a rollercoaster ride. After dipping below $91,000 last Tuesday, the cryptocurrency quickly bounced back above $98,000.

However, resistance at this level has prevented Bitcoin from surpassing the $100,000 threshold. While the market navigates these ups and downs, experts remain divided on Bitcoin’s near-term potential.

Tom Lee, the Chief Investment Officer at Fundstrat Capital, reiterated his bullish stance on Bitcoin during an appearance on CNBC. He confirmed that Bitcoin is facing a psychological barrier around the $100,000 level, as it is a key point of interest for market participants.

Despite this, Lee remains confident that Bitcoin will close the year at six figures. He emphasized that if Bitcoin breaks the $100,000 threshold, a major surge could follow, attracting more traders.

Meanwhile, Lee’s outlook extends beyond the immediate price action. In a separate interview on November 29, he predicted that Bitcoin could reach $250,000 within the next 12 months. He linked this forecast to historical trends, noting Bitcoin’s substantial price increases following previous halving cycles. 

Lee also pointed to shifts in U.S. political support for cryptocurrencies, suggesting that Bitcoin could benefit from increased legitimacy, particularly if the U.S. government begins accumulating Bitcoin as part of its strategic reserves. He believes that institutional adoption, exemplified by companies like MicroStrategy, will also play a significant role in driving Bitcoin’s price upward.

Bearish Sentiment Amidst Market Optimism

While Lee’s outlook remains bullish, other analysts, including Ali Martinez, have raised concerns about Bitcoin’s short-term price trajectory. Martinez acknowledged the ongoing bearish narrative within the market, citing various indicators of a potential correction. However, he maintains that Bitcoin’s long-term outlook remains positive.

Several prominent figures, such as Sheldon the Sniper and Robert Kiyosaki, have also expressed caution regarding Bitcoin’s future. Sheldon forecasts a possible downturn that could push Bitcoin below $90,000, attributing this to recent bearish candle closures. While maintaining his belief in Bitcoin’s eventual rise to $250,000 by 2025, Kiyosaki warned of a potential drop to $60,000 before any rebound occurs.