Home Blog Page 1146

Cardano Founder Says He Has Spent $450 Million From His Pocket on the Cardano Ecosystem

0

Cardano founder Charles Hoskinson has made a shocking financial revelation, disclosing that he has spent $450 million from his own pocket on the ecosystem.

Despite mounting critiques, Hoskinson has continued to discuss his commitment to the Cardano ecosystem, a project he founded in 2017. He has incessantly addressed the network’s issues and has always warded off external skepticism about the ecosystem.

In a recent podcast, Hoskinson addressed the issue of transparency demands for his firm, Input Output Hong Kong (IOHK). He responded to a Reddit thread calling for the public disclosure of the software development firm’s financial balance sheet, claiming it is a public company.

The Cardano founder noted that IOHK was a privately owned software company. Hence, the demand for details of its profits and losses was out of place.

Hoskinson Highlights Personal Sacrifice for the Cardano Ecosystem

While addressing the transparency issue, Hoskinson reflected on the financial implications of Cardano’s creation. In a short video shared by Plutus Staking on X, the founder noted that he and “lots of other people” spent $36 million in Bitcoin and $6 million worth of ADA at the market price at the time, aggregating to $38 million in payments on Cardano’s development contract.

Hoskinson further revealed that he has spent $450 million from his own pocket to fund the ecosystem’s development. 

Comments Spark Community Reactions

Hoskinson’s $450 million investment disclosure got tongues wagging in the Cardano community. Users applauded his sacrifice and commitment to the ecosystem, while others raised skeptical points from his comments.

For instance, the TapTools team praised Hoskinson’s commitment to Cardano. The native analytics platform’s X handle noted that the founder “has been all in” for quite a while now, which is bullish for the ecosystem.

Another user quizzed where Hoskinson got the money, asking if it was from the 70% Ethereum pre-mine. However, in a response, Plutus Staking asserted that the funds might be part of his IOG profits or an earlier $500 million gain he disclosed making from Bitcoin.

Meanwhile, Hoskinson has recently been on the edge with the Cardano community. He announced on November 3 that he was taking a break from X due to growing toxicity among proponents.


Shiba Inu Cautions Community on When SHIB Can Be a Red Flag

0

Shiba Inu ecosystem team member DaVinci issues a new warning to its community, revealing how SHIB can become a major red flag. 

In an X post yesterday, DaVinci, a pseudonymous Shibarium Discord admin, warned that scammers could use the name ‘SHIB’ to perpetrate malicious activities. He clarified that just because a token has SHIB in its name does not mean the project is safe. 

Using SHIB to Promote Random Sh*tcoin Is a Red Flag 

DaVinci suggested that it is a big red flag when a team uses SHIB to promote and sell random and unknown sh*tcoins. Furthermore, the Shibarium Discord admin revealed that a group of scammers has been leveraging this tactic to sell new sh*tcoins monthly. 

He stated that these coins are almost worthless, eventually losing 80-90% of their value. Nonetheless, DaVinci said the scammers are not relenting as they prepare to introduce the next sh*tcoin, leading to recurring losses for unsuspecting investors.  

Notably, the Shiba Inu ecosystem team member advised the Shiba Inu community members to avoid waiting until the fourth ‘rug pull’ before figuring out the pattern.

Shiba Inu Team Continuous Warning 

DaVinci’s message marks the latest warning the Shiba Inu ecosystem team has issued to the community over the past week.

Last week, Shiba Inu’s lead developer, Shytoshi Kusama, and the project’s marketing lead, Lucie, issued a new warning about TREAT. They warned that the token has not been launched, indicating that any token mimicking it is fake. 

Also, Kusama revealed how scammers have been using his engagement with the community to promote and sell illicit tokens. Specifically, these malicious actors purchase X accounts Kusama follows and then use them to promote fake tokens. 

Furthermore, Shiba Inu’s community-driven channel Susbarium issued an important warning after the team behind a new cat-themed memecoin, Shiro Neko (SHIRO), burned $100,000 worth of SHIB. The move is part of Shiro Neko’s marketing strategy to get the attention of SHIBArmy. 

Unmoved by the hefty SHIB burn, Susbarium cautioned the community to first conduct due diligence on the project before investing. Furthermore, the channel shared some safety tips, like understanding SHIRO’s tokenomics and promotional strategy, to help investors evaluate and decide whether the token is safe. 

As scammers continue to target the Shiba Inu community, it is imperative to always conduct due diligence on any new project and stick to official channels to get relevant information regarding new developments within the ecosystem.

Will Tron Hold at $0.1597, or Will a Rising Wedge Trigger a Drop to $0.1463?

As the chances of a rising wedge breakdown increase, Tron is approaching a crucial crossroads at $0.1597. Will buyers manage a bullish turnaround, or is a further decline imminent?

With the crypto market chaos resulting in massive ups and downs in altcoins, Tron is currently moving downwards. Failing to cross the $0.1686 barrier, the TRX price fall warns of a crash under $0.160. 

Additionally, the high-risk breakdown of a rising wedge pattern on the daily chart could lead to a nearly 10% decline in Tron. The key question is: will the bulls step in and reverse the trend at the $0.1597 support level?

Tron Price Analysis

On the 4-hour chart, Tron’s price action shows a failed attempt to break above the $0.1686 resistance. This failure has resulted in an evening star pattern and six consecutive bearish candles.

Tron price chart
Tron price chart

The bearish price movement has caused a 4.29% drop from the $0.1693 level to the current market price of $0.1620. The downward trend is approaching a short-term support trendline near the 23.60% Fibonacci retracement level at $0.1597.

On a larger scale, the prevailing uptrend in TRX’s price action reveals a rising wedge pattern. Within this wedge, the recent reversal has formed a double top and established a neckline at the $0.1463 level.

The increasing bearish pressure has caused a negative crossover between the MACD and its signal line on the 4-hour chart. Additionally, the MACD histograms are showing a surge of negative momentum, and the RSI has fallen below the 50% mark. These technical indicators suggest a growing influx of selling pressure.

Will Tron Sustain Above $0.1597?

Using the trend-based Fibonacci retracement, a potential reversal from the 23.60% level ($0.1597) must surpass the 38.20% Fibonacci level of $0.1686 for an uptrend continuation. While the upside chances are low, the broader market recovery could propel the Tron prices higher. 

In such a case, the next resistance levels for TRX are present at the 50% and 78.60% Fibonacci levels priced at $0.1762 and $0.1959, respectively. 

A breakdown below the local support trendline will likely complete a double-top pattern, which could result in a massive fallout for Tron. A downfall below $0.1597 will plunge the asset to $0.1463, a nearly 10% drop. 

Bitcoin Bulls and Bears Battle It Out Amid Election Frenzy: $100K by Year-End?

0

This week could mark a pivotal moment for Bitcoin and the altcoin market, with analysts suggesting a strong possibility of new all-time highs. 

This bullish hope comes amid heightened market volatility tied to the U.S. presidential election and the upcoming Federal Reserve interest rate decision.

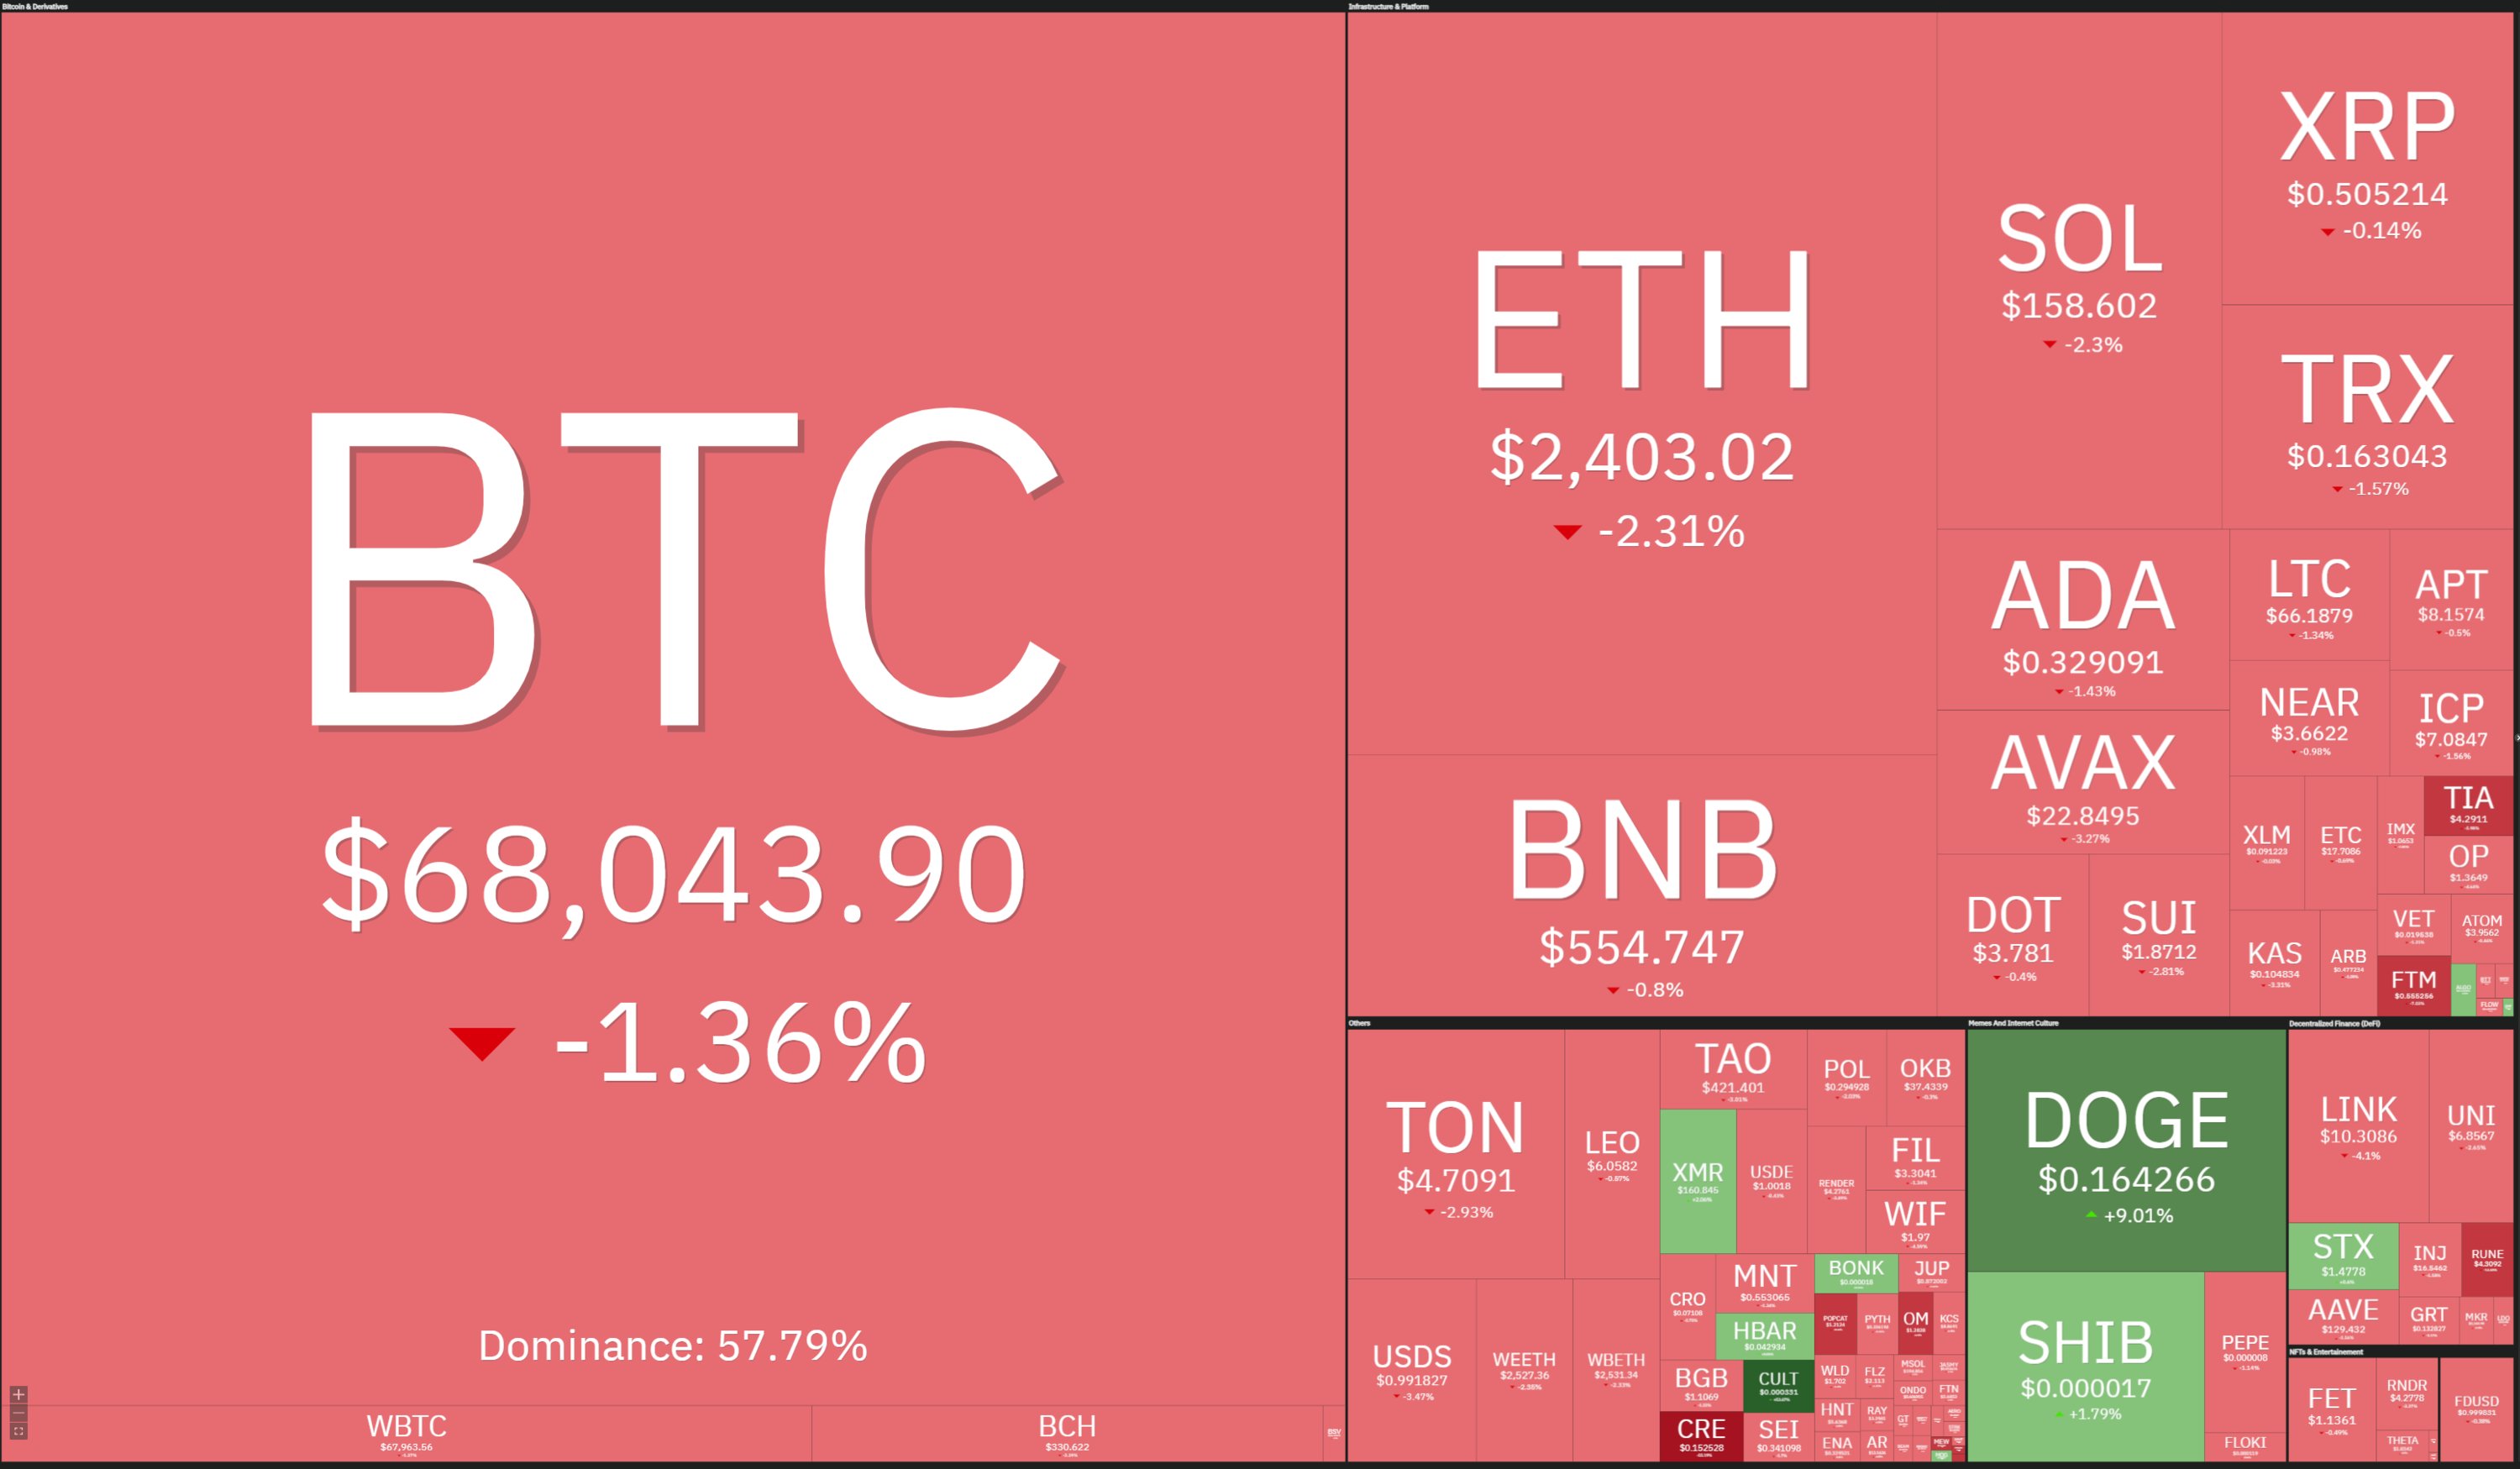
At the time of writing, Bitcoin is trading at $68,649, recovering from last night’s massive drop to $66K. 

Image
Bitcoin and altcoin dip over the past day

Bullish Sentiment: Bitcoin’s Path After the Election

Market commentators are split on Bitcoin’s trajectory post-election, but overall sentiment remains largely bullish. Analysts are hopeful that the current volatility could mark the beginning of a sustained upward trend for Bitcoin.

In a post on X, analytics resource Spot On Chain noted that this week’s market conditions are some of the most volatile of the year, driven by the election and the upcoming Federal Open Market Committee (FOMC) meeting.

Despite this uncertainty, Spot On Chain suggested that Bitcoin’s long-term bull rally could be just beginning. It highlighted that historically, major bull runs tend to gain momentum after the U.S. elections. 

The firm believes that Bitcoin will likely maintain its upward trajectory regardless of whether Donald Trump or Kamala Harris wins the presidency. Remarkably, Spot On Chain predicted that Bitcoin could hit $100,000 by the end of the year.

Another well-known analyst, Daan Crypto, also anticipates significant price movement for Bitcoin. He forecasted at least a 10% swing in either direction, depending on the election outcome. While Daan noted that this week’s Bitcoin chart does not display an ideal weekly candle, he believes the election will be a key catalyst for price action.

Bearish Concerns: A Potential Post-Election Sell-Off?

However, not all traders expect a smooth path for Bitcoin in the short term. QCP Capital, a trading firm, warned its Telegram subscribers of a potential sell-off after the election. The firm compared the likely outcome to the “sell-the-news” response that followed the Nashville Bitcoin Conference. 

QCP noted that market betting odds have shifted, with Trump currently favored to win the presidency, although his chances have decreased slightly over the weekend.

Notably, the odds are 57% for Trump versus 43% for Harris. Nonetheless, the firm believes that no matter the election outcome, a “sell-the-news” reaction could trigger a price pullback in Bitcoin.

The Federal Reserve’s Rate Decision

Adding to this week’s volatility, the Federal Reserve’s upcoming interest rate decision on November 7 has attracted significant attention.

The Fed faces a challenging environment, balancing inflation concerns with recently weaker job data. Currently, markets expect a 0.25% rate cut, which, if implemented, could support risk assets like Bitcoin.

Market Veteran Says He Didn’t Cause Cardano to Fall

0

Veteran trader Benjamin Cowen has defended himself following criticisms that he caused the price woes Cardano faces after his accurate prediction.

After veteran analyst Cowen’s Cardano assertion came to fruition, he has faced severe criticisms from ADA bulls. For context, the ITC Crypto founder forecasted in August 2023 that ADA would capitulate against Bitcoin, targeting the 400 SATS price mark.

Notably, his predictions came to fruition in October as ADA/BTC traded at $0.0000049, an equivalent of 490 SATS. Meanwhile, the trading pair has fallen further since then, exchanging hands at 481 SATS at the time of writing.

Analyst Face Criticisms

Following the realization of his predictions, Cowen and Altcoin Daily took to X to notify their audience that his speculation had come to fruition. Notably, Cowen taunted skeptics who critiqued his forecast, asking if they still needed a comment.

Since then, Cardano bulls have bashed Cowen for his “involvement” in ADA’s fall. The analyst noted that a particular X user, “cardano whale,” has blamed him for causing the capitulation of the 11th cryptocurrency by market cap.

According to a picture Cowen shared, the user implied that he repeatedly shilled a Cardano capitulation to his nearly 1 million X followers and on YouTube, influencing sentiments around the asset. The user blamed Cowen for the downtrend, stating he was “part of the machine.”

Meanwhile, the market veteran has defended himself, noting that his large audience didn’t mean he caused Cardano’s fall against Bitcoin. He further insisted that being wrong on one’s speculation was part of the game, and instead of blaming others, the analyst should take responsibility.

Community Reacts

Cowen’s Monday post sparked further reaction from the crypto community, particularly ADA proponents. A user argued that having over 800,000 followers and a good reputation could influence investor rationale on an asset. 

He noted that people often listen to notable analysts and make investment decisions. However, Cowen replied that despite his large audience, he still gets speculations wrong, so the concept that he influenced ADA’s price was untrue.

Meanwhile, another user shared a similar encounter with the Cardano bull dragging Cowen for his Cardano analysis. He noted that the same influencer called him out on his analysis, touted him, and blocked him.

Notably, ADA followed a broader market correction yesterday, trading at $0.3311 at the time of writing. The asset is down 4.61% in the past seven days and 5.18% month-over-month.

Is Cardano Poised for a Double-Bottom Reversal to $0.41?

After a brief 3-day bear run, Cardano (ADA) is eyeing a potential double-bottom reversal, which could see the price bounce back to $0.41.

Amid a refreshing recovery run in the crypto market after multiple correction days, Cardano also marks a reversal. The intraday recovery increases the chances of reversal for Cardano with a double-bottom reversal. 

Will this bullish trend in Cardano bounce back from the crucial support zone near $0.324? Let’s find out. 

Cardano’s Double Bottom Reversal

In the 4-hour chart, the Cardano price action shows a sideways trend. Furthermore, the bearish influence over the consolidation range is gradually increasing, warning of a bearish breakdown. 

Cardano price chart
Cardano price chart

Recently, Cardano broke below the $0.331 support zone for the second time in the past 10 days. This bearish outcome follows a double-top reversal at the $0.36 resistance level, which aligns with the 50% Fibonacci retracement.

The downturn led to three consecutive days of bearish closes, resulting in an 8.94% drop from $0.358 to $0.326. As of now, Cardano has shown a modest intraday recovery of 1.23%, taking support near the $0.324 zone.

This recovery has completed a morning star pattern, and the price is testing the previously broken $0.331 support level. More importantly, this setup hints at a potential double-bottom reversal, with $0.324 acting as the baseline.

Additionally, the MACD and signal lines are close to crossing bullish, supporting the upside potential. The RSI has also started to recover from the oversold zone and is crossing above its 14-day simple moving average (SMA), signaling increasing bullish momentum.

Will Cardano Price Surge to $0.40?

As the likelihood of a positive cycle within the current consolidation range grows, the price action traders should watch for is a breakout above $0.332. A move above this level could trigger further gains.

According to the Fibonacci retracement levels, an upward continuation could first challenge the 23.6% level at $0.343, followed by the 50% level at $0.364.

A complete positive cycle within the consolidation range could lead to an approximate 11% surge from the current price to $0.364. Optimistically, a bullish breakout could target higher resistance levels at $0.39 and $0.41, which correspond to the 78.6% and 100% Fibonacci levels, respectively.

Conversely, if Cardano falls below the $0.324 support zone, the price could retest the previous low around $0.315 or even the psychological level of $0.30.

Expert Says This Could Be Ethereum Last Dip Before Explosion to $10,000, Citing S&P 500 Correlation

0

Market watchers are eyeing Ethereum (ETH) closely, with analyst Ali Martinez noting the possibility of a rally to $10,000.

Since March, Ethereum has shown a downward trend, prompting speculation about its ability to recover and achieve substantial gains in the next bull market. An analyst has argued for Ethereum’s potential for growth, especially when drawing comparisons to the S&P 500’s market trends.

Ethereum’s Correlation with the S&P 500

Market analyst Ali Martinez has highlighted Ethereum’s relationship with the S&P 500 (SPX) as a point of interest. Martinez shared comparative charts showing Ethereum (ETH/USD) alongside the S&P 500 Index. Both assets found a bottom in late 2022 and exhibited an upward trajectory throughout 2023. 

The trend illustrated an ascending triangle pattern, which is often considered a bullish signal. The S&P 500 notably broke out of this pattern, peaking close to $5,900 before a minor retracement to approximately $5,728 at the time of Martinez’s snapshot.

This similarity in trend between Ethereum and the S&P 500 has fueled discussions on whether Ethereum might follow a similar path.

Martinez suggested that Ethereum’s current downtrend could be the final dip before a potential rally to $10,000. Notably, Ethereum would need to climb approximately 312.36% from its current price of $2,425 to reach $10,000. 

On-Chain Metrics Reflect Indecision

On-chain data from IntoTheBlock has provided deeper insight into Ethereum’s market state. As of the latest Year-to-Date (YTD) figures, 96,660 addresses—representing 22.93% of active wallets—are currently profitable or “in the money.”

This suggests that a significant portion of holders are seeing gains, which indicates underlying support for the asset. However, 248,920 addresses, or 60.83% of total active addresses, are classified as “at the money,” holding ETH at approximately break-even levels.

This group reflects market indecision, with the potential for further investment or selling pressure, depending on price movement.

Meanwhile, 64,410 addresses (16.24%) are “out of the money,” holding ETH at a loss. This segment could add selling pressure if the price continues to weaken.

Contrasting Views on Ethereum’s Outlook

Veteran trader Peter Brandt has taken a different stance on Ethereum’s price movement. On November 1, Brandt reiterated his bearish outlook, stating that Ethereum’s charts showed no signs of a momentum shift.

Brandt’s analysis pointed to a bearish flag pattern that had been forming since August. He emphasized that a breakdown in this pattern could lead Ethereum to a lower target.

Brandt stressed the likelihood of Ethereum crashing as low as $1,551. He indicated that bearish signals dominated Ethereum’s chart, suggesting continued downward movement unless new patterns emerged.

PEPE Transfers Now Live on Robinhood Europe: Will This Trigger a Massive 23% Rally for PEPE?

With Robinhood Europe now offering transfers for PEPE, could this development spark a breakout rally that pushes the price to the $0.000010 psychological level—a 23% gain?

With a recent boost from Robinhood’s European arm providing additional support to PEPE, the meme coin is back in action. A boost in buying pressure in the last 24 hours propels the 24th largest cryptocurrency by 3.16% today. 

With this recovery run, will PEPE reclaim the lost levels during the 5-day bear market? Let’s find out. 

PEPE Price Analysis

On the daily chart, PEPE’s price action shows a larger falling channel pattern. Before the recent recovery, the price had suffered a significant drop of 18.17%, resulting in five consecutive bearish candles, including a reversal signal in the form of an evening star pattern.

PEPE price chart
PEPE price chart

Furthermore, the declining trend broke below the 23.60% Fibonacci level, priced at $0.000008251489. Along with the Fibonacci level, the PEPE price also broke below the support zone at around $0.0000082. Hence, the intraday recovery comes as a potential retest of the bearish breakdown. 

As the bearish momentum persists, the 50-day and 100-day EMAs have formed a bearish crossover. Meanwhile, the MACD and its signal line continue to align bearishly, with negative histograms intensifying, suggesting continued downward pressure.

PEPE Transfer Now Live on Robinhood  

Robinhood Europe now supports live transfers for PEPE, along with a 1% deposit bonus to encourage user participation. This added support has provided a short-term boost to PEPE’s price. In the last 24 hours, this new feature has sparked a resurgence in bullish momentum, giving the meme coin a potential chance for a comeback.

However, PEPE faces challenges in gaining a listing on major U.S. exchanges like Coinbase or even Robinhood’s U.S. platform. However, this proactive move in Europe provides increased exposure and the opportunity for European users to explore the meme coin.

Will PEPE Price Reach $0.000010?

If the bullish resurgence fails to reclaim the lost levels, an extended downfall will likely test the $0.000006595. Hence, the downside risk for the PEPE memecoin is almost 20%. 

On the flip side, if the recovery continues and PEPE manages to surpass the 23.60% Fibonacci level, it could target the overhead trendline near the $0.000010 psychological resistance. This would imply an upside of approximately 23%.

If PEPE breaks through this overhead resistance level and the broader market continues its recovery, the next potential target for the coin could be $0.00001370, which corresponds to the 78.60% Fibonacci retracement level.

XRP Hits 7-Month Peak in Active Accounts as Whales Scoop up 390M XRP in 2 Weeks

0

On-chain data shows XRP active accounts have spiked to a 7-month peak amid a massive whale accumulation trend over the last two weeks.

These bullish metrics have prevailed despite the ongoing market uncertainty that has plagued the broader market. Amid this uncertainty, XRP previously tumbled from the $0.53 high on Oct. 29 to retest the psychological support at $0.50. A mild recovery has seen it rebound above $0.51 at press time.

Despite this push, XRP continues to underperform in longer timeframes. Notably, the altcoin is down 16% this year, while assets like Bitcoin (BTC) and Solana (SOL) are witnessing impressive gains. However, on-chain data shows this bearish turn of events has not dampened investor optimism.

Active XRP Accounts Hit 7-Month Peak

Interestingly, activity within the XRP ecosystem has seen a notable rise in recent times. According to data from on-chain resource CryptoQuant, active accounts on the XRP Ledger (XRPL) tumbled to lows below 10,000 at the start of October but have since continued to increase.

For instance, these accounts surged above 14,500 on Oct. 12 before retracing sharply in the following day. Since then, they have been on an upsurge, peaking at 24,411, a high the network last witnessed seven months ago.

XRP Ledger Active Addresses
XRP Active Addresses | CryptoQuant

The last time the XRPL saw this level of activity was on March 11, when about 25,000 accounts interacted with the blockchain. On this day, XRP saw a massive price spike, rising from $0.6084 to its yearly peak of $0.7449 before retracing.

A spike in active accounts can be bullish for XRP price action. However, this depends on the behavior of network participants, as the altcoin could benefit from a surge in addresses purchasing more tokens but feel a negative impact from a rise in addresses involved in selloffs.

For instance, during the March 11 price increase, receiving accounts on the XRPL spiked to a high of 43,343. This figure collapsed in the days that followed but has continued to fluctuate between highs and lows since then.

Whales Amass 390M XRP

Interestingly, receiving accounts are now seeing another spike, recently peaking at 48,628, as active accounts recover above 23,000. This represents a strong signal of an impending price run similar to the trend observed earlier this year.

XRP Ledger Active Receiving Addresses
XRP Receiving Addresses | CryptoQuant

In addition, XRP is also seeing a rapid spike in whale accumulation. According to data from market intelligence resource Santiment, addresses holding between 1 million and 1 billion XRP have increased their collective balance from 19.6 billion tokens on Oct. 21 to the current figure of 19.9 billion tokens.

XRP Whale Accumulation Santiment
XRP Whale Accumulation | Santiment

This massive increase confirms that these addresses have procured 390 million XRP tokens worth $198.9 million over the past two weeks. As XRP looks to recover from the latest slump to $0.50, the increased activity and accumulation trend could provide strength to the bulls.

Notably, XRP currently changes hands at $0.5170, up 2.79% this morning. The U.S. presidential election is pumping fresh capital to the crypto market as investors await the winner. A Donald Trump win could bolster the ongoing recovery rally.

Mt Gox Moves 32K+ Bitcoin to 3 New Wallets as BTC Holds $68K

0

Defunct cryptocurrency exchange Mt. Gox makes its largest Bitcoin transfer in months, moving over $2 billion worth of BTC in two hours. 

Leading blockchain analytics platform Spot on Chain called attention to the development shortly after Mt. Gox initiated the transactions. According to Spot on Chain, the Mt. Gox-affiliated wallet moved 32,371 BTC worth about $2.19 billion to three new wallets. 

Data from the blockchain analytics platform shows that the transaction occurred yesterday, November 4, at 23:38 (UTC). Most of the funds, amounting to 30,371 BTC, moved to an unknown address, ‘1FG2C…Rveoy.’ Additionally, the wallet transferred another 1,915 BTC to ‘15gNR…a8Aok’ an hour later. 

The last transaction saw 84.576 BTC move from the Mt. Gox wallet to a new address, ‘bc1q3…2pa0k.’ 

Mt. Gox Recent Movements  

Spot on Chain revealed that this Mt. Gox wallet has been involved in a series of transactions lately. Over the past four days, the wallet has moved 32,871 BTC worth $2.22 billion to different blockchain wallets. 

Of the 32,871 BTC, a small portion of 296 BTC ($20.13 million) was transferred to wallets affiliated with two leading crypto exchanges, OKX and B2C2. 

Following the recent transfers, the Mt. Gox wallet currently has a balance of 12,006 BTC worth $810 million, according to data from Spot on Chain. However, Arkham Intelligence data shows that this Mt. Gox wallet holds about 44,378 BTC, currently valued at $3.04 billion.

The recent transfers are part of Mt. Gox’s repayment plan, which is expected to linger until October 31, 2025. Since the defunct exchange commenced its repayment plan in July, it has distributed over $6 billion worth of BTC to users.  

Bearish Impact on Bitcoin Price 

While the exchange’s commitment to fully compensate users is commendable, the move has had a bearish impact on BTC’s price. 

After receiving payments, most users usually sell a portion of their assets due to the massive spike in their holdings since the 2014 hack. Hence, Bitcoin’s price has always reacted negatively to every major transfer affiliated with Mt. Gox.

Notably, following Mt. Gox’s movement of 32,371 BTC, the price of Bitcoin witnessed a flash crash from $68,000 to $66,896. However, the premier asset recovered its losses almost immediately, surging above the $68,000 mark.

Bitcoin was trading at $68,661 in the hours leading up to press time. This reflects a decline of 0.41% in the past 24 hours and 3.47% in the past week.