Home Blog Page 1159

VanEck Predicts Timeline for Bitcoin to Hit $3M as MicroStrategy Urges Heavy BTC Acquisition

0

VanEck makes a bold prediction for Bitcoin (BTC), projecting that the world’s largest cryptocurrency could hit a price target of $3 million by 2050. 

Matthew Sigel, VanEck’s Head of Digital Asset Research, made the projection during a recent CNBC interview. In the interview, Sigel disclosed that the company arrived at the $3 million price target for Bitcoin using its proprietary model.

Potential Factors That Could Drive BTC Price to $3M By 2050 

Sigel outlined multiple factors that could drive Bitcoin’s price to the $3 million target. They include Bictoin’s use as a global reserve asset, with central banks allocating about 2% of their total reserves to the cryptocurrency. 

Additionally, he envisions Bitcoin being utilized in international trades by 2050. According to Sigel, these factors would potentially bring Bitcoin’s price to a target of $3 million in 2050, 26 years from now.

Sigel Defends VanEck’s $3M Bitcoin Forecast 

Given the current price of Bitcoin, VanEck’s prediction may be seen as utterly outrageous. Hitting the $3 million target requires Bitcoin to surge 4,116% from its current price of $71,152. 

However, Sigel defended the projection, noting that reaching the $3 million target requires Bitcoin to register an annual compounded growth rate of 16%. 

VanEck has continued to issue multiple forecasts regarding Bitcoin’s future performance. Last month, the company issued its 2050 target for Bitcoin under three different scenarios. In a worst-case scenario, VanEck expects Bitcoin to trade at $130,314 by 2050. 

The asset manager also set base-case and best-case targets for Bitcoin, projecting that BTC could change hands at $2.9 million and $52.38 million, respectively. 

MicroStrategy Chairman Urges People to Buy Bitcoin 

Meanwhile, MicroStrategy executive chairman Michael Saylor emphasizes his confidence in Bitcoin, urging people and businesses to acquire as much BTC as possible. 

Per Saylor, buying Bitcoin at every opportunity remains the “best use of time.” He characterized the premier crypto asset as the “hardest money on earth.” This encourages everyone to invest in it. The Bitcoin bull advised people to use all their cash to purchase Bitcoin. 

Furthermore, he suggested that people who do not have money should borrow or mortgage valuable assets to purchase Bitcoin. In addition, Saylor advised employees to convince their bosses to convert cash-backed treasuries into Bitcoin, as he believes the move would bring significant returns. 

“If you’re working for a company that has $100 million in the treasury, you have to convince the CEO to convert the treasury to Bitcoin. That’s the most creative thing you can do; it will be worth billions to them,” Saylor remarked. 

Saylor’s recent comment aligns with a viewpoint similar to the one he shared about Bitcoin with his followers earlier this month. As reported earlier, Saylor told his 3.5 million followers they might regret not committing more funds to BTC. 

In the meantime, Bitcoin is trading above the $70,000 mark, with one BTC currently priced at $71,152. 

Bitcoin Sets Largest Inverse H&S in History, Analyst Projects Imminent Breakout

0

Market expert Don Gambardello speculates an imminent Bitcoin breakout from a multi-year head and shoulders (H&S) pattern that could catalyze an explosive uptrend to six figures.

Bitcoin appears to have rediscovered its form today after an over 3% upside above $71,000. The surge pushed the asset to a four-month price high, last seen in June.

However, experienced market speculator Dan Gambardello asserts that the recent uptrend is only a precursor of a greater rally to come. The expert’s analysis shows that Bitcoin is forming a price pattern tipped to stir a surge to six figures for Bitcoin.

Inverse Head and Shoulder Pattern Nears Breakout

In an October 28 analysis, Gambardello stated that Bitcoin is approaching the neckline of an inverse head-and-shoulder pattern forming on its 1W price chart. This multi-year price pattern began following the drop from the April 2021 high, months before Bitcoin hit its previous ATH at $69,000.

Bitcoin Inverse Head and Shoulder Dan Gambardello
Bitcoin Inverse Head and Shoulder | Dan Gambardello

The pattern’s head formed during the November market capitulation following the FTX implosion. According to Gambardello’s chart, Bitcoin bottomed around $15,479 before the bullish structure continued.

Meanwhile, Bitcoin’s all-time high of around $74,000 in March formed the right shoulder, with the price mark becoming the breakout trendline. The analyst noted that a breakout from the price pattern will mark “the most massive inverse head and shoulders in Bitcoin history.”

Although the analyst did not state his price target after the breakout, his chart points to levels above $180,000. Notably, Gambardello had earlier mentioned that $100,000 per Bitcoin is a possibility.

Bitcoin Nears ATH as Election Approaches

In an earlier report, Gambardello leveraged AI to predict when Bitcoin would hit new highs as the November 5 election draws nearer. ChatGPT forecasted that the crypto firstborn will take 5-12 days after the election to hit a new all-time high.

Analyst Michael van de Poppe shares a similar sentiment, noting that Bitcoin would see new all-time highs in a few weeks. He cited favorable macroeconomics like the US election to drive Bitcoin’s price to a new ATH soon enough.

Meanwhile, analysts at Bernstein expect the November 5 election to drastically affect Bitcoin in the short term, depending on the outcome. The brokerage firm asserted a bullish push to $90,000 if Donald Trump wins and drop to $30,000 if Kamala Harris wins.

Brandt Insists Bitcoin Breakout Not Yet in, Sets Conditions for Real Breakout

0

Veteran trader Peter Brandt insists Bitcoin has still not recorded a breakout, urging caution despite the firstborn crypto’s recent gains. 

In an analysis today, Brandt argued that Bitcoin’s recent movements do not yet constitute a “real” breakout. He focused on important structures and price points that Bitcoin must breach to qualify as a legitimate breakout. 

The Bitcoin Inverted Broadening Triangle

Brandt’s chart shows an inverted broadening triangle pattern on the weekly BTC chart. The legendary analyst had previously identified this pattern, suggesting that Bitcoin would remain in a bearish setup as long as it trades within the structure.


Bitcoin’s recent push above the $71,000 level marks a new four-month high, triggering optimism within the trading community. However, Brandt notes that while this advance has excited Bitcoin bulls, it falls short of a confirmed breakout. 

Bitcoin Inverted Broadening Triangle Peter Brandt
Bitcoin Inverted Broadening Triangle | Peter Brandt

According to him, a mere “nicking” of the boundary lines—where the price touches or slightly surpasses the upper trendline of the triangle—does not translate to a true breakout. 

Brandt insists that Bitcoin must reach specific criteria for a definitive breakout. For one, it should achieve a daily close above $76,000, ideally confirmed at midnight UTC on a Sunday, which would provide a strong weekly close to corroborate the upward momentum. 

For context, the $76,000 mark both exceeds the triangle’s upper boundary and places Bitcoin above its March 2024 ATH, a major resistance point. This ensures that Bitcoin has moved beyond just “nicking” trendlines and has convincingly broken through prior highs.

Brandt also called attention to the challenges of trading diagonal patterns with slanted boundaries. Such formations are more prone to “false” breakouts. In this case, price movements seem to indicate a breakout but quickly revert. At press time, BTC trades for $71,561, up 3.6% in the last 24 hours.

Bitcoin Sees Resistance at Multi-Year Highs Against Gold

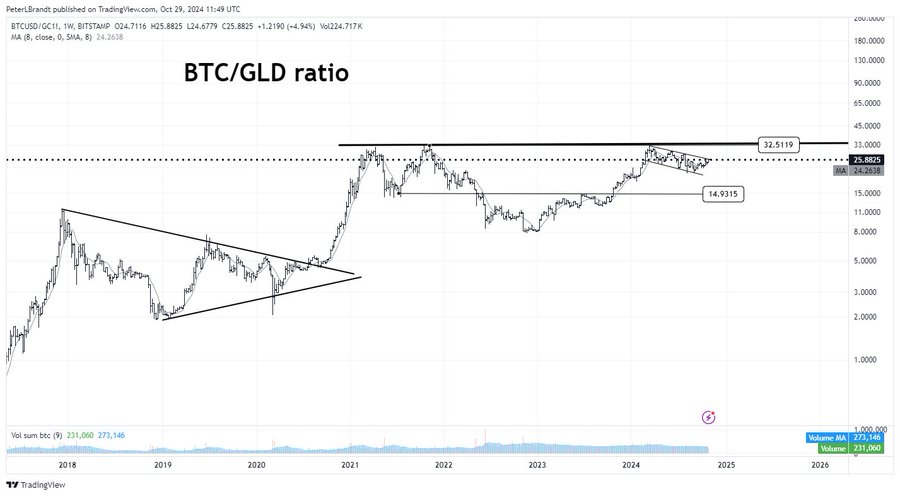
Meanwhile, in a separate chart, Brandt compared Bitcoin and Gold in a “heavyweight division” of the fight against inflation. In this chart, Bitcoin’s trajectory against gold shows a broader struggle over the past 42 months. 

Despite periods of growth, Bitcoin has failed to surpass the 34.08-ounce resistance set in March 2024 and the double highs of 2021. These price levels form a horizontal resistance zone, acting as a ceiling that Bitcoin must breach.

BTCGLD 1W Chart Peter Brandt
BTCGLD 1W Chart | Peter Brandt

The BTC/GLD ratio currently sits at 25.88, still below both the March 2024 peak and the 2021 highs. Notably, Bitcoin’s inability to move above these levels for over three and a half years shows a lack of substantial progress. 

However, in previous reports, Brandt has argued that Bitcoin still has potential to outpace Gold. Earlier this month, he predicted Bitcoin to soar to 123 ounces of Gold. In April, the market veteran insisted that BTC will rule over Gold and Silver for a long time.

12-Year Dormant Bitcoin Whale Bags 654,192% Gains, Moves 749 BTC

0

A whale dormant for 12 years has awakened, shuffling some of its stash amidst Bitcoin’s surge past $71,000 on Tuesday.

Bitcoin surged to a four-month high above $71,000 on Monday, following a rebound from last week’s low of $65,468. Notably, the bullish uptrend attracted a multi-year dormant wallet, which made its first transaction in over a decade.

On Tuesday, Lookonchain pointed the crypto community to a peculiar on-chain transaction involving a Bitcoin millionaire. The crypto analytical firm noted that a wallet address that has been inert for 12 years moved $11 million worth of Bitcoin.

Transaction Details

Lookonchain cited data from BitInfoCharts, which revealed the fine details of the transaction. It noted that the multi-year dormant address moved 159.23 BTC on Tuesday, the wallet’s first transaction since moving 10 BTC worth $109 on November 10, 2012.

The transaction, which happened by 08:28 (UTC), saw the wallet shuffle the $11.32 million worth of Bitcoin to two new addresses. The whale transferred 124.23 BTC to address “19s9pQn” and 35 BTC to “3LmnNq.”

Bitcoin Transaction
Bitcoin Transaction

At the time of writing, the first address that received 124.23 BTC still holds the stash, while the other wallet has disbursed the 35 BTC over several wallets. Notably, the newly awakened wallet addresses still contained 590 BTC, valued at $42 million at the current market price.

Whale Bags 654,192% Gain

Meanwhile, the diamond-handed whale has made staggering returns following his admirable patience with the premier asset. The wallet bought its first Bitcoin on September 5, 2012, and increased its stash to 759.23 BTC four days later at an average price of $11 per coin.

After his first sales at a loss two months later, the wallet indulged in holding his stash. Twelve years later today, the wallet has turned its initial $8,303 investment to $53.3 million, accounting for a 654,192% appreciation.

Other Whale Re-awakenings

Notably, other multi-year dormant accounts have been reawakening to millions of dollars in profits as the market continues to see higher prices. For context, a 15-year dormant miner wallet moved 250 BTC last month, with his portfolio moving from nearly nothing in 2010 to $15.9 million.

Meanwhile, two other 11-year dormant wallets awakened in August and sold 276 BTC. The wallets sold their stash at a profit of 49,971%, underscoring the massive gains users can accrue for holding Bitcoin for a long time.

“Just Relax”: Expert Says Nothing Changed for XRP, Big Reckoning Expected Soon

0

Market expert AIM Buster has called for calm among XRP proponents, suggesting that the altcoins’s consolidation phase is almost over, and a quick upside move is on the horizon.

XRP has had a long period of price stagnation despite growing traction and institutional influx into the cryptocurrency market. For instance, the seventh-largest crypto asset last traded above $1 almost three years ago and is down 4.47% from its price year-over-year.

While sentiments around the XRP community remain mixed, analyst AIM Buster has insisted that the consolidation phase is almost over. Per his Monday analysis, XRP is about to break out of its multi-month descending triangle.

Analyst Expects Big Reckonings

AIM Buster noted that the impending breakout would trigger a “big big reckoning” in XRP price. The market expert noted that when the move comes, it will be explosive and will drive the crypto asset to double figures.

Notably, the analyst cited his earlier speculation, stating that nothing has changed from the plan. In the August 2023 analysis, AIM Buster tipped the chart pattern to create “generational wealth” for traders, as XRP will target double digits if it comes to fruition.

Meanwhile, the speculation aligns with price expectations from another top market commentator, ANBESSA. 

In the October 28 post, the analyst noted that XRP is getting tighter in its ascending triangle and predicted a possible breakout by next year. However, he stated there would be a confirmation of the upward momentum before he gets excited.

Explosive Run Underway?

Interestingly, another analyst believes XRP has already broken out of its descending triangle on the 1M timeframe and expects an impending explosive price action. Pseudonymous commentator Random Crypto Pal stated that the breakout and the tightening of the Bolinger Band show an upsurge is imminent.

He cited similar price actions in XRP’s historical chart, which confirms his assertions. He noted that XRP surged 71,381% and 1,602% in 2017 and 2021, respectively, when the Bolinger Band tightened as it is on the chart.

Meanwhile, XRP is up 1.21% in the past 24 hours, trading at $0.5232 at the time of writing. Notably, the trading volume is up 65% to $993.5 million as the coin’s traction sees an uptick.

Dogecoin Hits 15% Gains, Eyes New 52-Week High Above $0.22

Dogecoin has surged by 15% as the meme coin market reaches a $62 billion market cap. A wedge breakout and a golden crossover indicate a potential buying opportunity, with $0.22 as a target.

With the crypto meme coin segment hitting a market cap of $62.19 billion, the 24-hour trading volume skyrocketed to $9.79 billion. Amid the massive surge in the meme market, Dogecoin, which leads the segment, is witnessing a substantial price jump today. 

Currently, it is trading at $0.1646 and has achieved a market cap of $24.13 billion. As the eighth biggest crypto asset in the industry, Dogecoin spearheads the meme coin rally and teases a bull run similar to the 2021 era. 

Dogecoin Rally Nears $0.17394 Resistance

On the daily chart, Dogecoin displays a falling wedge breakout rally, gaining momentum. The price action reveals a bullish flat breakout rally that boosts trend momentum.

This breakout rally has produced four consecutive bullish candles, resulting in a price jump of 28.72% from a 7-day low of $0.1275 to the current price of $0.1646.

Dogecoin price chart

As bullish influence increases on the daily chart, the 100-day and 200-day EMAs have produced a positive crossover. Following this golden crossover, the crucial 50-day, 100-day, and 200-day EMAs are poised to align positively.

Furthermore, the stochastic RSI shows an early positive crossover between the K and V lines. Thus, technical indicators and the breakout rally signal a buying opportunity for Dogecoin.

Based on price action analysis, the meme coin is set to challenge the nearest resistance level at $0.17394. If Dogecoin surpasses this resistance, it will likely aim for the 52-week highest closing price of $0.2208, increasing the chances of a new 52-week high above $0.22899.

Dogecoin’s Creator Looks Back to 2021

As excitement around Dogecoin returns to its 2021 bull run levels, Billy Markus, aka Shibetoshi Nakamoto, the creator of Dogecoin, has expressed his enthusiasm about the new bull run. In a recent post on X, Shibetoshi shared a snapshot of Dogecoin’s price, highlighting a 13.82% jump in a single day.

Short-Term Resistances for Dogecoin

A closer inspection of the 4-hour chart shows that the massive surge in bullish momentum in Dogecoin will likely be sustained. Following the bullish flag breakout, the streak of consecutive bullish candles has surpassed the 78.60% trend-based Fibonacci level at $0.16427. 

Dogecoin price chart

Now, DOGE is forming a Doji candle, increasing speculations about a morning star formation. Using the retracement tool, the short-term targets for the meme coin are $0.1742 and $0.2031. Conversely, Dogecoin has support at $0.15 and $0.14, aligning with the Fibonacci levels of 50% and 38%.

Solana Breaks Above $180, Flashes Early Signs of Successful Post-breakout Retest

0

Today, the price of Solana (SOL) has risen above the crucial $180, showing early signs of a bullish breakout per analyst.

Solana’s price is experiencing an upward surge, breaking past the $175 mark and moving further above $180. This move aligns with the broader bullish trends seen in Bitcoin and Ethereum. 

Amid this price surge, analyst Rekt Capital observed early signs of a potential post-breakout retest. Solana’s price is gradually attempting to overcome key resistance barriers, prompting further analysis of this rally.

Early Signs of Bullish Breakout

Rekt Capital’s analysis highlights Solana’s encounter with a downward-sloping trendline drawn from highs in March and August 2024. This trendline has functioned as a resistance level over the past few months. However, Solana tested it for the third time amid its recent comeback, marking a crucial point for potential breakout confirmation. 

Image

The green circle, representing this third test, signifies a significant phase in Solana’s attempt to break above the resistance. Following this, Solana’s weekly close above $175 breached both the downward-sloping trendline and a resistance box. According to Rekt Capital, as the price seeks to retest this previous resistance as new support, momentum appears to be favoring the bulls, with the potential for further gains if this support holds.

Positive Development Activity

Solana’s development activity, which often plays a pivotal role in price movement, further supports the price resurgence, as indicated by recent data from Santiment.

A dual-line chart analysis shows a direct comparison between Solana’s price action and development activity over the past few days. A noticeable uptick in development activity aligns with the current surge in Solana’s price.

Solana Development Activity

This correlation suggests renewed investor confidence. Historical patterns indicate that dips in development activity occurred in late June, early August, and early October, coinciding with price declines. Thus, the increased developer engagement seen from mid-October to the present could serve as an indicator of potential price rallies.

Improved Sentiment and Rising Discussions

Additionally, a report from October 24 highlights the role of improved sentiment in Solana’s price growth. Since October 18, positive sentiment and market discussions have surged in tandem with Solana’s rising price. This increased positivity has contributed to sustained momentum in Solana’s value, with “mindshare” remaining consistently strong.

The mindshare measure, which tracks the percentage of market discussions centered on Solana, fluctuated throughout the week but peaked around October 19 and remained steady through October 24.

XRP Scan Seeks Moment of Silence For This Hefty Token Burn

0

The XRP Ledger (XRPL) community has witnessed the burn of a significant amount of DROP tokens on the network, sparking speculation. 

XRPScan, an XRPL explorer, indexed the transaction yesterday, indicating that 10,000 DROP tokens were incinerated on the leading blockchain. According to the X post, the XRPL explorer urged the community to hold a “moment of silence” for the transaction. 

Per the transaction details, the 10,000 DROP tokens were burned on October 18 at 06:56 UTC, incurring a fee of 0.000012 XRP. Despite the transaction occurring earlier this month, the broader XRP community knew about it recently following XRPScan’s tweet. 

InFTF Exec Suggests Burn Was Deliberate 

Expectedly, XRP enthusiasts took to the comment section to speculate on whether the burn was deliberate or a mistake. Commenting on the development, Thomas Silkjaer, Head of Analytics and Compliance at Estonia-based Inclusive Financial Technology Foundation (InFTF), suggested that the burn was deliberate. 

The InFTF exec speculated that Drop token issuers might have deliberately initiated the transaction. Interestingly, XRPScan echoed a similar sentiment, stating that the account was recently mentioned on First Ledger’s About page. 

DROP Current Performance 

For context, DROP is an XRPL-based memecoin currently hosted on First Ledger, a crypto trading platform on XRP Ledger. It is currently priced at $5.07 per token, reflecting a 24-hour decrease of 17.44%. 

This indicates that the 10,000 DROP tokens burned recently are valued at $50,700. At the time of its launch, DROP had a total supply of 1 million tokens. However, the figure has reduced to 989,000 DROPs, according to data from First Ledger. 

Notably, DROP had reached a valuation of $10 million earlier this month. The team made this known in an October 26 tweet. However, DROP’s market cap has declined to $5.01 million at press time. 

Potential Impact of XRPL-Based Memecoins on XRP 

Meanwhile, the development coincided with an update from First Ledger regarding the potential impact of XRPL-based memecoins on XRP’s price. 

In an X post yesterday, First Ledger emphasized that XRPL-based memecoins are bullish for XRP. The First Ledger team suggested that launching memecoins on XRPL might enhance XRP burns, dramatically reducing its overall supply and causing the coin’s price to surge. 

The idea is that trading XRPL-based tokens, including memecoins, requires users to pay fees in XRP, which are automatically burned. First Ledger expects the growing interest in XRPL-based memecoins to boost XRP burns, potentially driving its price upward. 

In the meantime, 12,964,929 XRP have been incinerated using XRPL transaction fees. 

Solana Price Targets $200 as Bulls Gain Momentum: Time to Buy SOL?

Will the bullish Solana (SOL) trend exceed $200 as the crypto market begins the bull run?

With the increasing momentum of Solana’s recovery rally in a bullish market, participants are anticipating that the SOL price will reach the psychological milestone of $200.

This week, positive technical signals and bullish patterns have heightened the potential for further upside. So, should you consider buying Solana before the next bull run begins?

Solana (SOL) Price Analysis

On the daily chart, the Solana price action shows a massive recovery rally at play. The rally also displays an inverted head and shoulders pattern, indicating increased momentum. The breakout occurred when Solana surpassed the 50% Fibonacci level at $159.59. This level has served as the neckline for the inverted head and shoulders pattern.

Solana price chart
Solana price chart

Starting the ongoing bull run with a double bottom reversal at the 23.60% Fibonacci level of $137.29, the altcoin has surged nearly 30%. Additionally, growing bullish interest has led to a golden crossover between the 50-day and 200-day simple moving averages. The MACD and signal lines continue to maintain a positive trend as the bullish momentum persists.

In the past four days, Solana’s price action has formed consecutive bullish candles, resulting in a 13.22% price increase from its 7-day low. Currently, the altcoin is poised to challenge the 78.60% Fibonacci level at $183.64.

Based on the inverted head and shoulders pattern, the uptrend in Solana is likely to continue toward the 100% Fibonacci level at $201.69. Conversely, crucial support for Solana is situated at $169.49.

Solana’s Rising Channel Bolsters $200 Price Target

The rising prices of Solana in the 4-hour chart form an ascending channel pattern characterized by higher highs and higher lows. Supported by the 50 SMA on the 4-hour chart, the uptrend continues to gain momentum.

Solana price chart
Solana price chart

Utilizing trend-based Fibonacci levels, the uptrend in SOL is currently retesting the 38.20% level at $180. If the uptrend surpasses the overhead trendline, the bull run is likely to reach the 100% Fibonacci level at $206.64.

Bitcoin Targets New All-Time High at $84,929 as Bulls Push Above $71,000

As the price surge of Bitcoin surpasses the $70,000 region, will the flag breakout rally extend to the lofty $80,000 region by November?

The crypto market has reached a $2.4 trillion market cap, an increase of 4.8% over the past 24 hours. Bitcoin has also significantly increased by nearly 5% in the past 24 hours. 

Bulls anticipate the BTC price creating a new all-time high after crossing above the $70,000 psychological mark. Should you consider buying Bitcoin near its all-time high? 

Bitcoin (BTC) Price Analysis

The Bitcoin (BTC) price is currently trading at $71,173, surpassing the crucial psychological mark and attaining a market cap of $1.4 trillion. Bitcoin’s 24-hour trading volume is inching closer to the $50 billion mark and is currently at $47.14 billion, an increase of 1.48%. 

In the daily chart, the BTC price action reveals a bullish flag breakout rally gaining momentum after a post-retest reversal. Making five consecutive bullish candles, the BTC price has increased by 8.48% from its seven-day low of $65,521. 

BTC price chart
BTC price chart

Heading towards its all-time high of $73,794, the breakout rally in Bitcoin is showcasing increased chances of a new all-time high. 

The MACD and signal lines give a positive crossover with a surge of bullish histograms, supporting the bullish trend. Furthermore, the simple moving averages of 50-day and 200-day give a golden crossover.

Bitcoin’s Rising Channel 

In the 4-hour chart, the BTC price action reveals a rising channel pattern. Currently, a bullish trend continues within the channel as BTC bounces back from the support trend line. 

BTC price chart
BTC price chart

Making a 24-hour high at $71,500, the BTC price is heading toward the overhead resistance trendline. Using the trend-based Fibonacci level within the rising channel, the BTC price is facing opposition from the 50% level at $71,463. 

Will Bitcoin create a new All-time High?

With the recovery rally in BTC price gaining momentum, the bulls may shortly test the overhead trendline near the 78.60% Fibonacci level at $74,500. Further, the chances of BTC hitting a new all-time high level have significantly increased amid the increased breakout chances. 

For a longer-term projection, the Fibonacci retracement tool in the daily chart paints the next resistance levels above the all-time high at $78,318 and $84,929, corresponding to 1.272 and 1.618 Fibonacci levels, respectively.