Home Blog Page 1164

Tether CEO Denies Claims US DOJ is Investigating the Firm

0

Tether CEO Paolo Ardoino has debunked claims that the US Department of Justice (DoJ) is investigating the stablecoin issuer, calling the report an old noise.

Ardoino took to X on Friday to discard the speculation, noting that there were no indications that US prosecutors were scrutinizing Tether. Notably, the claims came after the Wall Street Journal released a report citing a possible investigation into the stablecoin issuer.

For context, the Friday report from WSJ claimed that the US DOJ was investigating Tether over its role in money laundering. It noted that the scrutiny, which has gone on for several years, questioning the use of the largest stablecoin by market cap for fraudulent activities.

Furthermore, WSJ reported that US prosecutors were considering sanctioning the crypto firm due to its alleged extensive involvement in fraud. It also noted that over $190 billion USDT was traded daily, and a chunk of it aided terrorist groups like Hamas.

Tether Calls Report Irresponsible

Notably, the stablecoin issuer also took to its blog to debunk the rumors, branding them “irresponsible” and “reckless allegations.” Although WSJ cited people familiar with the matter, Tether noted that the publication lacked credibility and came from mere speculations.

Tether insisted that it had a well-documented and cooperative relationship with law enforcement, well detailed in its periodic reports. Furthermore, the crypto firm stated that it has aided in apprehending cybercriminals and fraudsters.

It bears mentioning that Tether recently announced a collaboration with the Tron network to launch the T3 Financial Crime Unit (FCU), a firm solely focused on combating cybercrimes. The team had frozen illicit funds worth $12 million at the launch in early September.

Market Grapple Following Investigation Rumors

Following the release of the WSJ report, the crypto market saw intense downside volatility, pushing Bitcoin to $66,000. The short-lived capitulation also affected altcoins, with Ethereum and Solana dumping to $2,391 and $160, respectively.

Meanwhile, the price action spiked position liquidation, as the crypto derivative market has seen over $390 million worth of rekt positions in the past 24 hours. The concentration of the liquidation heatmap was on Bitcoin, Ethereum, and Solana, where its traders lost $67.3 million, $62.21 million, and $27.79 million, respectively.

At the time of writing, Bitcoin has recovered above $67,000, Ethereum trades at $2,461, and Solana exchanges hands at $166 per coin.

Here is the Only Reason Why XRP Crashed Below $0.5 Today

0

XRP suffers a devastating collapse today that sent its price crashing below the $0.5 mark.  

The prices of various crypto assets, including XRP (XRP), took a heavy hit yesterday in the U.S. evening hours.  

WSJ Claims Tether Is Under U.S. Probe 

This came after leading media outlet Wall Street Journal (WSJ) reported that stablecoin giant Tether was under investigation for money laundering-related charges. 

The report claimed that U.S. federal prosecutors are investigating whether malefactors have used USDT for illegal activities, including terrorist financing.   

Stablecoins are special cryptos whose prices are pegged to a separate asset, like the United States Dollar (USD). While several stablecoins exist, Tether’s USDT is the most used stablecoin. It is currently the largest stablecoin, with a market cap of $120.11 billion. 

XRP Slumps Below $0.5 

Given USDT’s popularity in the market, any negative report about the asset is expected to have a devastating effect on other cryptos. 

Like other crypto assets, XRP was not spared by the report. XRP, which was on the verge of surging above the $0.53 level, took a huge hit that sent its price crashing below the $0.50 mark. 

The last time XRP traded below $0.50 was in early August during the broader market collapse. It happened again yesterday, shortly after WSJ claimed that the United States government was investigating Tether for possible violations of anti-money laundering rules.  

Specifically, yesterday at 06:25 p.m. (EDT), XRP plunged to a two-month low of $0.4936. However, XRP recorded a major recovery that sent its price above $0.50 an hour later. 

XRP Recovers After Tether Denies WSJ’s Report 

This came after Tether’s CEO Paolo Ardoino denied the WSJ report. In a tweet yesterday, Ardoino disclosed that there are no signs Tether is under any U.S. probe. He slammed the media outlet for repeating old rumors that lack current relevance. 

Furthermore, the company also issued a statement denying the WSJ report. The stablecoin giant criticized the media company for making false allegations as if they were true without offering any evidence to back up its claim. 

Expectedly, Tether’s denial of the WSJ report breathed life into the market as several crypto assets, including XRP, recovered most of their losses. At the time of writing, XRP trades at $0.5141 per coin. Nonetheless, the asset is still down 2.14% over the past 24 hours. 

Venture Platform Predicts XRP Price in the Next 6 to 12 Months

0

Future Trends Capital, a venture-building platform, recently predicted XRP price along with targets for other top assets in the next six to twelve months. 

Notably, XRP has faced struggles in the bid to regain the level projected by the platform. For context, Future Trends expects XRP to eventually claim the elusive $1 price level through April to November 2025.

However, currently trading at $0.51, the XRP price must contend with multiple resistance levels before it can reclaim the $1 mark. The altcoin has traded underneath this level since it dropped below it in December 2021.

XRP’s Battles Below $1

The closest XRP came to hitting this level was in July 2023, following a ruling in the SEC vs. Ripple lawsuit, which clarified that XRP itself is not a security. This legal victory briefly pushed XRP up to $0.93 but it met stiff resistance, preventing it from hitting the $1 target.

To reach $1 within the next six to twelve months, XRP price would first need to break past several critical resistance points on its price chart. 

The weekly chart shows that XRP must clear the Pivot level at $0.6211 if it wishes to trigger the bullish trend that might catalyze such a run. A successful push past this level could attract more buying interest, helping to build the momentum.

XRP Price Chart
XRP Price Chart

Afterward, XRP price would face resistance at the upper Donchian Channel line, currently around $0.6650. This resistance line has acted as a cap on XRP’s price, requiring upward pressure for a breakout. 

Next, XRP would need to overcome the $0.8686 mark, the last major roadblock below $1. Breaching this line could pave the way for a move to $1.0215, a level that would represent a major achievement for XRP, as it seals a position above $1.

XRP Price to $1 Projections

Several other analysts have projected a push to $1 for XRP, making the April to November 2025 timeline seem less ambitious. For instance, Altstreet Bets predicted last month that XRP is likely to attain $1 before the end of this year. 

In August, an analysis from The Crypto Basic suggested that XRP might be on the verge of reclaiming $1 amid a multi-breakout stage. Also, analyst Steph argued last month that an XRP run to $1.1 would soon materialize as an inverted head and shoulders pattern formed. 

Meanwhile, Future Trends also projected price targets for other top crypto assets besides XRP. They expect Bitcoin (BTC), currently trading at $66,928, to see a substantial increase, with projections placing it around $100,000 within the next year. This price surge would mark a 49.4% rise.

Ethereum (ETH) also has an ambitious price target, with Future Trends forecasting a 143.9% increase from $2,460 to $6,000. Also, they believe Solana (SOL) could rise to $300, an 80.4% increase from its current level of $166.26.

Expert Suggests Last Chance to Buy XRP as Donchian Channel Breakout Nears

0

Crypto analyst Cryptobilbuwoo suggests the window to buy XRP might be closing as the altcoin nears a breakout point within the Donchian Channel. 

Currently, the channel reveals a resistance line that XRP has consistently challenged over the past three years. However, according to Cryptobilbuwoo, this might be the last window to buy XRP before a breakout above the resistance.

The accompanying chart shows XRP’s price movements since 2014, with occasional buy and sell signals. Cryptobilbuwoo identified a trend where XRP forms downward wicks when a support level collapses, as the market overreacts and retail investors panic-sell.

Notably, this trend shows how XRP’s price might move in the short term. The chart further reveals a repeating Parabolic SAR (Stop and Reverse) pattern similar to 2017. For context, during this period, XRP saw massive growth after breaking past the Donchian Channel’s resistance line.

The Donchian Channel Resistance

Throughout the years, the Donchian Channel has identified areas of continued resistance, particularly the baseline, which XRP has struggled to breach. This resistance line appears around the $0.95 mark, which the altcoin retested last July.

XRP 1M Donchian Channel Cryptobilbuwoo
XRP 1M Donchian Channel | Cryptobilbuwoo

However, buy signals also appear at some points, bolstering support levels and suggesting that a strong accumulation phase might be underway.

In 2017, XRP experienced a breakout after testing the Donchian Channel resistance multiple times. This led to a massive rally, with “Big Green Candles” indicating bullish momentum at the time. XRP eventually rallied past $3 in early 2018.

Cryptobilbuwoo pointed out similarities in the current setup. He argued that XRP might replicate its previous rally if it successfully breaks past this resistance, which currently stands at $0.95.

Major XRP Levels to Watch

Cryptobilbuwoo believes breaching the Donchian Channel baseline could trigger a sequence of green candles as seen in previous rallies. 

Should a breakout occur, XRP is likely to face powerful resistance levels at various levels. The first resistance rests at the $1.95 region, marking the previous roadblock the altcoin met during its 2021 upsurge.

If XRP breaches this $1.95 resistance with a single green candle, the next bullish candlestick could target the $6.00 price level. This would mark a new all-time high. Beyond the $6 level, the next target rests on $26.60, a 5,101% spike from current levels. 

Despite the optimistic outlook, there is a risk of rejection at the resistance line. XRP currently trades for $0.5114. A failure to break past the Donchian Channel baseline could trigger panic selling among retail investors. Should this occur, the first line of defense rests on the $0.5026 support.

Legendary Bitcoin Investor Awakens to 169,358,650% Profit After 14.3 Years of Dormancy

0

A dormant Bitcoin address containing 50 BTC recently came back to life after being inactive for more than 14 years. 

Popular whale tracking service Whale Alert called attention to the development today in an X post. According to Whale Alert, this Bitcoin address has been dormant since 2010, when the entire 50 BTC portfolio was valued at just $2. 

The wallet emerged from dormancy in the early hours of today after initiating two transactions. At the time of the transactions, the value of the 50 BTC had skyrocketed to a whopping $3,387,175 ($3.38 million), representing an ROI of 169,358,650%. 

This suggests that the Bitcoin whale acquired 50 BTC in July 2010, when BTC was worth $0.04 per coin. Fast-forward to the time of the latest transaction, the premier asset’s value had surged to $67,743. 

Transaction Details 

Data from Whale Alert shows that the owner of the dormant 50 BTC made their first transaction in over 14 years today at 05:30 UTC. The user moved the 50 BTC to two separate blockchain addresses containing 47 BTC and 3 BTC, respectively. 

The recipient addresses are still holding on to the funds in the hours leading up to press time. 

Normal Routine

The reawakening of dormant Bitcoin addresses is becoming a common trend in the crypto market. Several reports of such transactions have circulated within the crypto community, and The Crypto Basic has highlighted some of these incidents.

On October 13, some 1,379 BTC tokens made their first transaction after five to seven years of inactivity. Also, on September 20, several Bitcoin miners’ wallets reawakened after being dormant for 15.5 years. Five of these addresses, which received around 50 BTC per block in 2009, moved 250 BTC worth $15.9 million in one hour. 

It is worth mentioning that the reawakening of dormant crypto addresses is not isolated to only Bitcoin. There have also been reports of the revival of dormant blockchain addresses containing other assets like Ethereum. 

For instance, an 8.5-year dormant Ethereum address came back to life on September 15 to move some portions of its 16,636 ETH holdings.  

Given the recent surge in the reawakening of dormant crypto addresses, this development did not trigger panic among investors. Many believe the portfolio size is too small to seriously impact Bitcoin’s price.

In the meantime, Bitcoin has been up 0.68% over the past 24 hours, and the asset is currently trading at $68,227. 

Market Expert Predicts When Bitcoin Will Reach Its Top for This Cycle

0

A well-known market expert recently shared a comprehensive chart predicting when Bitcoin (BTC) might reach its peak price for this cycle. 

Market analyst EGRAG suggests that the next price peak for BTC could occur in mid to late 2025. Interestingly, he based this projection on an analysis of four Bitcoin cycles and Fibonacci retracement levels to gauge how BTC has behaved after breaking major resistance levels.

Bitcoin Cycle Analysis 

Notably, data from the chart shows that the first cycle took place between 2011 and 2013. EGRAG identified that after Bitcoin closed one full-body candle above the Fibonacci 1 level, it took 245 days (8 monthly bars) for BTC to reach its cycle top. 

For context, this cycle duration marked the beginning of a recognizable pattern for Bitcoin’s long-term price behavior, with a top around $1,242. BTC reached this peak price in November 2013.

Bitcoin 1M Chart EGRAG Crypto
Bitcoin 1M Chart | EGRAG Crypto

The second cycle hinges on Bitcoin’s movement between 2013 and 2017. After the same full-body candle closed above Fibonacci 1, Bitcoin reached its top after 214 days (7 monthly bars). BTC hit a top of $19,785 in December 2017.

In Cycle 3, EGRAG identified November 2021 as the month for cycle top, which took 335 days (or 11 monthly bars) to materialize. Some analysts consider April 2021 as the peak, but EGRAG’s chart shows that Bitcoin’s highest point occurred in late 2021, topping at $68,997. 

Prediction for Current Bitcoin Cycle

Leveraging this historical data, EGRAG predicts two potential timelines for Bitcoin to reach its next cycle top. He calculates that the average duration from a full-body candle close above Fibonacci 1 to the cycle top is 265 days.

Using this average, EGRAG predicts that Bitcoin could top out around June 2025. Alternatively, when considering the longest cycle—Cycle 3, which took 335 days—EGRAG believes Bitcoin could also reach its peak in September 2025. 

He noted that patience is key, as any full-body candle close above Fibonacci 1 in the coming months could slightly adjust these target dates. The timing of Bitcoin’s next cycle top could change based on upcoming market activity, but investors should monitor mid to late 2025.

EGRAG’s projection relies on Fibonacci retracement levels. Fibonacci 1 levels have served as important resistance points in each cycle. Once Bitcoin surpasses this resistance level, it has often rallied further toward Fibonacci 1.618 or higher.

The market analyst projects that in Cycle 4, after Bitcoin surpasses Fibonacci 1 (currently at $69,725), its price may push toward new highs, with Fib. 1.618 ($176,061) serving as the ultimate target on the chart.

Notably, market veteran Peter Brandt previously speculated that Bitcoin might have already reached its top for the cycle. However, in his most recent analysis, he argued that the cycle top might be $135K. Nonetheless, he insists BTC is still in a bearish position.

Swiss City of Lugano Uncovers Statue Honouring Bitcoin Founder Satoshi Nakamoto

0

The city of Lugano in Switzerland is the latest to unveil a statue honoring Satoshi Nakamoto, the pseudonymous Bitcoin founder.

Bitcoin, Satoshi Nakamoto’s creation, has transcended the anonymous founder to become a global store of value and a financial giant. However, from time to time, Bitcoin enthusiasts take out time to honor the founder, whose identity is yet to be uncovered.

The latest attempt to appreciate Satoshi Nakamoto’s contribution to global finance came from a pro-Bitcoin city, Lugano. The Swiss city unveiled a statue honoring the pseudonymous founder on Friday in collaboration with the Plan B network and Tether.

Lugano Collaborates with Tether to Honour Satoshi Nakamoto

Per a blog update, Tether, the firm behind the largest stablecoin by market cap, revealed that the statue was part of the product of a collaboration with Plan B and the City of Lugano. This came in front of the Lugano Villa Ciani at the ongoing two-day 2024 Plan B Lugano forum.

Notably, the monument described Satoshi Nakamoto’s anonymity, showing a figure sitting with legs crossed, a covered face, and what looked like a personal computer. Meanwhile, the perspective changes as the viewer changes position, turning to nearly nothing at some point.

Satoshi Nakamoto
Satoshi Nakamoto

Tether’s CEO Paolo Ardoino noted that the statue stands as a reminder of Satoshi Nakamoto’s contribution to the global financial system. He further admired the pseudonymous founder’s initiative to hand over his vision to the community.

Lugano Grows Popularity as a Bitcoin Hub

Lugano has ramped up crypto adoption since adopting Bitcoin, USDT, and LVGA as legal tender in March 2022. The city and El Salvador remain among the few entities that have adopted cryptocurrencies in that capacity.

Furthermore, in December 2023, the City of Lugano also adopted Bitcoin and USDT as means of tax payment and municipal fees, setting the stage for cities and public entities to embrace the nascent financial vehicle.

The Mayor of Lugano, Michele Foletti, noted that Satoshi Nakamoto’s status depicts the city’s stance as the leading hub for digital innovation. He stated that Lugano was proud to host the Plan B conference and honored to have a memory of the pseudonymous Bitcoin founder.

Ethereum Drops to 3-Year Low Against Bitcoin as Analyst Eyes 0.035 BTC Support

0

ETH/BTC drops below a 3-year low, as Ethereum continues to slump against Bitcoin, with Michaël van de Poppe highlighting a potential support zone.

Ethereum’s exchange rate against Bitcoin has experienced a significant decline, recently dipping below 0.037 on October 25—its lowest level since April 15, 2021. Market data shows a 30% drop in the ETH/BTC rate since July 1 this year, reflecting a major downturn in Ethereum’s performance compared to Bitcoin. 

Analysis Shows Key Support Levels

Michaël van de Poppe, CEO of MN Consultancy, has observed this bearish trend in the ETH/BTC pair, calling a capitulation on Ethereum. His analysis points to a potential support zone at the 0.035 BTC level, where buying interest may emerge. 

A smaller support zone near the 0.038 BTC level could provide temporary relief before Ethereum tests its primary support area. 

Additionally, the Relative Strength Index (RSI) is in the oversold zone, indicating the possibility of a price reversal or bounce for ETH/BTC. However, this would require renewed strength from the Ethereum bulls. 

Long-Term Perspectives 

While the broader market narrative shows waning interest in Ethereum, some analysts, like the pseudonymous Moustache, view the ongoing ETH/BTC decline as an opportunity. 

According to him, the ETH/BTC pair is approaching a trend line that has persisted since 2015, which suggests potential for altcoin strength if historical patterns hold. Position trader Bob Loukas echoed a more critical yet balanced perspective. 

Loukas suggested that Ethereum’s decline mirrors current shifts in economic activity within the blockchain ecosystem, with user demand moving towards other platforms. He noted that Ethereum’s value may be adjusting to emerging competition.

He also believes the rising prominence of Ethereum’s Layer 2 solutions could be a potential driver for its recovery. However, questions remain about whether real-world use cases can sustain valuations at the expected pace.

Ethereum Lags Behind Other Altcoins Too

Meanwhile, the Ethereum downtrend has coincided with the rising performance of competing assets such as Solana. Since October 22, Solana has demonstrated a consistent upward trend, showing gains in both price and trading volume. 

This trend has sparked Solana to reach a new high of approximately 0.0697 ETH. The contrast in momentum suggests that investors may be rotating towards altcoins perceived to offer better growth prospects, contributing to Ethereum’s weakening performance relative to other cryptos in the market.

Analyst Warns Solana Could Signal Bearish Shift as Key Levels Are Tested

0

An analyst warns that Solana may signal a bearish shift in the market if key levels are breached, as indicators show declining momentum.

Solana (SOL) recently exhibited a sharp rebound from its previous dip, reaching about $173, a 12.8% gain over the past week. Its trading momentum has shown stability, increasing by 0.05% over the past 24 hours.

However, an analyst’s perspective indicates caution for Solana, identifying a potential trigger for a bearish shift.

Analyzing Solana for Bearish Signal

Analyst Ceciliones on TradingView suggests that traders should consider Solana as a key indicator of market conditions. Currently ranked fifth by market cap at $78.2 billion, Solana’s past performance positions it as a focal point for investors. He noted that SOL surged over 600% last October after breaking a 300-day accumulation phase, serving as a strong entry signal for other crypto assets.

Now, the weekly chart reveals that SOL is forming a Wyckoff distribution pattern. The analyst encourages viewers to verify this observation with the provided chart.

He highlights that the 0.786 Fibonacci level represents SOL’s potential bottom. Notably, this level corresponds to the $125 price point for Solana.

According to the analyst, if this level is broken on a weekly chart, it could serve as a clear signal for investors to exit the market and convert their assets to cash. The analyst anticipates this scenario could unfold within two months.

Solana chart by
Solana chart by Ceciliones

Momentum Indicators Support Bearish Perspective

Technical indicators support the analyst’s observations. On the 1-day timeframe, Solana’s relative strength index (RSI) stands at 67.72, slightly below the 70-overbought threshold.

While the RSI’s upward trend shows strong buying momentum, its recent dip from overbought levels suggests a possible slowdown or correction. 

SOLUSDT 1-day Chart
SOLUSDT 1-day Chart

Meanwhile, the MACD indicator presents a bullish trend, with the MACD line at 7.38 and the signal line at 5.10. The narrowing gap between the two lines hints at stabilizing momentum or a possible crossover.

Solana Whales Activities

On October 23, a notable whale withdrew 32,695 SOL (worth $5.46 million) from Binance, redirecting funds towards meme coins. The investments included $3 million in GOAT tokens, $1.96 million in GIGA tokens, and $484,000 in FWOG tokens.

Additionally, Pump.fun, a meme coin launch platform within the Solana ecosystem, sold 40,000 SOL tokens at an average price of $156.40, leveraging favorable market conditions. Since its launch, Pump.fun has earned nearly 969,945 SOL in fees, with 56% of the tokens sold to realize profits.

US Bitcoin ETF Demand Hits 6-Month High with $4.4B Inflow in 30 Days

0

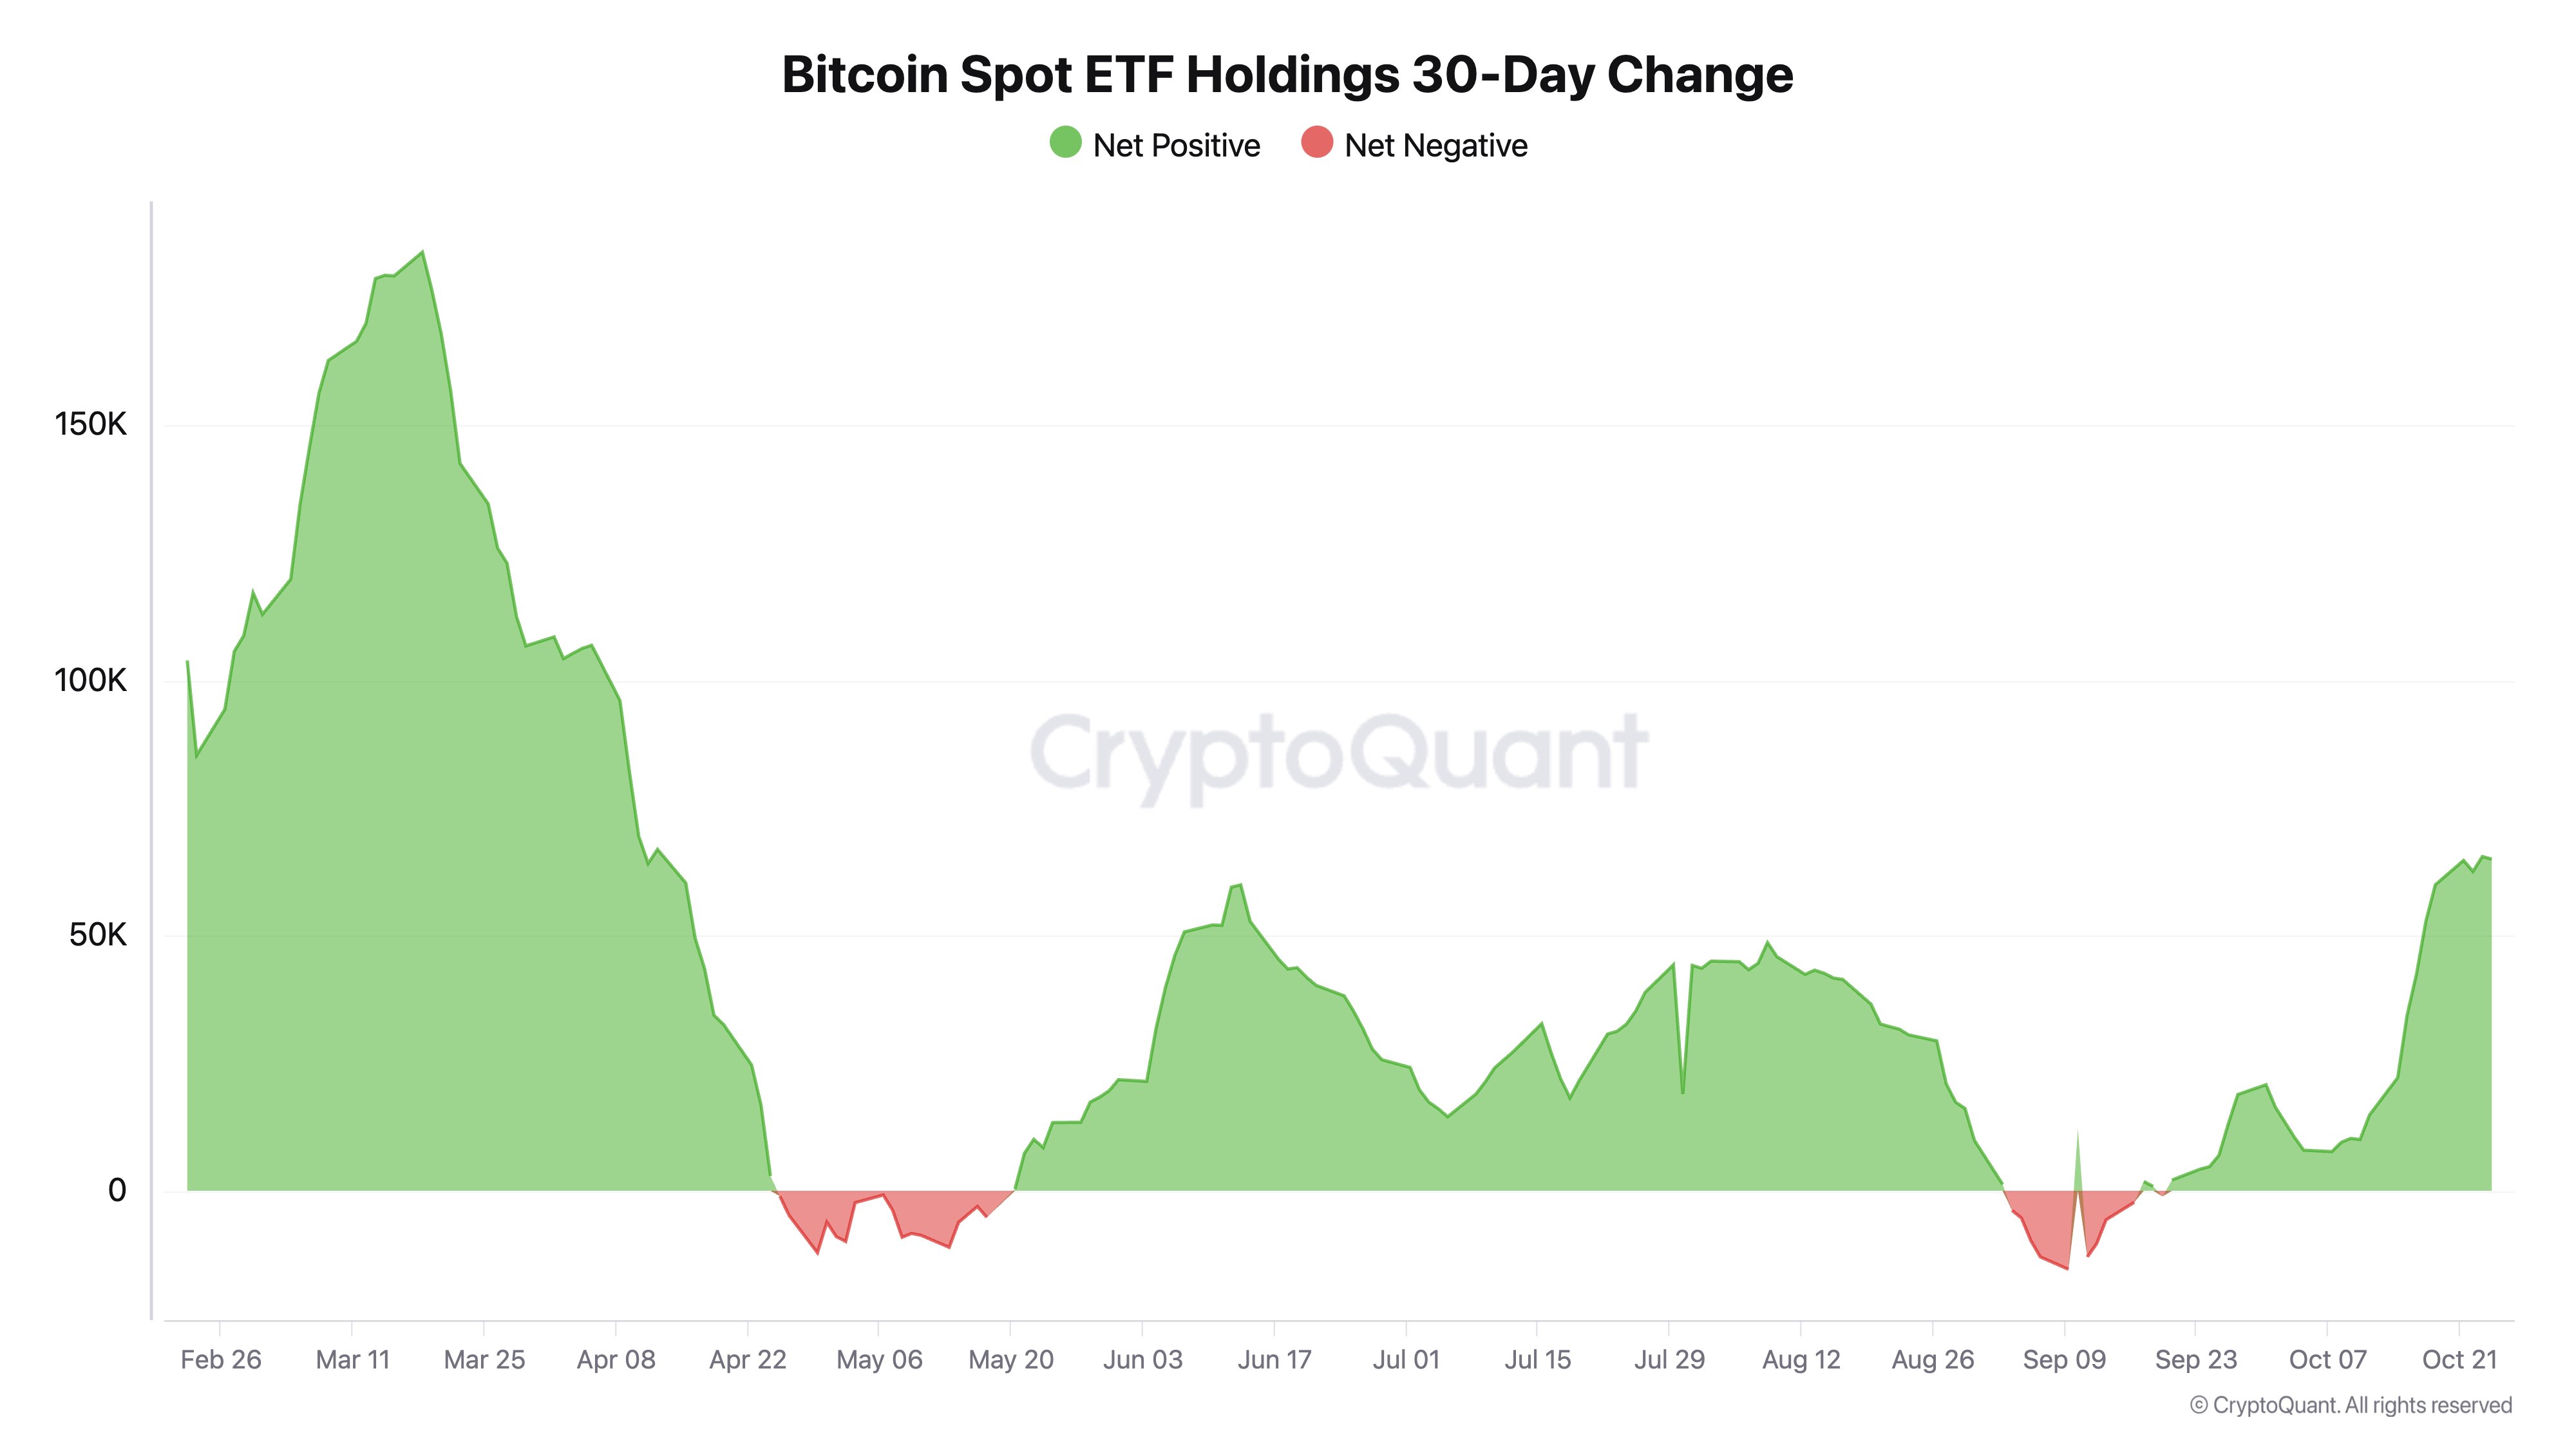
Demand for U.S. spot Bitcoin ETFs has reached its highest level in six months, with net inflows totaling 64,962 BTC over the past 30 days.

Ki Young Ju, the founder of CryptoQuant, highlighted this significant trend in a post on X today. This surge indicates that the U.S. Bitcoin ETF market has seen a remarkable $4.39 billion in new capital over the past month.

The last comparable record was noted in April when Bitcoin traded above $72,000. The subsequent bearish trend in Bitcoin’s price performance was also reflected in ETF flows.

Specifically, spot Bitcoin ETFs experienced a decline in holdings for most of May, coinciding with Bitcoin’s initial retracement below $56,000. However, this trend quickly reversed, with positive inflows reaching monthly highs from June to August before another downturn began in early September.

This bearish trend shifted on September 18, when the U.S. economy welcomed a historic interest rate cut, making investments in crypto assets more attractive. Since then, the positive inflow to Bitcoin ETFs has continued, recently reaching a six-month high.

Image

The massive uptick in ETF holdings confirms renewed interest from institutional investors, with market participants hopeful that this could catalyze further price gains.

Bitcoin Price and ETF Demands

During this period, Bitcoin’s price surged by 20%, rising from around $57,000 to just below $70,000. On Monday, when Bitcoin reached $69,500, Bitcoin ETFs saw net inflows of $294.3 million, with BlackRock’s IBIT experiencing a massive positive flow of $329 million.

Other ETFs, such as the Bitwise Bitcoin ETF, recorded negative flows of $22.1 million, while Ark Invest’s ETF saw a decline of $6.1 million. The Invesco Galaxy Bitcoin ETF and Franklin Bitcoin ETF had no new inflows.

Despite the crypto market losing some bullish momentum, as evidenced by Bitcoin’s ongoing correction, the trend of inflows to Bitcoin ETFs remains positive.

As of Thursday, the U.S. market recorded $188 million in net inflows, led by BlackRock’s $165.5 million and Fidelity’s $29.6 million. Other funds posted no new investments, while Grayscale experienced a drain of $7.1 million.

Additionally, a net flow of $192 million was observed on Wednesday. A negative trend was recorded on Tuesday, coinciding with Bitcoin’s drop to $65,000. Cumulatively, U.S. Bitcoin ETFs have seen $21.6 billion in inflows since January, making it the fastest-growing ETF market in this decade.