Home Blog Page 1182

Bitcoin Failure to Close Above $68K Could Trigger 30% Price Drop to $47K: Analysis

0

Bitcoin (BTC) is again at a critical juncture. The top cryptocurrency has broken above its August highs and is now challenging a long-term resistance zone. 

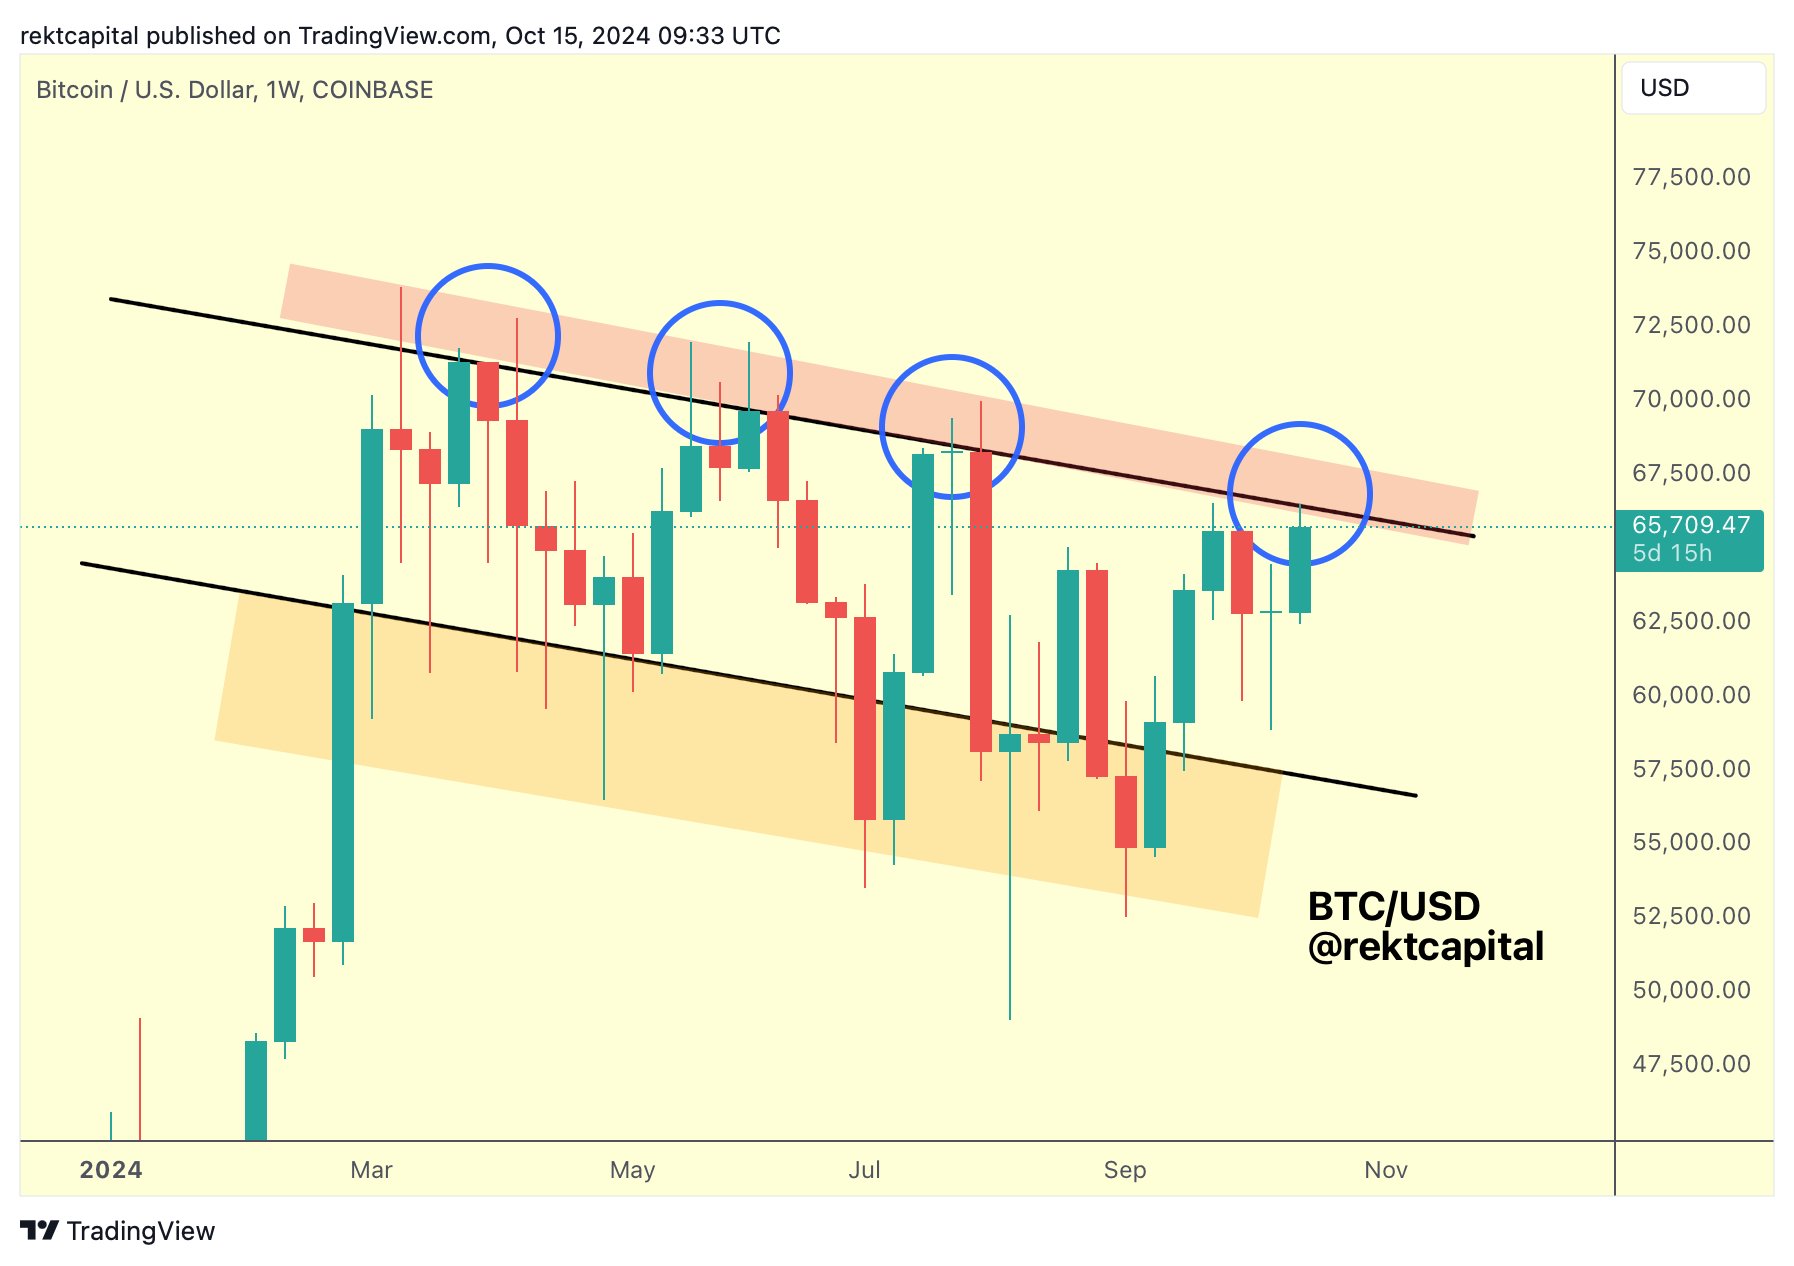
According to analyst Rekt Capital, Bitcoin’s successful attempt to overcome the August peak positions it to face more substantial resistance located at the top of a downward channel. In an earlier analysis, the analyst noted that this level has historically been a problematic barrier for Bitcoin, as it is where past bullish rallies were rejected.

Highlighting the significance of this milestone, Rekt Capital pointed out that the August peak resistance had led to a price crash of up to 18%.

With this point now cleared amid Bitcoin’s rally above $66K on Monday, Rekt Capital said a weekly close above this red resistance zone (as seen in the chart below) could signal a full-scale breakout, potentially reversing the current downtrend pattern.
Image

Bitcoin Attempting to Reverse Current Downtrend Pattern

Remarkably, Bitcoin re-entered the $67K price range on Tuesday for the first time in three months. It continues to defend this threshold as it trades at $67,877, making an attempt at the $68K level.

Rekt Capital highlighted this latest move in the latest update. He shared an updated chart showing that Bitcoin is just a few steps away from breaking above the red box as of Tuesday evening, describing it as a “moment of truth.” This anticipated outcome could indicate that Bitcoin has overcome the downtrend that commenced after the all-time high in March.

Notably, after initially entering the $67K channel yesterday, Bitcoin experienced an abrupt price drop, sending it to the $66K level within an hour. However, it quickly recovered from this dramatic drop and has maintained a price in the upper end of the $67K range.

Rekt Capital acknowledged this occurrence in the follow-up update, stressing that a weekly close inside the red resistance zone is all Bitcoin needs to avoid massive price rejections, as seen previously. Notably, closing above the zone would require Bitcoin to surpass and hold above the $68K level.

Bitcoin Risks a 30% Drop to $47K

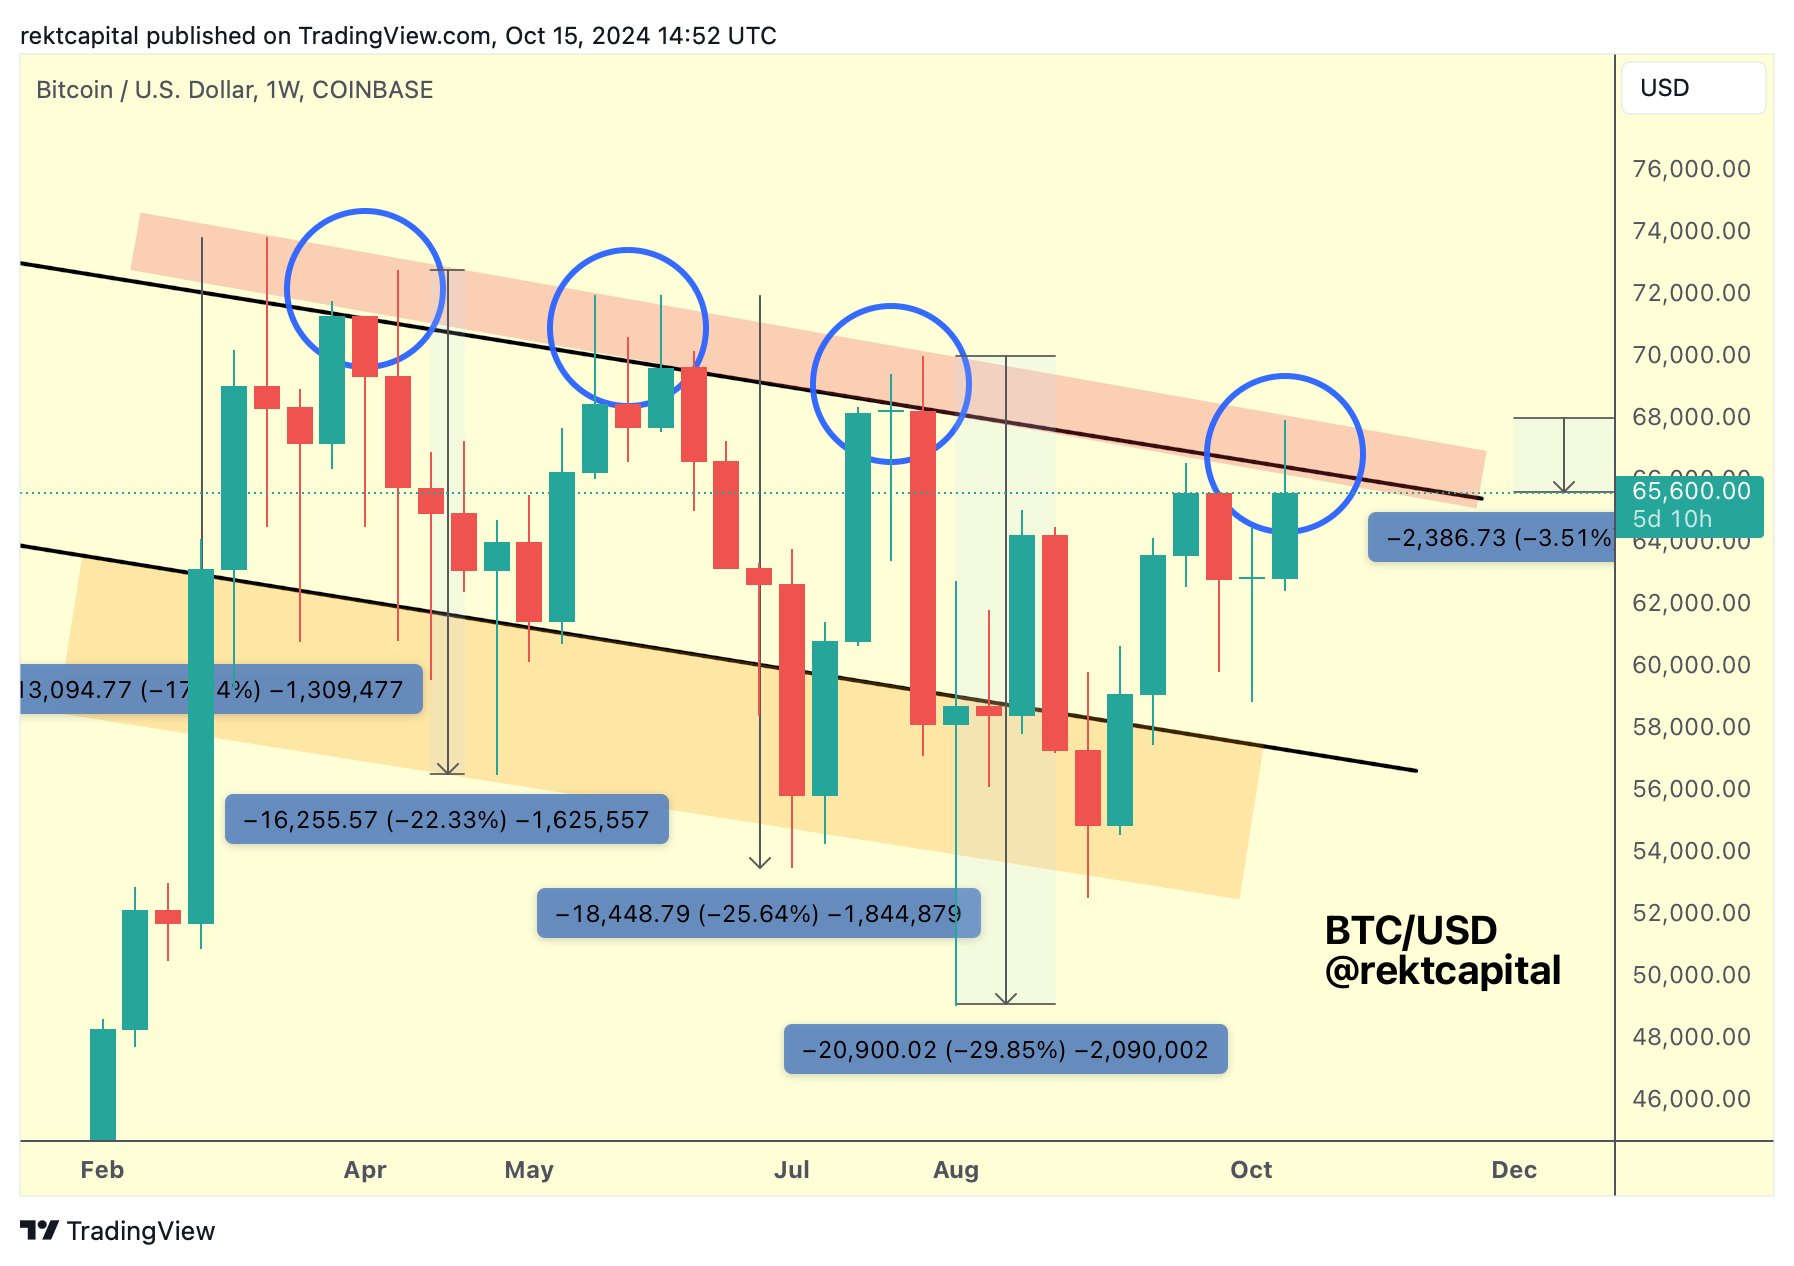
According to the analyst, Bitcoin faces a potential 30% price correction if it fails to close above the required level. He noted that the rejections have led to progressively deeper pullbacks since March: from an initial 17% drop to a 22% fall, then a 26% crash, and most recently a 29% collapse.

If this pattern continues, investors could be looking at a likely drop of over 30%, which would drag Bitcoin down to at least $47K.
Image
Chart by Rekt Capital

Bitcoin Eyes $220K as RSI Data Suggests Cycle Top Not Yet In

0

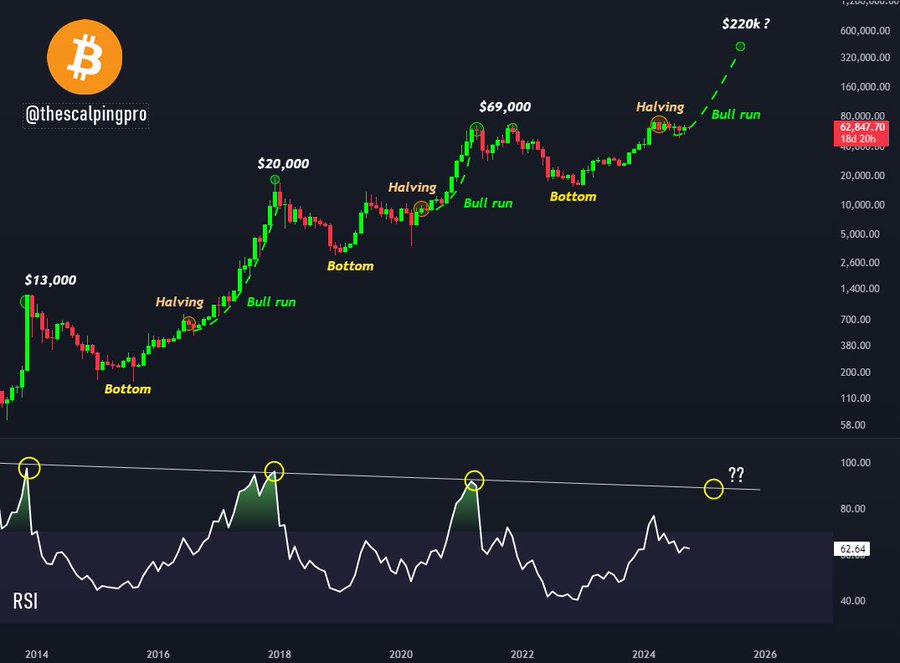
Bitcoin historical price patterns, especially as it pertains to its monthly RSI, suggest that the firstborn crypto has not yet witnessed its top for this cycle. 

This is according to a recent analysis by crypto trader and market analyst Mags (@thescalpingpro). He suggested that if history repeats, Bitcoin’s price could surpass the $200K mark, citing the current position of the monthly Relative Strength Index (RSI).

The accompanying chart shared by Mags shows Bitcoin’s price movements during previous cycles. Data from the chart confirms that each of these cycles has featured halvings, bottoms, and bull runs. 

Bitcoin RSI and Halving Trends

After the 2020 halving, Bitcoin reached its all-time high of $69,000 in 2021. Following that, the market experienced a significant correction, bringing the price down to around $15,000 in 2022. 

However, as in past cycles, the price has steadily recovered, leading up to and following the April 2024 halving. Despite this, a major consolidation has ensued over the past few months.

Bitcoin Historical Chart TheScalpingPro
Bitcoin Historical Chart | TheScalpingPro

Mags confirmed that in every market cycle, Bitcoin reaches a cycle peak when the RSI moves above 90, indicating extreme overbought conditions. This pattern has played out in each of the three halvings since 2014.

However, right now, Bitcoin’s RSI is still in the mid-60s. Mags noted that this suggests the market has more room to grow before hitting overbought levels. 

This observation has bolstered confidence that Bitcoin has not yet reached its peak for the current cycle. Notably, market veterans such as Peter Brandt also hold this sentiment, citing different metrics. However, Brandt expects the top to reach $135,000.

Bitcoin’s price has been consolidating since the halving in April, with analysts like Mags expecting another bull run. If history repeats, as it often does with Bitcoin, the post-halving phase could drive prices higher, with Mags setting a target of $220,000.

Immediate Bitcoin Price Outlook

Amid the long-term bullishness, there are short-term resistance levels that Bitcoin must overcome to sustain this momentum. 

A separate chart from Mags calls attention to Bitcoin’s recent price movements, focusing on a trendline that has served as resistance for over 217 days. The price has tested this trendline four times, with three previous rejections occurring. 

The chart shows that Bitcoin is again testing this resistance level. A breakout above this trendline could signal the start of the much-expected second phase of the bull rally, potentially pushing Bitcoin to a new all-time high (ATH). 

Brandt stressed in a previous analysis that a break above $68K could set this stage for the upcoming rally. As the RSI continues to climb, the possibility of hitting $220,000 becomes more likely. However, Bitcoin must first conquer its immediate hurdles, as it currently changes hands at $67,553, up 6.72% this month.

Italy to Raise Capital Gains Tax on Bitcoin Transactions  

0

To raise more revenue to fund its 2025 budget, the Italian government is considering raising capital gains tax on cryptos, including Bitcoin (BTC). 

Maurizio Leo, the Deputy Economy Minister of Italy, revealed the development today during a news conference at Palazzo Chigi. 

Italy Considers Raising Crypto Tax Gains to 42% 

He said the Italian government could raise the withholding tax on Bitcoin’s capital gains from 26% to 42%. 

This proposal is part of the 2025 budget bill that the Council of Ministers recently approved. For context, the Italian government introduced the 26% levy in 2022 for the country’s 2023 budget. At the time, all crypto-related transactions worth over €2,000 ($2,178) were subjected to a 26% tax on capital gains. 

The government plans to raise the levy to 42%, as proposed in the 2025 budget. Following the increase, Bitcoin traders must pay a fee of €840 ($915) for a €2,000 BTC transaction. Currently, traders pay €520 ($566) tax for transacting a similar amount with the current rate of 26%.   

In the meantime, the Italian Parliament has yet to approve the new tax measures, with a final vote expected by the end of the year. 

Government Eliminates Web Tax Threshold 

Furthermore, the proposed bill also seeks to eliminate the minimum revenue thresholds for the country’s Digital Service Tax (DST), popularly referred to as web tax. 

It is worth mentioning that the web tax was introduced in Italy’s 2019 budget. At the time, the Italian government imposed a 3% levy on digital firms boasting a minimum revenue of €750 million ($817.13 million), with €5.5 million ($5.5 million) of this sum raised in Italy. 

Since introducing the web tax, the Italian government has raised about €400 million (approximately $436 million). Italy proposing to remove the minimum condition for the web tax could raise more funds. However, Leo did not provide an estimate of what the government should expect. 

Nonetheless, the revenues generated from the enhanced tax levies, including the hike in Bitcoin’s capital gains, would fund part of the country’s 2025 budget, worth about €30 billion ($33 billion). 

Additionally, taxes generated from banks and insurance companies, amounting to around €3.5 billion ($3.81 billion), are expected to fund part of the budget. The government plans to use the tax generated from financial and insurance institutions to improve public services. 

Analyst Says Bitcoin Will Surge to $170,000 if This Happens

0

With the market showing bullish momentum, analyst Egrag has stated that Bitcoin will be all set for a surge to $170,000 if a critical level holds.

Bitcoin has pumped over 2% today to a three-month high of $68,000. The last time the asset traded that high was in July while consolidating from its all-time high of around $74,000 in March.

An interesting fact about the latest pump is that Bitcoin has failed several times to attain this price mark for the past four months. For context, the premier asset was rejected at $65,000 in August and $66,508 in September while attempting to reclaim $70,000.

However, with a successful outing on Tuesday and a bullish continuation today, market expert Egrag has given a critical level that Bitcoin needs to hold to continue its uptrend. The analyst stated the level was paramount because it was the “simplest yet most effective” indication of Bitcoin’s sustained uptrend to $170,000.

Market Expect Cites 21 EMA Trendline

In a tweet on Wednesday, Egrag insisted that the bullish upsurge seen today was the early stages of the Bitcoin bull market. Notably, key metrics have already reached new highs despite the early nascent bull cycle.

For context, the Bitcoin open interest on exchanges surged to a new high above $19 billion on Tuesday, signaling increased traction toward the premier asset.

Furthermore, Egrag stated that Bitcoin has now reached the 21 exponential moving average trendline, a critical indicator that would determine its continued uptrend. The market speculator noted that for Bitcoin to sustain bullish momentum, it has to close above the indicator at $67,285 by October.

Egrag attached an accompanying chart stressing the importance of the 21 EMA indicator. According to the chart, Bitcoin continued its uptrend after breaking past the trendline in previous cycles, as seen in the 2016 and 2020 bull runs.

Bitcoin to $170000 Egrag Chart

Analyst Sets Cycle Target at $170,000

Meanwhile, Egrag stated that although there are speculations that Bitcoin will hit $300,000 and $500,000, the primary focus for this bull cycle was the Fibonacci level 1.618 at $170,000. He implied that he sees the bull cycle peaking after a 250% rally from the current market price of $68,000.

Notably, several analysts speculated contrasting prices for Bitcoin, with some predicting higher than Egrag’s $170,000 and others calling a lower price for the bull cycle. For instance, veteran trader Peter Brandt predicted that the largest crypto asset by market cap will peak at $150,000.

Also, analyst The House of Crypto stated that Bitcoin will trade at $175,000 by next year, while analysts at Standard Chartered raised the bar, predicting that the premier asset will hit $200,000.

XRP Gears for Major Upsurge as It Enters Phase D of Wyckoff Model: Analyst

XRP could be gearing up for a price surge as market analyst Steph suggests the altcoin has entered Phase D of the Wyckoff model.

Steph disclosed this in a recent analysis on X, as the market continues to trade within a range amid the consolidation phase. Notably, Phase D is an important stage in the model, suggesting XRP may soon break out into a bullish trend. 

For the uninitiated, the Wyckoff model identifies market cycles with five different phases. Each phase represents different market actions, from selling pressure to accumulation, and finally, a strong price rally. 

XRP Moves Through Wyckoff’s Phases

Notably, XRP started Phase A in Q2 2021 with a sharp decline, which the model calls the Selling Climax (SC). During this phase, XRP’s price dropped from the $1.96 high of April 2021 to a floor of $0.31 in September 2022. This marked a period where sellers dominated the market. 

However, a minor rebound called the Automatic Rally (AR) followed this bearish phase, resulting in a recovery that led to $0.53 in October 2022, marking the end of Phase A. This rebound showed the first signs of buyers beginning to absorb the selling pressure.

In Phase B, XRP traded in a range between $0.35 and $0.58, briefly spiking to $0.94 in July 2023. This stage is the “Building the Cause” phase, where smart money began accumulating XRP. The SEC case summary judgment last July bolstered this accumulation.

XRP Wyckoff Method Steph is Crypto
XRP Wyckoff Method | Steph is Crypto

Notably, XRP experienced multiple Secondary Tests (ST), where the price tested both the SC and AR levels. These tests help confirm the trading range. Ultimately, Phase B ended in October 2023, with XRP changing hands at $0.66.

The next stage was Phase C, where a Spring occurred. The Spring is a final test of the market’s strength, leading to a temporary dip in price. For XRP, this dip took the price to $0.38 in July this year before a rebound above $0.65 four weeks later.

This phase is important as it shakes out weak hands, trapping sellers before the real move up begins. After the Spring, XRP’s price returned to its trading range, confirming that buyers were firmly in control.

XRP Builds Strength in Phases D and E

Now, XRP has entered Phase D of the Wyckoff model. In this stage, prices begin to rise consistently. For XRP, this upward momentum is already visible, with its price moving from $0.50 to the $0.66 top late last month.

One of the most important aspects of the Phase D is the Last Points of Support (LPS), where minor pullbacks occur, but they form higher support levels each time. These pullbacks serve as platforms for the price to move higher.

If XRP continues to follow this model, the next stage will be Phase E. In this phase, the price rallies massively as the uptrend becomes fully established. According to Steph’s chart, XRP price could surpass the $2.8 level during this phase.

Analyst Predicts an 8,032% Surge in Dogecoin Price to $10

0

Seasoned market analyst Ali Martinez has asserted that Dogecoin will surge substantially, predicting the leading meme coin would trade at a two-digit price.

In today’s Dogecoin news, crypto expert Ali Martinez maintains that the $18 billion market-capped meme coin will surge extensively. This time, Martinez asserted that DOGE would trade at $10.

In a tweet on Tuesday, Martinez implied that a Dogecoin price uptick to double figures was possible, attaching an accompanying chart to back his assertions. Notably, a surge to $10 from the current market price would mean DOGE would grow 8,032%.

A Realistic Price Call?

Per the accompanying chart, Martinez based his $10 price speculation on Dogecoin’s price uptick from the base of its rising wedge on the 1-week timeframe. The analyst speculated that a move from the lower range to the tip of the wedge would translate to an exponential growth above $10.

Dogecoin Price Prediction per Ali Martinez

However, the price call was met with pessimism, especially from commenters. Several users questioned the practicality of the price speculation, citing different theories to their argument.

A user drew Martinez’s attention to Dogecoin’s potential market cap if it trades at $10. From calculations, Dogecoin would have a cap of $1.48 trillion, surpassing Bitcoin’s. Notably, Bitcoin has a market cap of $1.33 trillion.

While a few others believed it could be possible, they believed it would take multiple bull cycles and huge fund injections to achieve the $10 and $1.48 trillion price and market cap.

It bears mentioning that the $10 speculation was one of Martinez’s lofty Dogecoin price calls. Besides this, the analyst argued in February that the memecoin market leader would surge by 28,770% to $24.

Holders Dump Dogecoin Amidst Price Underperformance

Meanwhile, the number of wallets holding DOGE has reduced considerably as the meme coin’s price has failed to meet expectations. Data from Santiment shows that non-empty DOGE wallet addresses dropped to 6.62 million, the lowest since April 25.

The chart shows that the number of Dogecoin holders was on the rise from April to October 2024, reaching 6.74 million earlier this month. Notably, an earlier report where 19,630 new addresses were created on the Dogecoin ecosystem in one day backed this surge.

However, Santiment’s data on Tuesday shows a sharp decline by 106,600 addresses after the peak earlier in the month. The crypto data intelligence platform cited frustration over DOGE’s recent performance as the reason behind the dip, asserting that traders moved to other assets with quicker price pumps.

Nevertheless, DOGE has increased over 8% in the past 24 hours amidst a broader market uptrend. The meme coin trades at $0.1252 at the time of writing.

Worldcoin Breakout Targets $3.50: Will It Surpass the 200-Day EMA?

With a bullish trend in action, Worldcoin (WLD) eyes the $3.50 price target with a post-retest rally.

After a 62% rise over the last 30 days, Worldcoin is on a positive growth trajectory. Currently, the WLD token is trading at $2.33, with a 24-hour drop of 8.20%. However, in the past week, the WLD coin has increased by 25.46%.

Maintaining a market cap of $1.25 billion, the WLD coin shows a recovery rally ready to explode as the broader market recovers. Will this recovery rally cross above the $3 mark? Let’s find out. 

Worldcoin Price Analysis

Worldcoin is showcasing a falling wedge breakout rally, gaining momentum on the daily chart. The bullish reversal for the WLD coin began from a 40-day low of $1.28.

Currently, it has increased by 81% with a current market price of $2.32. The falling wedge breakout rally took the form of a rising channel pattern. The recent bull cycle within the rising channel led to three massive bullish engulfing candles, accounting for a 43% jump from $1.6855 to $2.4160. 

Worldcoin price chart

The rally extended from October 11 to October 14. Despite the massive surge in bullish momentum, Worldcoin failed to reach the 200-day EMA, which stands at $2.70.

This led to a bearish doji candle, indicating bullish exhaustion for the WLD coin, resulting in an intraday pullback of 2.66%. The price action reveals an evening star pattern.

Nevertheless, the pullback comes as a retest of the broken resistance trendline and teases a post-retest reversal. Furthermore, the recent two daily candles reveal a lower price rejection, increasing the chances of a bullish bounceback. 

Will Worldcoin Surpass $3?

The uptick in the 50-day EMA (orange line) takes a bullish reversal as the WLD coin market sentiment improves. Furthermore, the underlying momentum grows as the MACD and signal lines maintain a positive alignment. Hence, the technical indicators support the possibility of an uptrend. 

Based on the price action analysis and the technical indicators, the near-term resistances are the 200-day EMA at $2.70 and the $2.95 resistance level. In case of a highly motivated bullish journey ahead, the AI token could hit the $3.50 mark in the October rally. 

On the flip side, the crucial support below the broken trendline is at $2.11 and $1.85. 

Analyst Predicts Number of Days In XRP Breakout, Sets $7.5 Price Target

0

Prominent market analyst EGRAG has identified an important resistance level for XRP, coinciding with the “Genuine Wake-Up Line.”

This crucial price level could mark the start of a major price uptick for XRP if the altcoin decisively breaks above it. In his latest analysis, EGRAG spotlighted XRP’s current position near the price zone despite the ongoing market pressure.

XRP Approaching Breakout Zone

Over the past few months, XRP has been trading within a narrowing price range. The accompanying chart shared by EGRAG calls attention to multiple structures that signal an imminent breakout. 

Amid the range-bound movements, XRP has been consolidating inside two overlapping triangle formations—a smaller white triangle and a bigger yellow triangle. These formations show the tension between buyers and sellers.

XRP Genuine Wake Up Line EGRAG Crypto
XRP Genuine Wake-Up Line | EGRAG Crypto

Currently, XRP approaches the apex of these triangles. According to EGRAG, XRP has a maximum of 70 days remaining before it reaches the final point of convergence in these triangles. However, a breakout could occur much sooner, with the analyst predicting it may happen within the next 15 to 30 days.

The Genuine Wake-Up Line

The “Genuine Wake-Up Line,” a descending trendline that forms the upper boundary of the triangles, represents the first key resistance level for XRP. The altcoin has tested this line multiple times since 2021 but has yet to break above it.

EGRAG suggests that the pressure is building, and as time progresses, the breakout point becomes easier to reach. The analyst believes XRP’s first major target for a breakout is between $0.61 and $0.62.

If XRP manages to break through this level, the bullish momentum could push prices higher. EGRAG indicates that the first price target following this breakout would be $1.4679. This level aligns with the 1.618 Fibonacci extension.

XRP Long-Term Outlook

While the short-term breakout target hovers around $0.6112, EGRAG presented a much larger price target in the long run. 

The analyst believes that if the bullish momentum sustains itself, XRP could eventually reach the $7.50 level. This ambitious target would materialize if XRP witnesses a strong rally, similar to the one it experienced in 2021 when it soared close to the $2 mark.

Meanwhile, EGRAG’s chart also includes an important long-term support level, referred to as the “Atlas Line.” This upward-sloping line, which acts as the lower boundary of the triangles, has provided a solid foundation for XRP’s price movement over the past several years. 

Notably, should XRP fail to break out above the Genuine Wake Up Line and instead fall below the “Atlas Line,” it could signal a bearish turn. This would increase the risk of further downside, with the “Final Wake-Up Line” coming up as the last line of defense.

Heightened Crowd Sentiment for Bitcoin at $79K Signals Likely Major Correction: Analysis

0

The expected rise of Bitcoin toward the $70,000 price mark has slowed, influenced by a surge in social media chatter.

According to data from Santiment, Bitcoin was on a promising trajectory but hit a roadblock after a spike in bullish sentiment from the crowd earlier this week. The sentiment-driven rally encountered resistance as market dynamics responded to the increased chatter about Bitcoin potentially reaching $70,000.

The data from Santiment indicates that social media mentions of Bitcoin in the $50K to $59K range have frequently correlated with market bottoms. Conversely, mentions in the $70K to $79K range have often coincided with market tops. 

These patterns suggest an inverse relationship between public sentiment and Bitcoin’s price movements. Notably, the rise in mentions predicting a $70K Bitcoin occurred as prices peaked above $67,000. Santiment warns that crowd-driven expectations may be at odds with actual price trends.

Image
image from Santiment

Historical Bitcoin Price Moves and Market Behavior

Santiment’s data highlights the fluctuating nature of Bitcoin’s market behavior concerning social media activity. Mentions of Bitcoin prices in the $50K range tend to increase during periods of bearish sentiment, while mentions of the $70K range spike when optimism is high.

This relationship underscores the influence of crowd behavior, as the market often moves in the opposite direction of prevailing social media sentiment.

In late September, Bitcoin’s price surged above $67,000, triggering heightened bullish calls within the community. However, by mid-October, when Bitcoin tested the $60,000 level, it sparked renewed discussions about potential further price drops.

Now that Bitcoin is surging above $67K and teasing a run for higher levels, the crowd’s bullish sentiment is becoming overheated again, suggesting an impending correction.

Bitcoin’s Resilience Amid Political Neutrality

In a related development, BlackRock CEO Larry Fink recently stated that neither Donald Trump nor Kamala Harris would significantly impact Bitcoin’s long-term trajectory. He noted that Bitcoin has become an asset class of its own, akin to gold, and its uptrend would be independent of regulation or who the next U.S. president is.

Crypto Stakeholders Support Donald Trump Presidential Bid with Bitcoin, Ethereum, XRP Donation Worth $7.5M

0

Cryptocurrency leaders donate $7.5 million worth of cryptos to a political action committee (PAC) supporting Republican presidential candidate Donald Trump. 

According to a recent CNBC report, the PAC Trump 47 revealed the development in a filing submitted on the Federal Election Commission (FEC) website. The filing covered donations for the third quarter of the year, specifically from July 1 to September 30, 2024. 

Notably, contributors gave their donations in different cryptocurrencies, such as Bitcoin (BTC), Ethereum (ETH), XRP (XRP), and stablecoins, like USD Coin (USDC) and Tether (USDT). These donations came from executives affiliated with top crypto-related companies like Ripple, Coinbase, and Andreessen Horowitz.  

Donation Details 

In particular, 18 crypto stalwarts donated around $5.5 million worth of BTC. One of the Bitcoin contributors is David Bailey of BTC Inc., who contributed around $500,000 to Trump 47. Bailey was among the crypto leaders who converted Trump from a skeptic to a Bitcoin evangelist. 

Other significant Bitcoin donors and their contributions include U.S. investor Gary Cardone ($840,000), BitGo CEO Mike Belshe ($100,000), and Bruce Fenton of Chainstone Labs ($60,000).  

Furthermore, seven crypto leaders donated $1.5 million in ETH to the Trump 47 Committee. Of this figure, Trevor Traina of Kresus Labs donated $25,000 worth of ETH. 

For the XRP donations, Ripple’s CLO Stuart Alderoty was among the top donors. As reported earlier, the Ripple CLO donated 624,000 XRP (worth $300,000) in July. Besides donating $300,000 worth of XRP, Alderoty also attended a Trump fundraising event held in June in San Francisco. 

Alderoty’s choice of candidate differs from that of Ripple’s co-founder, who is a major supporter of Kamala Harris. Last week, the Ripple co-founder donated $1 million to a super PAC supporting Harris’ presidential ambition. 

Crypto Fans Give Trump More Support 

The crypto industry has been more supportive of Trump compared to Harris. Industry leaders believe that Trump would save the industry from the SEC’s aggressive approach witnessed under the current administration. Consequently, they have backed Trump’s campaign with heavy donations. 

During his keynote at the Bitcoin conference in July, Trump disclosed that his campaign had received $25 million from the crypto industry. However, he did not reveal how much of this amount constitutes dollar donations. 

Some prominent figures like Tyler and Cameron Winklevoss have played significant roles in bolstering Trump’s crypto donations. The Gemini founders donated $1.1 million worth of Bitcoin each to support Trump’s presidential bid. Additionally, Kraken founder and Chairman Jesse Powell contributed $1 million in ETH to Trump’s campaign earlier this year.