Home Blog Page 1185

Dogecoin Double-Bottom Breakout: Is a Bullish Rally to $0.15 on the Horizon?

With a double-bottom reversal rally, will Dogecoin conclude a long-coming bear trend for a price jump to $0.15?

The crypto market stands at $2.231 trillion, and the bullish recovery in the crypto market refreshes the bullish momentum in meme coins. The highest-ranking meme coin, Dogecoin, with a market cap of $16.97 billion, is currently trading at $0.1156. 

DOGE prices have increased by 2.56% in the past 24 hours and account for a 7.59% surge in the last 7 days. Will the meme coin witness a trend reversal rally as the anticipation of altcoin season increases?

Dogecoin Hangs at the 200-day EMA Balance

Dogecoin is making a comeback with a double-bottom reversal, with the baseline at the $0.10 psychological mark after a massive four-day crash of nearly 20% in early October. The double-bottom reversal breaks the neckline at the 23.60% Fibonacci level at $0.11349. 

Dogecoin price chart

Furthermore, the breakout occurred with a 4.75% jump last night, creating a bullish engulfing candle. However, pressing sudden breaks over the bullish trend, the exhaustion leads to an intraday pullback of 0.97%.

Currently, the meme coin is trading at a discount of 49.27% from the 52-week high of $0.22850. Furthermore, the recent Double Bottom breakout rally struggles to surpass the 200-day EMA at $0.11670. 

The MACD and signal lines give a bullish crossover as Dogecoin gains momentum with the double-bottom breakout. Furthermore, the growing bullish influence results in an uptick in the 50-day EMA, increasing the chances of a bullish crossover with the 100-day EMA. Hence, the technical indicators flash a buy signal for the meme coin and bolster the breakout chances. 

Dogecoin Price Targets

A long-coming resistance trendline stands in the way of a bullish recovery that has failed multiple breakout attempts. However, if Dogecoin breaks the resistance trendline in the upcoming bull market, the 50% and 61.80% Fibonacci levels, at $0.14265 and $0.1580, respectively, are the near-term price targets. 

On the flip side, the immediate support is the 100-day EMA near the 23.60% Fibonacci level at $0.1127. 

Ripple CTO Refers to Kamala Harris Pro-Crypto Policy Statement as Positive News

0

Ripple CTO David Schwartz expresses cautious optimism about U.S. Vice President Kamala Harris’ campaign promises to establish rules for crypto protection.  

As part of efforts to gain the support of black Americans, Harris, who is vying to become the 47th president of the United States, announced her support for the black community. She disclosed that her administration will protect crypto by establishing rules for the industry. 

According to her campaign, 20% of black Americans have had dealings with cryptocurrencies. As a result, there is a need to protect the industry. 

XRP Enthusiasts React as Ripple CTO Refers to Harris Campaign Promise as Positive News 

Harris’ crypto policy statements stirred reactions from crypto enthusiasts, including Ripple CTO David Schwartz. Interestingly, Schwartz expressed cautious optimism regarding Harris’ statement on protecting crypto. 

“I guess this is good news,” Schwartz remarked. 

Expectedly, his reaction did not go well with XRP enthusiasts, who are furious with the current administration for appointing Gary Gensler as SEC Chairman. 

Gensler has spearheaded the SEC’s enforcement actions against several crypto entities, including Ripple. Earlier this month, the SEC filed a notice to appeal the Ripple decision, potentially extending the lawsuit’s resolution to 2026. 

Given this administration’s hostile treatment of crypto, many XRP community members believe Harris is only making empty promises in an attempt to woo crypto voters. They argue that Harris will not implement favorable crypto policies if she becomes U.S. president. 

Better Than Nothing 

Consequently, an X user questioned Schwartz about whether he believed Harris’ promise regarding crypto policy. In response, the Ripple CTO emphasized that Harris’ statement on crypto policy is “better than nothing.” 

He stated that the first step has to be followed by more specific steps. This suggests that Schwartz expects the U.S. vice president to outline her policies for the industry.  

Harris Attracts Crypto Support Despite Her Unclear Policies 

Unlike Donald Trump, Harris has been economical with her plans for the crypto sector. The U.S. vice president has not disclosed how she intends to support the industry if she wins the presidential election slated for next month. 

Last month, Harris’ campaign team released an 82-page document detailing her economic plan for the United States. Out of the 82-page document, she only mentioned digital assets once, suggesting that the asset class is not an integral part of her economic plan. 

Nonetheless, she has attracted the support of top crypto stakeholders, including Uphold co-founder J.P. Theriot and Ripple Chairman Chris Larsen. 

Interestingly, Larsen backed his support by donating $1 million worth of XRP. As reported earlier, Larsen donated the funds to a super PAC supporting Harris’ presidential campaign. 

Analyst Predicts Polkadot Breakout to $20 as DOT Surges Above 20-Day EMA

With a potential trend reversal rally, will Polkdat (DOT) surpass key levels this month for a bull run to $20?

As the cryptocurrency market recovers, Polkadot is coming back into action. With a market cap of $6.68 billion, the DOT price has increased by 4.12% in the past 24 hours. 

As the bullish momentum resurges in Polkadot, the possibility of a bull run beyond the $5 psychological mark increases. Will the uptrend create a trend-reversal rally this October rally? Let’s find out. 

Polkadot’s Reversal Nears 50-day EMA

In the daily chart, Polkadot price action reveals a massive correction over the past six months, accounting for a downfall of 62.62% from the 52-week high of $11.893 to the current price of $4.446. However, the short-term recovery rally teases the possibility of a trend reversal. 

DOT price chart
DOT price chart

Over the last seven days, the bullish reversal from the seven-day low at $3.949 has surpassed the 20-day EMA and is challenging the 50-day EMA. Furthermore, the growing bullish influence sees a bullish crossover between the 20-day and 50-day EMA.

With a bullish engulfing candle that recorded a 5% jump yesterday, the uptrend continues with an intraday growth of 1.58%. The sideways trend near the $4 psychological mark reveals a bullish divergence in the daily RSI line. 

As the bullish divergence grows, the possibility of a bounce back in Polkadot increases. Hence, a price jump above the 50-day EMA will likely unleash a surge of bullish momentum. 

Analyst Predicts Polkadot Bull Run to $20

Crypto analyst Martinez Ali recently shared an optimistic X post for Polkadot, supporting the possibility of a bullish trend. Martinez highlights a bullish reversal possibility by finding a similarity between Fantom’s price action and Polkadot in the weekly chart. 

In predicting the Polkadot future price, Ali highlights that if the bullish pattern holds, the DOT price could reach $9.7, followed by a pullback to $6.7, which would give a breakout rally to the $20 mark. 

Near-term Polkadot Price Targets

Based on the Fibonacci levels, the uptrend reversal rally will have to surpass the 200-day EMA at $5.49 to challenge the 23.60% Fibonacci level at $5.799. With the bullish reversal, Polkadot’s short-term upside target is 38.20% Fibonacci levels at $6.9 and $7.789. 

On the flip side, the 20-day EMA at $4.271 and the $4 mark are crucial support levels for the altcoin. 

Shiba Inu Poised for 400% Surge as Bull Flag Forms, Analyst Eyes $0.000074

0

A leading analyst has projected that Shiba Inu could see a 400% rally to $0.000074, driven by recent price action and technical indicators.

Shiba Inu has been experiencing a mild upswing in recent days. It is now trading at $0.00001834 after briefly touching the $0.000016 range last week.

While Shiba Inu’s gains are lower compared to some other popular meme tokens, analysts believe the second-largest meme coin is gearing up for a major rally.

A TradingView analyst recently asserted that now is a prime time to open a long position for Shiba Inu. The analyst first acknowledged the struggles of long-term holders, noting that Shiba Inu has tanked by 75% since March.

While this correction has hurt those who entered the SHIB market at $0.000045 seven months ago, the analyst stated that several reasons now exist to be bullish on Shiba Inu. These include recent price action, RSI resistance breakouts, trend reversals, and the formation of higher highs with flag breakouts.

Shiba Inu Can Rally by 400% to $0.000074

Indeed, Shiba Inu has seen significant gains over the last 30 days, boasting a 32% increase from the lower range of $0.000013 it witnessed in September. Shiba Inu’s prolonged downtrend reversed in late September when it saw nearly 50% price growth within two days.

This surprising price action has revived optimism around SHIB. Meanwhile, as Shiba Inu corrected its late September gains in October, analysts project that a second phase of the upswing is just around the corner.

Specifically, the TradingView analyst stated that the next impulsive move for Shiba Inu could drive its price to the $0.000074 area, indicating a potential 400% increase.

Notably, this projected increase would mirror what occurred between February and March, when Shiba Inu experienced approximately a 4X gain to reach a three-year high at $0.000045.

Shiba Inu 400 Bull flag
Shiba Inu

However, the analyst acknowledged the possibility of Shiba Inu’s price correction further.

Shiba Inu Resistance to Watch

In a separate analysis on TradingView, market watcher Klejdi Cuni weighed in on the resistance targets Shiba Inu must overcome before attempting to reach $0.000074.

Shiba Inu resistance zones New1121
Shiba Inu resistance zones

Cuni acknowledged that Shiba Inu is primed for another major rally. However, he believes SHIB faces significant resistance ahead.

The immediate resistance is at $0.00001865. At the time of the update, SHIB traded around $0.00001796 but has since surpassed this highlighted resistance. As of this report, Shiba Inu has already established an intraday high at $0.00001893, coming close to reclaiming $0.000019.

Looking ahead, Shiba Inu faces its next resistance levels at $0.00001969 and $0.00002094.

It’s worth noting that Shiba Inu previously cleared these obstacles within a 24-hour window last month. Specifically, SHIB surged from a low of $0.00001494 on September 26 to $0.00002146 by the next day, highlighting the meme coin’s ability to overcome significant hurdles when its bull run commences.

Veteran Analyst Brandt Spots Bullish Reversal in Ethereum as Inverse Head and Shoulders Forms

0

Veteran market analyst Peter Brandt has recently identified a potential bullish reversal pattern forming in Ethereum (ETH).

Brandt’s latest analysis highlights the development of an inverse Head and Shoulders (H&S) pattern in Ethereum’s price chart, which could signal a price surge if certain conditions are met.

The current price level of $2,617 brings Ethereum closer to the critical neckline resistance, which will be pivotal in determining the next price movement.

Head and Shoulders Bottom Pattern in Focus

According to Brandt, the pattern is forming as a result of several key price movements. The left shoulder of the pattern emerged around late July to early August when Ethereum’s price dipped to levels around $2,330.

This was followed by a recovery, but a subsequent price drop in September formed the head, marking a lower low of around $2,253.

The right shoulder began to take shape in early October when the price dipped again, but support was found above $2,330, signaling a weakening of bearish momentum.

One of the key aspects of this pattern is the neckline, which slopes slightly downward and connects the highs reached during the retracements between the shoulders and the head. This neckline is currently acting as resistance.

A confirmed breakout above this neckline would indicate a bullish reversal, potentially leading to significant upward price movement for Ethereum.

Expert Analysis Points to $6,000 Potential

While Brandt’s analysis focuses on the head and shoulders bottom pattern, fellow analyst Ali Martinez has introduced an alternative perspective. Martinez’s analysis centers around Ethereum’s movement within an ascending price channel on the weekly chart.

This channel has historically seen Ethereum’s price bounce off the lower boundary, leading to substantial price increases.

Martinez highlights several instances where Ethereum’s price surged after reaching the channel’s lower boundary. For example, in July 2023, the cryptocurrency experienced a 130.77% price increase following one of these bounces.

A similar event saw the price rise by 168.88% from $1,500 to $4,150 earlier this year. If this historical pattern holds, Martinez projects that Ethereum could potentially rise to $6,000, provided the price maintains its support level at $2,300.

FTX Unstakes Over 178,000 Solana Tokens Amid Bankruptcy Reorganization Approval

0

FTX continues its regular monthly Solana redemptions following a U.S. court’s approval of its reorganization plan.

Early on October 15, FTX’s staking address, linked to FTX/Alameda, redeemed 178,631 SOL tokens valued at over $128 million at current market prices.

This recent move continues a trend observed over the past few months, where similar-sized transactions occur between the 12th and 15th of each month. 

These SOL redemptions are anticipated to find their way to major crypto exchanges such as Coinbase and Binance, especially after FTX’s reorganization plan gained approval.

Under this plan, over $14 billion is allocated to customer payouts. The reorganization plan’s implementation is likely to prompt further asset liquidations, including substantial Solana holdings.

Ongoing SOL Transfers and Market Impact

FTX and Alameda Research have been steadily offloading their SOL assets in recent months. As of September, the firm unstaked over 530,000 SOL, valued at approximately $71 million. These assets were redistributed across multiple addresses, with monthly SOL redemptions averaging around 176,700 tokens, valued at $23.5 million.

On one occasion, a single redemption amounted to 177,693 SOL worth $23.75 million. Despite these frequent transfers, FTX and Alameda retained a large stake of approximately 7.06 million SOL, worth around $945.7 million as of mid-September.

The potential for further liquidations has raised concerns among investors, as increased supply of SOL in the market could negatively affect its price. With FTX’s continued redemptions and the reorganization plan enabling asset redistribution, the cryptocurrency’s price may face downward pressure if substantial amounts of SOL are sold off in the coming months.

FTX’s Reorganization and Debt Repayments

The confirmation of FTX’s reorganization plan by the U.S. Bankruptcy Court on October 7 marked a pivotal development for the collapsed exchange.

Under the approved plan, 98% of the company’s creditors by number will receive 119% of their allowed claims. This distribution, expected to occur within 60 days of the plan’s effective date, depends on compliance with know-your-customer (KYC) and other regulatory requirements.

FTX has projected that the total value of assets recovered will range between $14.7 billion and $16.5 billion. This sum includes assets controlled by the Chapter 11 Debtors and those under the Joint Official Liquidators of FTX Digital Markets, Ltd. (Bahamas) and FTX Australia.

Bitcoin Eyes Breakout Run To $78k as ETFs See Record Inflow

As Bitcoin momentarily reclaims $66k, the bullish sentiments have peaked, and investors are anticipating a breakout rally. Will Bitcoin surpass $70k? 

With a 5.12% surge last night, Bitcoin made a bullish engulfing candle to mark a 24-hour high of $66,479. After registering the highest price in the last 16 days, Bitcoin is currently trading at $65,485, with an intraday pullback of 0.89%. Thus, the biggest crypto reflects a bullish exhaustion. 

Will the sudden exhaustion of a bullish trend lead to Bitcoin’s downfall, or does a breakout rally await? Let’s find out now. 

Bitcoin Teases a Channel Breakout Rally

From the recent 7-day low of $58,867, Bitcoin has increased by 11.18%, reflecting a sharp recovery. Currently, the recovery run challenges the overhead resistance trendline of a channel pattern. 

BTC Price Chart
BTC Price Chart

The channel pattern completes a bullish flag in motion, currently holding Bitcoin’s fate. A bullish breakout of the overhead trendline will likely unleash the trapped momentum for the start of a crypto bull market. 

However, the intraday pullback warns of a minor pullback before the highly anticipated breakout rally. With an uptick in the 20-day EMA, the 50-day and 100-day EMA are on the verge of giving a bullish crossover. Hence, the dynamic average lines are flashing a buy signal.

Furthermore, the daily RSI line recovers from under the 50% line and is on the verge of hitting the overbought boundary line. This leads to an uptick in the 14-day average RSI line. Hence, the momentum indicator bolsters the possibility of an uptrend. 

US Bitcoin ETFs Collect $555M Net Inflow

Amid yesterday’s massive price jump, the U.S. spot Bitcoin ETF market witnessed a massive net inflow of $555.86 million. The cumulative total net inflow in the Bitcoin ETF stands at $19.36 billion. 

A massive inflow has registered the highest influx in the U.S. spot Bitcoin ETF market since June 5. Moreover, this marks the eighth biggest inflow since the launch. 

Fidelity’s FBTC led the pack with an inflow of $239.25 million, followed by Bitwise’s BITB with $100.20 million and BlackRock’s IBIT with $79.51 million. None of the listed ETFs registered an outflow, with a net zero inflow in BTCW and DEFI.

Thus, with the growing inflows, the institutional support for Bitcoin grows daily. 

Will Bitcoin Create a New All-time High?

Based on the Fibonacci retracement, Bitcoin has surpassed the 50% Fibonacci level at $63,568, with the next resistance at the 78.60% level at $69,032. By the end of this month, the channel pattern’s potential breakout rally will likely challenge Bitcoin’s all-time high of $73,794. 

The next potential all-time high level is near the $78,318 or the 1.272 Fibonacci level. Meanwhile, if extended, the intraday pullback in Bitcoin can find support at the 50% Fibonacci level at $68,568.

Ripple May Announce Stablecoin RLUSD Launch Date as Ripple Swell Officially Kicks Off

0

Ripple confirms its readiness to host the highly anticipated annual conference, Ripple Swell, in Miami, Florida. 

In a tweet today, Ripple shared a video showing its preparation for its annual conference: “Ripple Swell 2024 in Miami is now loading.” 

The video showed that Ripple had completed the necessary arrangements for the conference’s commencement. Ripple beautified the venue with blue and white lighting, a stage with the inscription “rippleswell,” as well as chairs and tables.

With the venue completely set up, Ripple CEO Brad Garlinghouse has recently welcomed guests to the conference.

Ripple Swell 2024 

For context, Ripple Swell is the company’s annual conference that brings together prominent players in the crypto and traditional finance space, as well as financial regulators. 

These experts discuss the latest trends and developments within the industry, including identifying and proposing solutions to the issues plaguing the crypto sector. 

Ripple Swell 2024 is the 8th edition of the company’s annual conference. It is a two-day conference slated to hold on October 15 – 16, 2024, in Miami, Florida. Although the event is expected to officially commence today, October 15, the welcome reception took place yesterday from 4:00 PM to 7:00 PM (ET). 

Today’s session is scheduled to start at 7:30 AM (ET) and conclude by 9:00 PM (ET). A key agenda item includes a regulatory fireside chat featuring Ripple’s CLO Stuart Alderoty and NYDFS’ Superintendent Adrienne Harris. 

The Ripple Swell 2024 conference boasts an impressive line-up of speakers, such as Garlinghouse, former FDIC Chair Sheila Bair, Tim McCourt of CME Group, Coinbase CSO Philip Martin, and Global Head of Blockchain and Digital Assets Francisco Maroto.

These experts will speak on various topics, including stablecoin, tokenization, and crypto exchange-traded funds (ETFs).  

Will Ripple Announce RLUSD Launch Date at Ripple Swell? 

XRP holders usually look forward to the Ripple Swell conference because it paves the way for exciting updates on new partnerships and projects. 

In this year’s edition, the community will be looking for new collaborations that could drive XRP’s adoption and the potential launch date for Ripple USD (RLUSD) stablecoin, among others. 

The stablecoin project has been in private beta on Ethereum and XRP Ledger (XRPL) since August 9. Despite Ripple minting millions of RLUSD tokens, there is still no official date for the stablecoin’s mainnet launch. Whether Ripple will disclose the stablecoin’s launch date at the Ripple Swell conference remains unclear. 

Cuban Explains Why Harris’s Team Cannot Hold Bitcoin, Says Kamala is Ahead of Trump Who ‘Pushes Tokens’

0

Billionaire Mark Cuban explains why the current administration cannot hold Bitcoin, arguing that Harris is ahead of Trump in terms of understanding the crypto industry.

Mark Cuban addressed the U.S. government’s Bitcoin holdings in response to comments by Dogecoin co-creator Billy Markus. Markus particularly commented on lawmakers’ lack of understanding of cryptocurrency.

Cuban, a businessman and vocal supporter of cryptocurrency stressed how Harris’ approach differs from Trump’s stance.

The businessman notes that in about 100 days, Kamala Harris will have shown progress, distancing herself from Biden and surpassing Trump, who “intends to push tokens.”

Cuban pointed to the World Liberty Financial project, which plans to launch its native token, WLFI, soon. This governance token will allow users to vote on the platform’s future development but differs from most crypto assets as it will be non-transferable and non-yielding.

As per our recent report, the World Liberty Financial project has already received over 100,000 whitelist signups, and the founder of Paxos has joined the coin team.


Additionally, Cuban had earlier highlighted a law that prevented the U.S. government from transferring 200,000 Bitcoins currently held by the treasury. He expressed concerns about how the government plans to handle this substantial holding.

While he advocated for holding onto the confiscated Bitcoin, he explained that the law requires the treasury to dispose of assets it takes possession of in ways that benefit taxpayers.

Cuban’s Interaction with Harris’ Team

Cuban revealed that he had been in discussions with Harris’ team about this issue. He shared that the team explained their legal obligation to avoid selling Bitcoin in a way that would disrupt the market.

Cuban, concerned about the potential impact of such a sale on Bitcoin prices, was assured that the treasury has safeguards in place to prevent market disruptions. He noted that Harris’ team emphasized that any sale would avoid negatively affecting Bitcoin’s value.

Cuban also stressed the importance of protecting digital asset holders, especially younger generations, who increasingly use apps like Robinhood and Coinbase for financial transactions. He explained that many Gen Z individuals, particularly men, have a significant portion of their wealth tied up in cryptocurrencies.

According to Cuban, Harris’ team appeared to understand the significance of this demographic and their need to protect consumers and investors in the rapidly growing crypto economy.

Harris Campaign Receives XRP Donation

In a related development, Kamala Harris’ campaign recently received a substantial donation of over 1 million XRP tokens. According to newly disclosed filings, Chris Larsen, co-founder and chairman of Ripple, contributed these XRP tokens to support Harris’ election efforts.

The tokens, valued at $1 million, were donated to the Future Forward USA super PAC.

While the donation occurred in August, details only emerged recently. Importantly, the XRP tokens have not been liquidated but were kept in their original form at the time of the contribution.

This donation has triggered attention within the cryptocurrency community, particularly given the administration’s past criticism from crypto holders, notably XRP investors.

Bitcoin on the Verge of Cracking 200-Day MA with Historic Parabolic Run Set to Follow

0

The ongoing bullish momentum in the crypto market is gaining strength, with analysts highlighting on-chain indicators that suggest a sustained uptrend for Bitcoin.

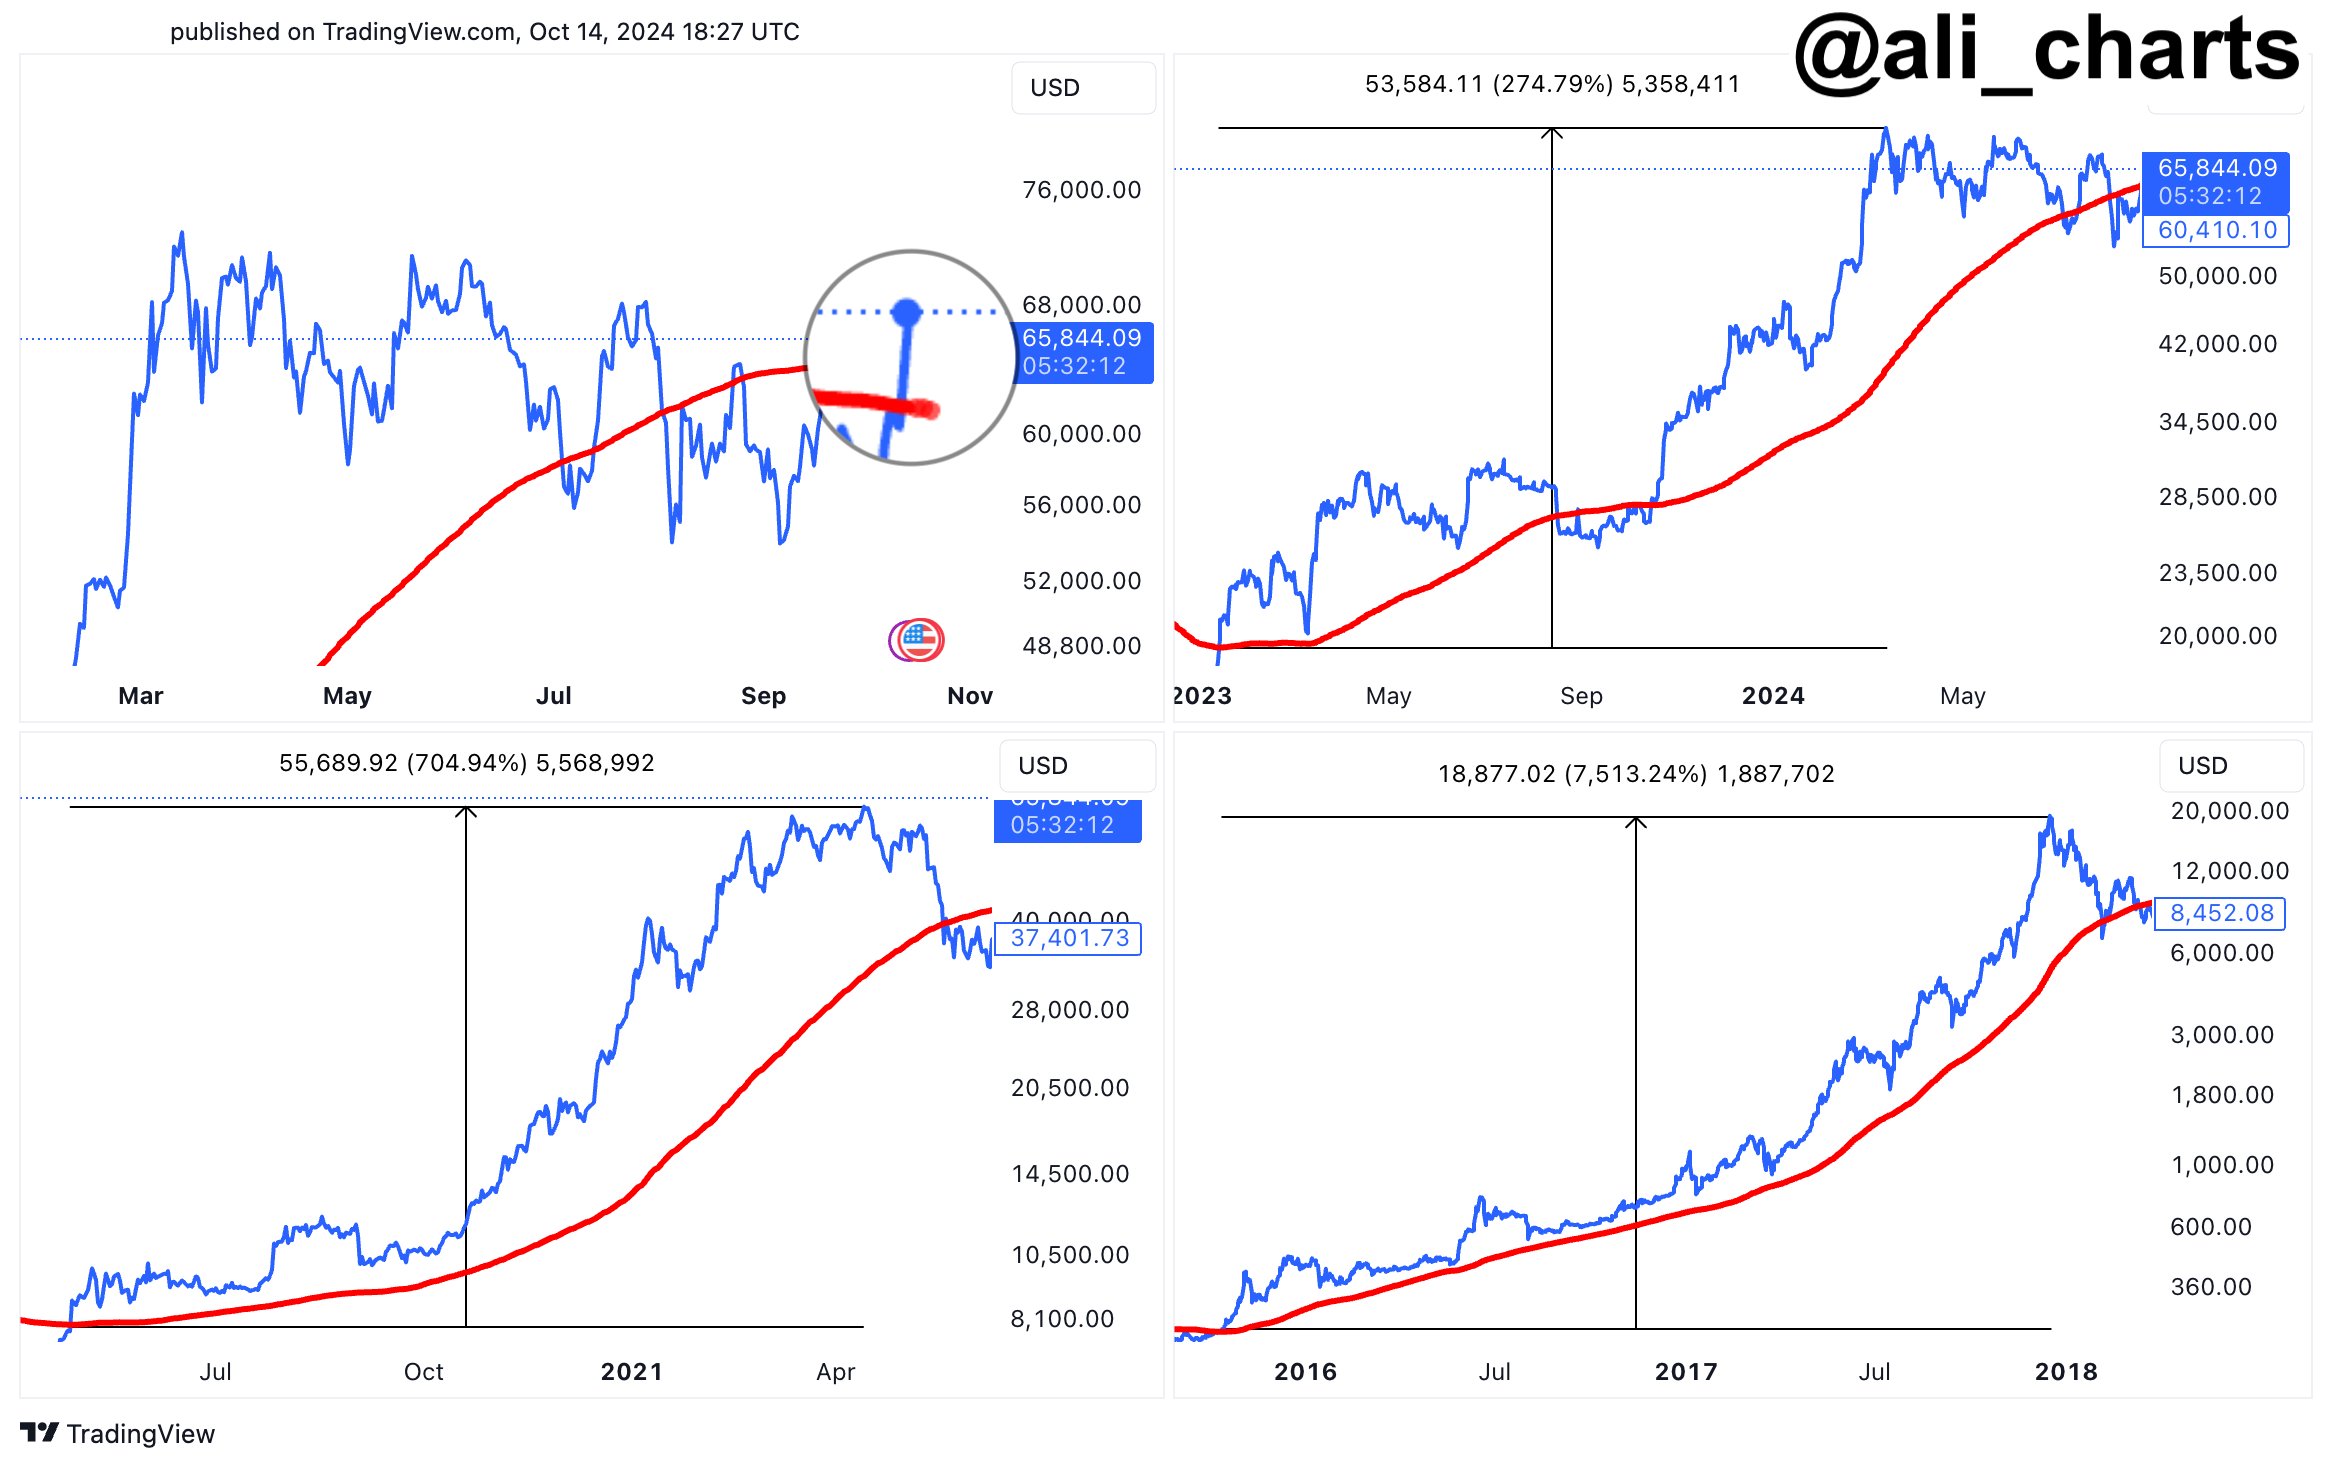
On-chain analysts like Ali Martinez draw insights from Bitcoin’s historical trends around its 200-day moving average. In a Monday post on X, he noted that Bitcoin is again attempting to surpass this key moving average.

Martinez emphasized that in the past three instances when Bitcoin broke above the 200-day moving average, it led to massive parabolic bull runs.

Notably, the 200-day moving average is an important technical indicator that represents the average closing price of Bitcoin over the last 200 days. It is often considered a major trend line for identifying long-term momentum shifts.

The accompanying historical chart illustrates three instances—2023, 2021, and 2017—where Bitcoin broke above this line (indicated by the red line in the charts below). In each case, the price surged significantly after the breakout, entering parabolic bull runs with massive percentage gains.

Image

Bitcoin’s Parabolic Gains Following Each 200-Day MA Breakout

According to Martinez’s chart, the most recent breakout above the 200-day moving average occurred around May 2023. This resulted in a remarkable 274.79% gain as the price surged from approximately $19,400 to over $73,000 by March 2024.

Similarly, in the 2021 cycle, Bitcoin’s breakout above this moving average led to an impressive 704.94% increase, adding $55,690 to its price. The 2017 cycle saw an even more dramatic outcome, with the breakout resulting in an extraordinary 7,513.24% rally, taking the price from around $240 to over $20,000.

These instances confirm the significance of the 200-day moving average in marking the beginning of Bitcoin’s parabolic runs in the past.

In an earlier update, Martinez noted that Bitcoin made an initial attempt to surpass the 200-day MA but faced rejection. However, the leading crypto asset is now making another attempt with its current sustained price gains.

Bitcoin Uptrend in Motion

Bitcoin is currently trading at $65,396, reflecting a 2% gain over the past day and a cumulative seven-day gain of 4.77%.

Martinez has highlighted that Bitcoin could be headed for new highs of around $78K as it has overcome crucial resistance and support targets.

Additionally, prominent market watchers like CryptoQuant founder Ki Young Ju are also bullish on Bitcoin. Young Ju shared on-chain indicators suggesting Bitcoin could withstand short-term selling pressure, preventing significant price dips and paving the way for higher highs.