Home Blog Page 1186

Brandt says Bitcoin to Influence Stock Markets in Future, Identifies Crucial BTC Breakout Level

0

Market veteran Peter Brandt identifies an important price level that Bitcoin needs to breach to break the current range-bound structure. 

in the latest news about Bitcoin, The top trader’s analysis calls attention to several price points and structures, suggesting that Bitcoin is approaching an important zone. This area could determine whether the price moves upward or succumbs to further consolidation or decline.

Bitcoin Struggles

The chart shows a downward-sloping channel that has defined Bitcoin’s movement since Q1 2024. This channel has kept the price fluctuating within a range as support and resistance levels formed. 

Bitcoin 1D Chart Peter Brandt
Bitcoin 1D Chart | Peter Brandt

The most significant among these levels is around $68,224, which Brandt identifies as a “junction of important chart points.” Bitcoin’s movement through this zone is extremely important. 

Brandt called the structure an inverted expanding triangle rather than a traditional bear flag. Notably, this triangle formation could suggest an impending breakout – but only if the price manages to breach the resistance at $68,224. Until this happens, Bitcoin remains vulnerable to more downward pressure.

The premier crypto asset has attempted to break free multiple times, but each breakout has failed to hold. This has created a bearish scenario where supply pressures prevent sustained upward movement, leading to further sideways or downward price action. 

Interestingly, current market realities suggest Bitcoin could be on the verge of knocking above this level, having recently breached $66K amid the rally yesterday. However, at press time, BTC has faced a correction, now trading for $65,395. Bulls need to reignite the momentum to break above the $68K region.

For context, whenever a formation such as this occurs, a breakout could lead to a significant move. However, Brandt stressed that the situation remains fragile until the market sustains multiple closes above this level.

Market Sentiments

Meanwhile, another market analyst, Colin, discussed a different perspective in response to Brandt’s chart. He highlighted the change in market structure, with Bitcoin recently making higher highs and higher lows. This has fueled optimism among traders. 

While some believe the bottom is in and a breakout is imminent, others, including Brandt, remain cautious. Colin agrees with this caution. The resistance around $68,224 remains the defining line between the continuation of the current trend and a bullish reversal.

Colin further spotlighted macroeconomic and political factors. He pointed to potential catalysts, such as upcoming elections or shifts in monetary policy, which could impact market sentiment. 

Bitcoin Market Correlation 

Meanwhile, in a separate disclosure, Brandt emphasized his confidence in Bitcoin’s potential despite the current range-bound movements. He called attention to discussions around Bitcoin’s correlation with traditional assets like stocks, gold, and crude oil is also a topic of debate. 

However, he argued that Bitcoin is becoming an asset class in its own right, with future correlations expected to shift towards BTC influencing other markets rather than being influenced by them.

Shiba Inu Unveils New Financial Partner to Elevate SHIB to the Next Level 

0

The team behind the Shiba Inu ecosystem is further expanding it through a new partnership with Mass Finance Inc. (Mass), a financial solution provider. 

In exciting Shiba Inu news today, The Shiba Inu ecosystem X handle announced the partnership yesterday, emphasizing that the collaboration will elevate SHIB to the next level, especially in the financial sector. 

According to the announcement, Mass will be the financial layer of the Shiba State, with plans to incorporate AI-driven fiscal and legal solutions to the ecosystem. 

Shiba Inu Lead Reacts 

It bears mentioning that the Shiba Inu ecosystem team first hinted about this partnership with Mass during a keynote speech at the recently concluded ETHToronto 2024 conference. 

Shiba Inu’s lead developer, Shytoshi Kusama, confirmed this in an X post yesterday. He said the team first mentioned the partnership during its keynote speech at the ETHToronto 2024 conference. 

The conference, which took place on August 13 – 14, saw the Shiba Inu ecosystem team unveil several upcoming initiatives, including a new partnership with a financial entity. Two months after disclosing the partnership, Shiba Inu has now officially unveiled Mass as this entity. 

Mass Solutions  

For context, Mass offers an all-in-one operating system (OS) that helps businesses streamline their growth processes and setup. At the moment, its financial service platform is in private beta. 

In the meantime, the team behind Mass has made significant strides in the financial sector and has partnered with notable players. It partnered with multinational financial services company Stripe to provide account and money transmission services. Through this partnership, Mass’ funds will be held at Evolve Bank & Trust.

Furthermore, Mass Financial also holds a Visa license that allows it to offer its own Visa Prepaid cards. Commercial financing and business lender Celtic Bank is responsible for issuing the cards to Mass customers. 

Potential Benefit for SHIB 

Shiba Inu’s partnership with Mass Financial marks a significant step toward transitioning SHIB from a memecoin to a utility token. It will also enhance Shiba Inu’s popularity in the financial sector, potentially boosting SHIB’s value in the long term. 

The development coincides with a significant surge in SHIB’s price. Yesterday, SHIB witnessed an intraday increase of 5.31%, elevating its price to a daily high of $0.00001893. 

Although SHIB’s price has retraced to $0.00001819, the altcoin still boasts a 24-hour gain of 2.03% and a weekly surge of 5.19%.  

XRP Targets Set at $9.3, $16, and $26 Based on Standard Deviation, Says Analyst

0

A recent analysis of XRP price movement using Linear Regression suggests the altcoin has some impressive price growth potential. 

This analysis came from market commentator EGRAG, who recently applied this tool to evaluate XRP’s trendline and future price forecasts. 

EGRAG projected a possible price range that stretches from $5 up to $27 by analyzing standard deviation bands. The results suggest that XRP’s price could experience moderate to extreme upward shifts, depending on how it reacts to market conditions.

XRP Current Position 

EGRAG confirmed that the XRP price is currently trading near the lower end of the -1 standard deviation band. This indicates that the altcoin is oversold and could be primed for a price correction. 

Linear regression uses standard deviation bands to determine when an asset is either overbought or oversold. When prices hover near the lower end of these bands, as XRP does now, it signals an imminent bounce back toward the mean or average price.

For XRP, the analyst has identified that the mean reversion target – where the price is likely to gravitate back to – is around $1.85 in the short term. 

This value is the midpoint of the regression channel, and returning to it would represent a significant price increase from XRP’s current level. This marks the first potential price shift investors could expect as XRP corrects from its oversold position.

XRP Price Targets Based on Standard Deviation

The upper band of the regression channel, located at +1 standard deviation, is where XRP would enter an overbought region. 

Based on EGRAG’s projections, this level is set at $5.76 in the near term. As XRP approaches this price, it could face selling pressure as it nears the top of its range. 

However, should XRP follow the same trajectory it did during its previous major bull run in 2017, breaking above this upper band would set the stage for much higher price levels.

XRP Price Standard Deviation EGRAG Crypto
XRP Price Standard Deviation | EGRAG Crypto

For longer-term projections, the analyst suggests that the mean reversion target could reach $2.4 in the coming months and $3 within a year. Meanwhile, the upper standard deviation band rises to $7.31 in several months and $9.3 within the year. 

XRP Price Overshooting the Standard Deviation Bands

EGRAG also identified a potential for XRP price to overshoot the +1 standard deviation level. This happened during the 2017 bull run, and the same could occur again. Should it happen, the analyst provides two projection models based on historical data from previous XRP price cycles.

The first model assumes a 180% price overshoot beyond the upper standard deviation band. Using this calculation, the price could hit $16 if such an event occurred. The 6-month target under this scenario would be $21, while the 1-year projection could reach an impressive $27.

Image

Meanwhile, the second model takes a more conservative approach, predicting a 110% overshoot. For this, the XRP price could surge to $12 immediately, reach $26 in six months, and fall to $20 within a year.

Image

BitBoy Says Big XRP Announcements Coming Soon Regarding Global Adoption

0

Ben Armstrong, also known as BitBoy, has recently hinted that a major announcement regarding the global adoption of XRP is on the horizon.

Armstrong recently made this suggestion on X while engaging with XRP community figure Edo Farina about XRP being adopted as a world reserve currency by major financial institutions.

In his post, Farina shared an image illustrating key connections between Ripple executives, including chairman Chris Larsen, and major global financial institutions like the Federal Reserve (The Fed), U.S. Treasury, IMF, and the World Economic Forum (WEF).

The image suggests that at least 18 top Ripple officials, both current and former, have had or have ongoing connections with prominent decision-making bodies such as the Fed, IMF, WEF, SEC, and SWIFT.

Image

According to Farina, these connections point to one inevitable outcome: XRP becoming the “World Reserve Currency.” Community commentators like Farina often use this narrative to advocate for a bullish perspective on XRP.

However, BitBoy shared a slightly different view. While acknowledging the legitimacy of these connections and the important role XRP will play in the future financial system, Armstrong disagreed with the notion that XRP will be the global reserve currency. “That is NOT going to happen,” he remarked.

Meanwhile, Armstrong emphasized that BRICS Pay—a new payment system being developed by BRICS nations—has a stronger chance of claiming that status than XRP.

Big Announcements Coming Soon for Further Clarity

Nonetheless, Armstrong highlighted that Ripple and XRP will play a crucial role in shaping the future financial landscape. This suggests that while XRP may not become the world reserve currency, its influence on future financial infrastructure is undeniable.

He further explained that his disagreement with Farina’s perspective arises from access to different information that supports an alternative thesis.

“We both agree that XRP is going to thrive and play a significant role in the financial system; it’s just the ‘how’ that we have different opinions on,” he said.

In this context, he hinted at upcoming announcements that could provide further clarity on the matter.

Analyst Says XRP Explosion is Coming After Breaking This Level

0

Analysts predict a potential XRP price explosion after breaking a crucial Fibonacci level corresponding to a resistance zone.

XRP continues to hover around $0.53, showing a flattened and negative price trajectory over the past week. In the monthly timeframe, the seventh-largest altcoin is down by over 7%.

Despite this lackluster performance in the short-term window, analysts closely watching XRP’s price action foresee an imminent trend change. Notable market observer “Random Crypto Pal” recently outlined a development that could lead to an explosive price run for XRP.

Watcher for XRP Price Explosion After Breaking This Level

In a post on X, the analyst discussed the significance of XRP breaking above the 0.236 Fibonacci retracement level. He noted that once this level gives way, a price explosion for XRP is likely.

The confidence in this forecast rests on the observation that a similar occurrence was instrumental to the XRP all-time high rally seven years ago.

The accompanying historical chart shows that when XRP’s price crossed the 0.236 Fibonacci level in mid-2017, it initiated and sustained an upward movement that culminated in an all-time high by January 2018.

Image
XRP Chart by Random Crypto Pal

Random Crypto Pal is not alone in this optimism. In an earlier update, analyst Egrag noted that XRP investors could anticipate a historic price surge based on various significant Fibonacci levels such as 0.5, 0.618, and 0.702, which have historically been points from which XRP prices surged dramatically.

Based on these levels, Egrag argued that even a price target of $44 is a less optimistic estimate for XRP.

XRP’s Path to Surpass the 0.236 Fibonacci Level at $0.80

Notably, the 0.236 Fibonacci level corresponds to a price above $0.80. Essentially, the analyst hopes for history to repeat itself once XRP reclaims this price point, anticipating a historic rally similar to the one that occurred seven years ago.

XRP needs to rise by 48.78% from its current price of $0.5377 to reach $0.80. This crucial $0.80 level poses a formidable resistance for XRP.

For instance, even during the broader crypto market frenzy in the first quarter of the year, XRP did not reclaim this threshold. Instead, it only experienced mild gains that quickly lost momentum after reaching the $0.74 price mark.

Currently, crypto market sentiment is finely balanced between bearish and bullish, as analysts are divided on Bitcoin’s next move in the coming weeks. This situation weakens XRP’s ability to achieve the necessary 48% gain to hit $0.80, which the analyst believes is crucial for further upward movement.

Historical Pattern Signals Ethereum Set to Pump by 130% to $6,000

0

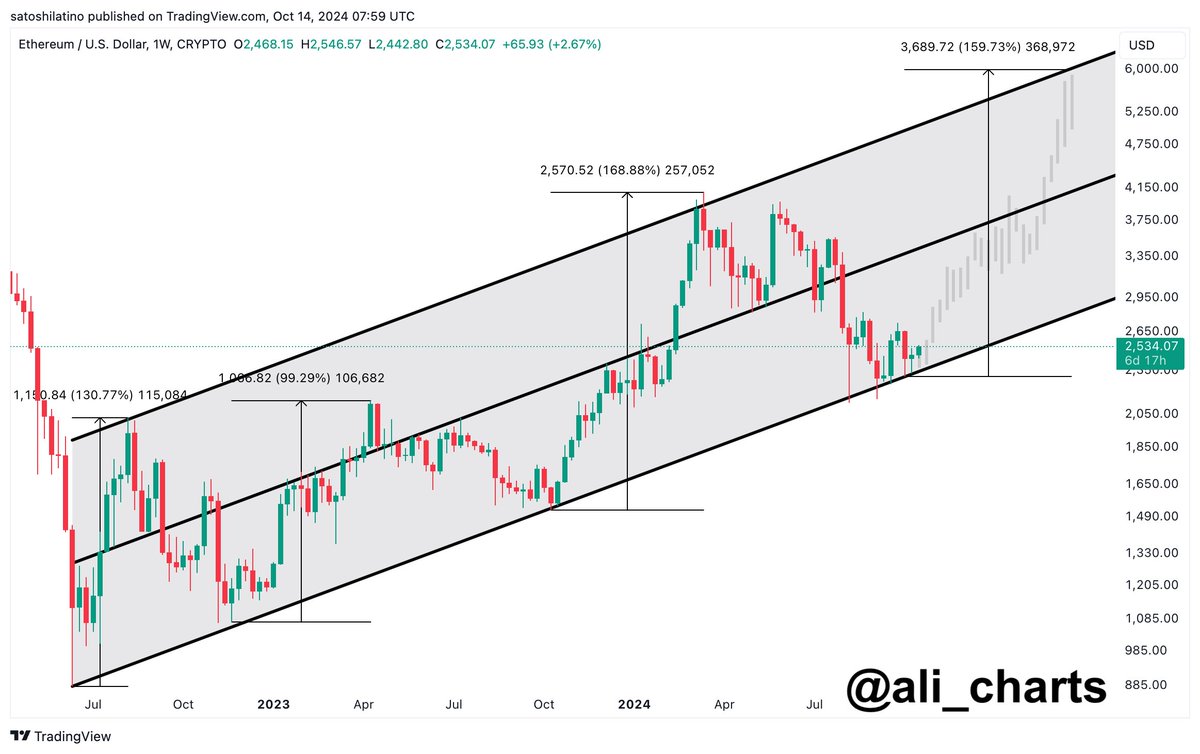
Ethereum could rise to $6,000, says crypto analyst Ali Martinez, citing historical price surges.

The altcoin king, Ethereum (ETH), appears to be on the verge of a significant upsurge, according to a recent analysis by Martinez. Using a weekly chart, Martinez highlights Ethereum’s price action, focusing on the asset’s movement within an ascending channel. A key takeaway from the analysis is the cryptocurrency’s tendency to bounce upward whenever it reaches the lower boundary of this channel.

Image

Indicators of Potential Price Increase

The chart shared by Martinez demonstrates Ethereum’s recurring behavior of bouncing off the lower boundary of an ascending channel. Each of these bounces has led to notable price increases.

Historically, Ethereum has seen price surges of about 130% following each test of this boundary. For instance, around July 2023, Ethereum experienced a 130.77% price increase after hitting the lower boundary. Another significant move resulted in a 99.29% rise, while the most recent bounce led to a remarkable 168.88% increase, raising the price from around $1,500 to approximately $4,150 in March of this year.

According to Martinez’s projection, Ethereum could potentially rise to $6,000 if this pattern holds. However, this is contingent upon the price maintaining its support level at $2,300. If Ethereum sustains this level, the expected price increase would add about $3,689 to its current value.

Break-Even Indicators Offer Insights

In parallel with this technical analysis, the market intelligence platform IntoTheBlock has provided further insight into Ethereum’s potential trajectory. Their break-even indicator, which tracks ETH purchases across all addresses, shows that approximately 5.84% of Ethereum addresses are set to break even if prices rise to around $3,000.

This data adds to the bullish sentiment surrounding Ethereum’s potential upward movement, indicating that more ETH holders could benefit if the price continues to climb.

Notably, at press time, the projected uptrend in Ethereum is already unfolding. The altcoin market leader trades at $2,635, boasting an 8.01% gain in the last 24 hours. A price surge to $6,000 from this level would net investors an additional profit of 127%.

Shiba Inu Burn Rate Jumps 14,575% Amid 279,650,585 SHIB Burn

0

Burns in the Shiba Inu ecosystem have spiked 14,575% in the past 24 hours following the incineration of over 279 million SHIB.

The Shiba Inu community’s efforts to reduce the token’s supply has ramped up in the past day after a notable spike in burn rate. Data from community-driven Shiba Inu burn tracker Shibburn revealed that 279,650,585 SHIB were permanently destroyed in the past 24 hours.

Burn Details

Shibburn data shows that the massive burn happened over five transactions on Monday, with the incinerated SHIB worth $5,084 at the current market price. Notably, three transactions stood off due to the substantial amount involved.

The largest single burn, which accounted for 99.26% of the incineration in the past 24 hours, occurred by 8:30 UTC today, involving 277.58 million tokens. Further data from Etherscan shows that the wallet belongs to Coinbase.

Another notable burn activity saw 2 million SHIB transferred from a Robinhood-tied wallet for incineration. This transaction which occurred at 4:57 UTC today.

Furthermore, another exchange-related wallet also transferred Shiba Inu to the burn wallet on Monday. Etherscan reveals that an address tagged “Kraken 7” moved 44,444 SHIB for permanent destruction.

It bears mentioning that the burn rate increased by 14,575% in the past 24 hours, with the 279 million SHIB incinerated today far exceeding the 1.9 million tokens for Sunday.

Shiba Inu Price Reacts

Notably, the burn rate spike correlated with a considerable appreciation in the Shiba Inu price. SHIB has increased 4.12% in the past 24 hours, trading at $0.00001822 at the time of writing.

The increased burn rate is another factor that could bolster the bullish sentiments around the Shiba Inu ecosystem. Also, positive momentum from the latest 83.3 billion SHIB whale accumulation has prompted calls for new highs.

Meanwhile, analyst Javon Marks asserted that SHIB is set for a 342% surge to $0.00008 after breaking out of a falling wedge. Notably, the price call correlates with another pseudonymous market watcher, who predicted a similar growth to $0.000074.

Bitcoin Will Continue to Range Until It Can Break Above or Below These Crucial Levels: Analyst

0

Bitcoin consolidates post surge, with prominent market analyst Egrag noting key resistance and support levels to watch for a decisive move.

Bitcoin’s recent price movement points to a consolidation phase, as it fluctuates just below the $65,000 mark. While bullish momentum appears to be building on various timeframes, market analysts remain cautious. 

Analysis Points to Key Levels

According to Egrag Crypto, a prominent analyst, the three-day time frame for Bitcoin shows a concerning trend.

Per his chart, the five local tops candle formation indicates wicks from the upside, suggesting significant selling pressure at the peaks. This pattern is seen as a bearish indicator in the short term, as traders seem to be offloading positions around these levels.

However, Egrag emphasized the importance of breaking above $66,500 for the next bullish push. Should Bitcoin surpass this level, the next target could be $70,000 or beyond. However, failure to close above this level might signal a deeper retest, with a projected drop to $47,000. 

Such a retracement would represent a healthy correction following Bitcoin’s breakout earlier in 2024. The analyst also noted that the market remains in a range between $47,000 and $70,000 until one of these levels is breached. This range leaves both bullish and bearish outcomes in play, depending on market conditions and price movements.

Uncertainty as Election Looms

Looking ahead, Egrag pointed out that the broader macroeconomic scene could also impact Bitcoin’s next move. 

The upcoming U.S. presidential election, with both Kamala Harris and Donald Trump vying for office, could create additional market volatility. 

Historical October Trends Offer Insights

Meanwhile, Rekt Capital, another market analyst, recently discussed Bitcoin’s potential price action. Rekt Capital analyzed Bitcoin’s historical performance in October, noting that while it has typically performed well this month, it has closed in the red on two notable occasions: in 2014 and 2018. 

These negative closings followed bull cycles and coincided with broader crypto winter periods. However, the analyst also pointed out that this year is different, given the April Bitcoin halving.

This year’s October performance has been somewhat surprising, with Bitcoin experiencing a 3.78% deficit from its September closing price by October 11. Bitcoin even dipped to a three-week low.

Despite this, Rekt Capital remains confident that Bitcoin will not close October in the red, citing the absence of a bearish cycle presently. The analyst also highlighted that the historical trend of post-halving rallies supports the belief that Bitcoin is still in a favorable position.

Bitcoin Buy Walls on Exchanges Now Robust Enough to Neutralize Selling Pressure: Analysis

0

Ki Young Ju, founder of the analytics platform CryptoQuant, has identified compelling reasons to believe that the Bitcoin market may not experience a massive dump, at least for the time being.

Young Ju shared this perspective on X today after analyzing the “Buy/Sell Quote Volume Difference” for Bitcoin across all centralized exchanges. This metric highlights the difference between buy and sell walls on liquid platforms.

The industry analyst noted that Bitcoin’s buy walls across all centralized exchanges are currently robust enough to offset the sell walls. He strengthened his argument by comparing the 2020-2022 cycle with the current 2023-2024 cycle.

Bitcoin Buy/Sell Wall in the 2020-2022 Cycle

From mid-2020, buy walls (the green areas in the chart below) initially dominated as Bitcoin’s price surged to new all-time highs. However, starting in May 2021, sell walls (red areas) thickened, indicating that more traders were trying to sell BTC.

This shift aligned with the initial price correction from around $60,000 to $30,000 before a rally to an all-time high in November 2021. During the recovery phase, sell walls continued to thicken, intensifying until the end of the cycle, with sellers dominating throughout most of 2022.

This period coincided with Bitcoin’s drop from approximately $69K to $15K between November 2021 and 2022.

Image

In contrast, the 2023-2024 chart began with the dominance of sell walls (red), but a notable shift has been observed as 2024 progresses.

Specifically, the red area has started to shrink as buy walls grow stronger, indicating increased buying interest. Overall sentiment now appears bullish, with buy walls neutralizing sell pressure in the Bitcoin market. As of October, the Buy/Sell quote volume of Bitcoin across exchanges has flattened.

Image

Is Bitcoin Still in an Uptrend?

This trend highlights a shift toward accumulation and buyer strength. Ki Young Ju leveraged this latest metric to bolster his belief that Bitcoin remains in an uptrend and that a new all-time high is still within reach this season.

In earlier commentary, Young Ju emphasized a bullish perspective by noting that “ancient whales” remained inactive. His analysis showed no significant recent deposits to exchanges from these whales, suggesting they may be waiting for more favorable market conditions.

Historical trends link their activity to Bitcoin’s past rallies in 2017 and 2021. However, their movements have remained flat, even as Bitcoin peaked in March 2024.

Notably, Bitcoin reclaimed the $65K mark today after testing the $59K range last week.

Shiba Inu Lead Addresses Concerns Over Billion-Dollar SHIB Wallets

0

The Shiba Inu community has recently been confronted with controversial claims about the ownership of large SHIB wallets.

Some individuals have claimed they own several high-value SHIB addresses. These addresses control a massive portion of SHIB’s circulating supply. This has raised concerns about the potential market impact if these wallets are used for large-scale sales. 

Shiba Inu Lead Debunks Ownership Claims

However, Shiba Inu lead developer Shytoshi Kusama has recently debunked these assertions. Kusama took to X to address these claims, urging caution among community members and dismissing the idea that any individuals outside of known exchanges control these large wallets. 

He challenged anyone making such claims to provide clear proof of ownership before further misleading the community. According to Kusama, the claimants can easily prove their ownership by sending a specific amount of SHIB from the alleged wallet to another address, which would clearly validate their connection to the wallet in question.

The lead developer made it clear that unless someone can verify their claims by sending a precise number of SHIB tokens, investors should dismiss these statements as baseless. He cautioned the community to avoid falling victim to these misleading assertions, which could trigger unnecessary fear and affect market confidence.

Large Shiba Inu Holders

For context, data from Arkham Intelligence shows that the top 11 largest SHIB holders are exchanges, including major platforms like Binance, Upbit, Crypto.com, Robinhood, BitGo, and OKX. 

These exchanges typically hold large amounts of SHIB on behalf of their users, and as such, these wallets do not belong to individuals.

However, the top 20 SHIB holders include six addresses that are not tied to exchanges. Each of these six addresses holds 5 trillion SHIB tokens, making them some of the most important non-exchange wallets in the ecosystem. 

Collectively, these addresses hold 30 trillion SHIB tokens, which represents around 5% of the total circulating supply. Interestingly, five of these addresses received their tokens in November 2021 from another address, identified by “0x2…e5E”

The “0x0…81d” address, in turn, received its tokens from yet another address between February and March 2021. Despite the large amount of SHIB held by these wallets, no tokens have been moved in nearly three years. The Crypto Basic called attention to these addresses in April. 

This prolonged inactivity has triggered speculation within the community, as market participants wonder about the identity and intentions of the wallets’ owners. The lack of movement suggests that these addresses are either held by long-term investors or belong to entities waiting for a specific event before taking any action.

While the claims regarding ownership of these wallets remain unproven, the Shiba Inu community remains cautious. Large-scale sales from these wallets could potentially cause volatility in the SHIB market. However, Kusama’s response seeks to help ease some of these concerns.