Home Blog Page 1242

Top Analyst Says 100% Certain XRP to Hit $100: Here’s Why

0

Crypto analyst and YouTuber Levi Rietveld has boldly declared that XRP will skyrocket to $100 once a specific market milestone is reached. 

In a recent video, Rietveld confidently stated that this explosive price action could come much sooner than many investors anticipate, as a significant accumulation phase is already underway. According to Rietveld, those who act now could see life-changing gains as XRP prepares for its next major breakout.

Why XRP to $100 is “Certain”

Rietveld’s confidence in this bold outlook for XRP rests on commentary from Cathie Wood, the CEO of Ark Invest, one of the prominent asset management firms offering Bitcoin ETF shares.

Additionally, he draws inspiration from the growing institutional adoption of cryptocurrencies, particularly through Bitcoin ETFs. He emphasized that as institutions like BlackRock and JPMorgan introduce crypto offerings to their wealthiest clients, liquidity will flow into the broader market, bringing altcoins like XRP to new heights.

Ethereum ETFs have already been approved, and Rietveld suggests that an XRP ETF could likely follow. Last week, hopes for an XRP ETF heightened as Grayscale introduced an XRP Trust for both individual and institutional investors.

In the video, Rietveld further supported his bullish outlook for XRP with Wood’s projection of $650,000 for Bitcoin within this decade. Interestingly, the Ark Invest CEO noted that the company had issued this target as a base case prior to the arrival of ETFs investing in Bitcoin.

With Bitcoin spot ETFs now a reality, Wood stated that Ark became more convinced of its bullish scenario of $1.5 million for Bitcoin by 2030. “There’s no way to shut Bitcoin down,” she stressed.

XRP Will “Easily Surpass” $100 if Bitcoin Hits $1.5M

Building on this confidence, Rietveld emphasized that XRP is poised to benefit from overall market growth as XRP ranks close to Bitcoin.

According to Rietveld, if Bitcoin reaches $1.5 million per coin, XRP will “easily surpass $100.” He stressed his belief that XRP will hit the $100 price target by 2030, noting it taps into markets that Bitcoin cannot reach due to its technology. “XRP is going to be a multi-trillion-dollar asset,” he noted.

Currently, XRP is valued at $0.5734, and reaching $100 would require extraordinary growth of 17,339% from current levels. In comparison, Bitcoin reaching $1.5 million would require a relatively smaller price growth of 2,444%.

Given this ambitious outlook, Rietveld attempted to back his claims with technical analysis, pointing to an extremely bullish signal on the stochastic RSI for XRP.

Accordingly, he encouraged his audience to consider taking advantage of the current market conditions. He noted that he himself holds a 5x leverage position on XRP.

Top Economist Warns Bitcoin Could Collapse by 74% to $15K

0

The crypto market is again battling bearish volatility, with Bitcoin dipping to as low as $57,694 at the time of reporting. 

Notably, this latest round of correction comes just two days after Bitcoin made an unsuccessful attempt to break through the $61K price range. Since touching $60,650 on Saturday, the premier crypto has since crashed by 4.87%. 

While many in the market are hoping for a short-term rebound, renowned economist and long-time Bitcoin skeptic Peter Schiff has issued a warning to cryptocurrency investors.

In a recent commentary about Bitcoin on X, Schiff argued for a substantial decline in Bitcoin’s price based on what he interprets as a triple-top formation on the charts.

Schiff’s latest caution follows a string of bearish forecasts, but this time, he suggests that Bitcoin could fall much lower than many analysts are expecting.

Schiff further strengthened his argument by stating that Bitcoin’s performance looks even worse when priced in gold. As a staunch advocate of gold, Schiff frequently compares Bitcoin’s performance against the precious metal, consistently arguing that gold remains the superior store of value.

Bitcoin to Revisit $42K in the Short-Term

Schiff’s immediate price target for Bitcoin is the upward trend line, which he believes will provide short-term support at approximately $42K. However, his confidence in this level to hold for Bitcoin is low. 

“At a minimum, Bitcoin is headed to $42K, but I doubt it will hold,” Schiff remarked. According to him, a far deeper correction is likely in store.

Notably, at the current price of $57,694, retesting $42,000 will wipe out 27% of invested capital in Bitcoin. Yet, Schiff’s bearish outlook does not end at $42K. 

Long-Term Support: $15K–$20K Range

He projects that Bitcoin could revisit its long-term support zone in the $15K–$20K range, a price level not seen since the 2022 bear market. If this scenario plays out, it would represent a dramatic 74% decline from current prices. Emphatically, this will wipe out all Bitcoin’s recent gains since this bull market.

Notably, a bearish forecast for Bitcoin is a prevailing sentiment among crypto enthusiasts. However, many community analysts are less pessimistic than Schiff. 

According to a recent update by analyst Ali Martinez, a closer examination of the Bitcoin MVRV Momentum reveals that the cryptocurrency has been in a downward spiral since falling below $66,750 in June. As of now, no clear signs of a reversal have emerged, supporting further bearish trend.

Experts Say this Signal Suggests an Imminent New Bitcoin ATH

0

Despite a 2% fall in the past day, Bitcoin (BTC) has been under the spotlight again as experts signal the potential for a new all-time high. 

Notably, Moustache, a renowned analyst on X, shared a detailed breakdown of Bitcoin’s monthly chart, identifying key buy signals that have historically led to price surges.

According to the analyst, there have only been three instances in the last eight years where a buy signal appeared. Each signal, he noted, preceded a new all-time high.

Moustache pointed to three critical moments in Bitcoin’s price history, beginning with 2015 when a classic ABC correction occurred. Following this correction, a deviation from a declining trendline led to a buy signal, marking the beginning of a long-term bullish trend.

This initial signal, along with others in 2020 and a recently observed one in 2024, suggests that Bitcoin could soon see another surge.

Historical Buy Signals and Trends

The first buy signal in 2015 emerged after Bitcoin retested a critical deviation from its resistance level, establishing support and leading to significant gains in the years that followed.

Similarly, a second buy signal appeared in 2020 after Bitcoin recovered from the market downturn between 2018 and 2019. This buy signal led to one of Bitcoin’s most historic rallies, culminating in the all-time high of $69,000 in 2021.

Current analysis from Moustache highlights a similar retest in 2023 followed by a buy signal, with the expectation of a new all-time high. 

Potential Breakout to $128K

In parallel, another analyst on X, CryptoJack, emphasized Bitcoin’s current position within a classic “cup and handle” structure. This pattern, often considered bullish, began with Bitcoin’s decline from its 2021 highs, followed by a recovery in late 2023, forming the rounded bottom of the cup. 

The handle, representing the current consolidation phase, is expected to precede a breakout. According to CryptoJack’s analysis, Bitcoin is nearing the end of this consolidation phase, with a potential target price of $128,000 once the breakout occurs.

Skepticism Amid Optimism

Amid this optimism, long-time Bitcoin critic Peter Schiff has again voiced his skepticism. As Bitcoin fluctuated around $58,000, Schiff compared its performance to silver, which recently surpassed $31.

He highlighted silver’s rise, stating that Bitcoin’s failure to maintain its value contrasted with the ongoing success of precious metals, particularly gold. Schiff, a consistent Bitcoin critic, emphasized that Bitcoin’s decline could continue, casting doubt on the current bullish outlook presented by analysts.

Ethereum L2 Grows to $10B While 61% of Holders Stay in Profit

0

Recent reports show significant growth within Ethereum’s Layer 2 (L2) ecosystem. 

According to Leon Waidmann, head of research at the Onchain Foundation, over $10 billion is now locked in Ethereum L2 solutions. This figure more than doubles Solana’s $4 billion, emphasizing Ethereum’s expanding dominance.

With Layer 2 adoption accelerating, the impact is expected to be reflected in Ethereum’s price as the L2 ecosystem plays an increasing role in enhancing Ethereum’s utility.

Waidmann also shared that Ethereum’s Layer 2 user base has hit an all-time high. Over 10 million active addresses were recorded, marking a 35.23% increase in the past week.

Notably, 550,989 addresses are active across multiple chains, reflecting the growing interconnectivity between Layer 2 networks. Ethereum’s L2 dominance has also surged by 26.08%. This data shows how Layer 2 solutions are accelerating Ethereum’s utility and driving wider adoption of Web3 technologies.

Increased Ethereum Holder Resilience

Alongside the rapid adoption of Layer 2, the latest data from IntoTheBlock reveals that 61% of Ether holders are currently in profit. This resilience is especially evident when comparing previous market cycles.

For instance, during the last bear market, the percentage of profitable holders dropped to a low of 46% while it dipped to only 3% after the 2017 cycle. However, Ethereum’s current cycle shows a stronger capacity for holders to maintain profitability, even through downturns.

Further comparisons with historical data indicate that during the 2019/2020 period, Ether’s profit-making addresses briefly fell below 10%. While a similar decline could revisit bear market lows, the current environment suggests any downturn would likely be less severe. 

Whale Moves 16,636 ETH After 8 Years

In a separate development, an Ethereum whale who had remained inactive for over eight years recently moved his assets. On September 15, at 7:25 PM UTC, the wallet holder made his first transaction since February 2016, moving 16,636 ETH. 

On-chain data reveals that the whale divided the holdings across three addresses, ultimately moving them to the address “0x34…e0ba.” As of the latest reports, the whale had converted most of his ETH into wrapped Ethereum, holding 16,199 wETH. 

Expert Predicts Timeline for a New Bitcoin All-Time High

0

A new Bitcoin all-time high is not far off, as crypto expert Michael Van De Poppe expects the premier crypto asset to surpass $73,700 in the coming weeks.

In a post on Sept. 16, van de Poppe, the founder of MN Consultancy, stated that he expects Bitcoin to topple its previous all-time high next month. However, he sees a short-term pullback to the $57,000 region before the bullish run.

Bitcoin Price Coinciding with Plan

The seasoned trader noted that although Bitcoin failed to hit its $61,000 price target last week, it was still following the path of his price prediction. Bitcoin rallied to a weekly high of $60,582 on Friday as bulls pushed back amid what has been a bearish September.

Historically known for presiding bearish sentiments, the first few weeks of the month lived up to the billing as Bitcoin slumped over 10.5% to $52,800 earlier in September. Van De Poppe correctly speculated on the price decline, stating that he expects Bitcoin to trade at $54,300 before a sharp rebound.

Now, Van De Poppe has called for a short-term pullback to $57,000 before Bitcoin continues its upward trajectory. However, the expert asserted that Bitcoin must hold the support in that region to keep the impending bullish rally alive.

New High for Bitcoin Amidst Gold Rally

Notably, Van De Poppe based his call for a new all-time high on the rallying gold price. The precious metal has impressed recently amidst a declining appetite for risk assets, hitting a new all-time high of $2,589 on Monday.

Bitcoin 4H Chart Michael Van de Poppe
Bitcoin 4H Chart | Michael Van de Poppe

Considering Bitcoin’s view as digital gold and a long history of price correlation with the asset, the seasoned analyst sees Bitcoin surging at least 21% to a new high in October.

However, this analogy was the exact opposite of Bloomberg’s senior analyst Mike McGlone’s prediction of a further price weakness in Bitcoin against gold. The seasoned market expert stated that the Bitcoin/Gold ratio is on a downtrend after peaking in March.

McGlone further implied that he sees Bitcoin retracing as low as 15x the price of gold, with a possible trend towards $31,500. This price speculation aligns with an earlier caution call from analyst Ali Martinez, who stated that Bitcoin’s failure to trade above the 200-day moving average at $64,000 could spell a deadly correction to the $31,000 region.

Meanwhile, Bitcoin corrected further on Monday, with a 3.3% decline in the past 24 hours. At press time, the asset was trading at $58,219, with a market cap of $1.15 trillion.

Market May Move Up as Tether Mints $1B USDT on Ethereum

0

As Tether mints $1 billion in USDT today, the broader crypto market could witness a sharp reversal rally, ending its latest drawdowns.  

Leading crypto tracking service Whale Alert took to X to index Tether’s recent minting of $1 billion on the Ethereum network. The transaction, which occurred today at 05:40 AM (UTC), saw Tether replenish its USDT Treasury with $1 billion on the world’s largest smart contracts platform. 

Tether CEO Reacts 

Shortly after the minting, Tether’s CEO Paolo Ardoino emphasized that the 1 billion USDT has been authorized to be added to the treasury. Despite this, Ardoino clarified that the funds had not been released into circulation. He noted that Tether would release the funds as inventory for next-period issuance or chain swaps. 

Ethereum Ranks as Second-Largest Network for USDT 

According to Tether’s transparency page, Ethereum ranks as the second-biggest network for USDT. As of September 16, Tether has authorized a total of $54.981 billion worth of USDT on the Ethereum blockchain. 

Of this amount, $53.977 billion USDT is in circulation, while $1.003 billion USDT has been “authorized but not issued.” 

Over $3.6B in USDT Enters Crypto Market in 30 Days 

Meanwhile, the $1 billion USDT adds to the large influx of stablecoins that have entered or are preparing to enter the crypto market. Popular crypto trading app Rhino Bitcoin reported that $3.65 billion worth of USDT has been sent into the crypto market over the past 30 days. 

The Rhino team disclosed that the last time it observed this massive inflow was in Spring when Bitcoin registered a new all-time high. This suggests that the recent inflow of USDT into the market is unusual and could be triggered by anticipation of significant price upticks. 

Typically, investors leverage stablecoins such as USDT to buy other cryptocurrencies like Bitcoin (BTC), Ethereum (ETH), and XRP (XRP). Conversely, market participants swap their favorite tokens for USDT or other stablecoins during heightened drawdowns. 

Given Rhino’s comment, the surge in USDT inflow implies that investors could be preparing to acquire more cryptocurrencies, potentially driving their prices. 

In the meantime, the crypto market has been on a decline for most of today. The global crypto market cap has registered a decrease of 3.32% over the past 24 hours to $2.03 trillion. Specifically, Bitcoin, which surged above the $60,000 resistance level on September 13, is trading at $58,101. 

Bitcoin Reaches Decisive Point Against Gold as Brandt Identifies Descending Channel

0

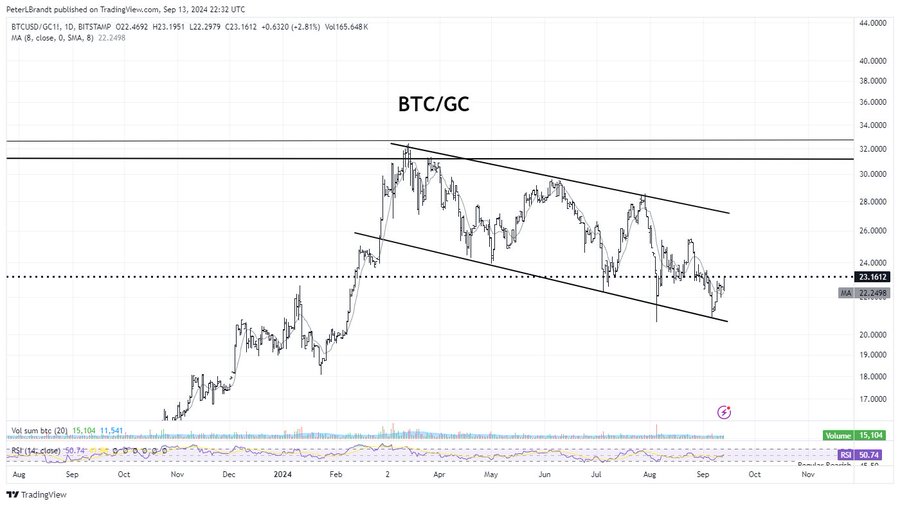
The Bitcoin-to-Gold ratio has reached a decisive juncture, as veteran market analyst Peter Brandt points out the possibility of a tradable local low. 

In a recent post on X, Brandt shared a chart of the BTC/GC (Bitcoin/Gold) ratio, identifying a descending channel that could signal a reversal. This has triggered speculation across the market, as the ratio has been trending lower over the past several months.

Bitcoin Reaches Critical Juncture 

Bitcoin initially outperformed gold at the start of 2024. Amid this trend, the BTC/GC ratio spiked from 20.5 at the start of the year to a peak of 34.08 on March 13. This marked a remarkable 66% increase in the price of Bitcoin against gold in the first quarter of the year.

Notably, this push was due in large part to a dramatic surge in Bitcoin’s price, which reached a new all-time high above $73K in March. For context, gold also saw an increase in Q1 2024, having risen from $2,069 at the start of the year to $2,194 in early March. However, this gradual uptick did not match Bitcoin’s rapid surge.

Interestingly, following the peak on March 13, the price of Bitcoin is now in a retracement. This correction has led to gold gaining against Bitcoin, with the BTC/GC pair forming a descending channel. The pair has been trading within this channel since mid-March, making lower highs and lower lows as it heads towards a potential breakout point.

Bitcoin critic Peter Schiff recently spotlighted this emerging trend. The lower boundary of the channel has acted as strong support, with Bitcoin bouncing from around the 23.00 level recently. 

Meanwhile, the upper boundary of the channel lies around the 28.00 area, where the ratio has faced repeated resistance. Brandt’s latest comment suggests that he sees the recent bounce as a potential signal that Bitcoin could break higher against gold.

Support and Resistance Zones

The ratio is currently hovering around the 23.16 level, which has served as a pivotal support in recent months. This area has been tested multiple times, with Bitcoin repeatedly bouncing from this zone, indicating strong demand near this level.

Bitcoin to Gold Ratio Peter Brandt
Bitcoin to Gold Ratio | Peter Brandt

Currently at 50.74, The Relative Strength Index (RSI) indicates neutrality. The RSI recently bounced from oversold levels, giving hope to bulls that the downward momentum may be slowing. Also, it is still far from overbought, leaving room for further upside if the breakout occurs.

Notably, there are several key resistance levels to watch. The most immediate is near the top of the channel, around 28.00. A breakout above this would be a bullish signal, potentially opening the door to a test of the 30.00–32.00 region, which marks a major overhead resistance.

Meanwhile, if Bitcoin fails to break above the channel and is rejected near 28.00, it could continue its downward trend within the channel. In this case, the next target would be the lower boundary of the pattern, near 21.00 or even 20.00. A breakdown below 23.16 would further confirm the bearish case.

“If You Can’t Beat Them, Join Them” Moment Coming for XRP: Business Leader

0

Jake Claver, a business leader and financial strategist, recently made a bold prediction about the future of XRP and the broader crypto market. 

He asserted that the moment for embracing the prevailing trends in cryptocurrency, especially with XRP, is approaching rapidly. According to Claver, a significant turning point, where the phrase “If you can’t beat them, join them” becomes a reality, is imminent in the cryptocurrency space, especially for XRP.

Claver expressed this sentiment in a recent post on X, which has garnered significant attention from the crypto community.

Growing Trend in Crypto Adoption

While Claver did not provide specific details, his statement suggests a major shift in how traditional financial institutions adopt cryptocurrencies rather than compete with them.

Notably, a report by Ripple revealed that a staggering 97% of payment leaders believe that blockchain and crypto assets will be crucial in facilitating faster payments within the next three years.

The traditional financial sector is already increasingly embracing cryptocurrency. This is evident in the recent trend of investment products launching around cryptos like Bitcoin and Ethereum, which has helped Wall Street gain exposure to crypto.

In particular, U.S. Bitcoin spot ETFs, which are just nine months old, have attracted approximately $21 billion in capital.

Aside from investment products, the traditional space increasingly views crypto as a viable means of exchange. For example, MasterCard recently launched a debit crypto card to enable global Bitcoin spending. 

Additionally, international organizations like the British Red Cross now accept crypto assets such as BTC and XRP.

Claver’s suggestion that XRP could be at the forefront of this trend is likely due to XRP’s unique utility in a market expected to be worth around $300 trillion.

XRP Unique Position

XRP is renowned for its fast and cost-effective cross-border payment system. It has long been a contender for disrupting the traditional financial industry.

Designed to facilitate instant payments across borders, XRP is well-positioned to bridge the gap between crypto and global financial systems. 

Claver’s comment suggests that, rather than resisting this growing technology, major institutions could be gearing up to integrate XRP into their operations. This would mark a significant milestone, moving from skepticism and opposition to full-scale adoption.

Interestingly, this trend is already underway. During Ripple’s litigation, a court document revealed that the company had entered 1,700 contracts with financial services to facilitate XRP-based transactions.

As ETH/BTC Dumps to Historic Low, Altcoins Likely to Tank Next: Full Details

0

Data shows that the ETH/BTC rate recently fell below 0.04, marking its lowest level since April 2021. 

This decline occurred despite the approval of ETFs investing in Ethereum, which had been expected to boost ETH’s market position.

Notably, the downward trend in Ethereum’s performance relative to Bitcoin began in September 2022, shortly after Ethereum’s transition to proof-of-stake (PoS). Since then, the ETH/BTC pair has plummeted by 53%.

Observers point to a combination of technical and fundamental factors contributing to Ethereum’s ongoing decline against Bitcoin.

Altcoins Likely to Dump Next

Industry pundit Benjamin Cowen has been one of the prominent voices commenting on the ETH/BTC movement. He observed that large altcoin holders have been critical of Ethereum’s performance.

However, Cowen noted a historical pattern where altcoins often follow Ethereum’s lead when the ETH/BTC pair declines. This pattern suggests that a broader altcoin correction may follow Ethereum’s recent struggles.

According to Cowen’s projections, ETH/BTC could be nearing its bottom soon. He suggested that the pair might find support between 0.03 and 0.04 before trending upward in 2025.

While the timing remains uncertain, Cowen believes that a bottom could form as early as this week, with a worst-case scenario pushing the recovery to December. His analysis is based on prior market capitulations, and he remains confident that a reversal is imminent.

Challenges Beyond Technical Breakouts

While Cowen focuses on technical signals, other analysts have pointed to broader market factors affecting Ethereum.

Alex Thorn, Head of Research at Galaxy Digital, emphasized that the situation is more complex than simple price movements. Thorn indicated that Ethereum’s recovery would require a significant shift in the broader narrative surrounding the asset. He argued that technical breakouts alone would not be enough to reverse the downward trend.

David Duong, Global Head of Research at Coinbase, offered additional insights into Ethereum’s price underperformance. He linked the current market structure, particularly in September, to weak seasonality and rising competition from other altcoins.

Moreover, Duong mentioned that crypto enthusiasts are crowding into altcoins other than Ethereum to find better yields.

For a short-term reversal, he suggested that Ethereum would need to integrate more real-world assets (RWAs) and applications with broad public appeal into its ecosystem.

SUI Aims for $2 as Buyers Eye Major Fibonacci Breakout

With a bullish breakout run for SUI extending above $1, will buyers manage a recovery run to $2?

With a market cap of $2.95 billion, the SUI token ranks 27th among the top cryptocurrencies. Just shy of $3 billion, the SUI token trades at $1.10, with a 24-hour price jump of 1.40%. 

Amid the growing demand for SUI, will the altcoin hit the $2 psychological mark as the broader market prepares for a bounce back?

SUI’s Dominion Over $1

Last week, the SUI token surged by 14.82% from $0.9398 to $1.0785, following the 23.4% jump a week prior. The bullish recovery teases a rounding-bottom reversal with a neckline at the 38.20% Fibonacci level at $1.1250. 

The ongoing recovery is on its way to making the third consecutive bullish candle with a constant rise in buying pressure. Currently, the SUI token is trading at $1.0988, with a gain of 1.97% from the opening price of $1.0755, and the triple white soldier pattern accounting for a surge of 7%. 

SUI Price Chart
SUI Price Chart

The SUI token reveals the recovery rally gaining momentum after the falling channel breakout in the daily chart. Following the breakout run, the bullish engulfing candle formed on September 12 with an 11.84% surge boosted the uptrend. 

SUI Performance and Technical Indicators

The SUI token is trading at a 49% discount from its all-time high price of $2.1816. However, its YTD growth stands at 41.71%, revealing a highly volatile price action in 2024.

As the SUI token surpasses the 200-day EMA, the bullish influence is on the rise. The uptick in the 50-day EMA teases a potential golden crossover with the intent to cross the 200-day EMA. Further, the bullish momentum leads to a fresh rally in the MACD signal lines with a rising intensity in the positive histograms. 

Will SUI Price Hit $2?

A bullish breakout of the 38.20% Fibonacci level will label 61.80% and 78.60% levels as potential targets. The respective Fibonacci levels are at $1.4896 and $1.7492.

Optimistically, a bullish recovery in alliance with the broader market recovery will hit the $2 mark. On the other hand, crucial support is at the $1 psychological mark, and the 23.60% Fibonacci level is at $0.8994 in a bearish scenario.