Home Blog Page 1257

XRP on Verge of Huge Surge As Bollinger Bands Keep Squeezing Month after Month: Expert

0

XRP could be on the verge of a significant price move as technical indicators signal a growing potential for a breakout.

According to a recent analysis shared by crypto market expert Matt Hughes, the Bollinger Bands for XRP on the monthly chart have tightened to levels unseen since 2017, a period that preceded the token’s explosive rally.

The Bollinger Bands, a volatility indicator used to assess market conditions, have been gradually squeezing month after month. Typically, when the distance between the upper and lower bands narrows, it suggests a phase of low volatility, which is often followed by a sharp price movement.

Hughes emphasized that the current squeeze is “way tighter than 2017,” expressing optimism that the tightening will result in an astronomic price surge.

What Happened the Last Time XRP Bollinger Bands Tightened

The chart accompanying Hughes’ update clearly depicted the last instance of tightened bands for XRP in 2017. An explosive breakout occurred around the time XRP traded at $0.005, which was in Q1 of 2017. 

XRP then experienced a series of bullish monthly candles, first eliminating a zero by April 2017. The momentum continued into the following month, removing another zero by May, with the price rising to over $0.33.

While the aggressive price surge weakened slightly in the subsequent months, it resumed in the last quarter of 2017 when XRP first cracked $1. It then reached an all-time high of $3.84 by January 2018.

Remarkably, from the time the Bollinger Bands tightened in early 2017 to its all-time high a year later, XRP surged by over 75,000%, making it one of the best-performing cryptocurrencies of that period.
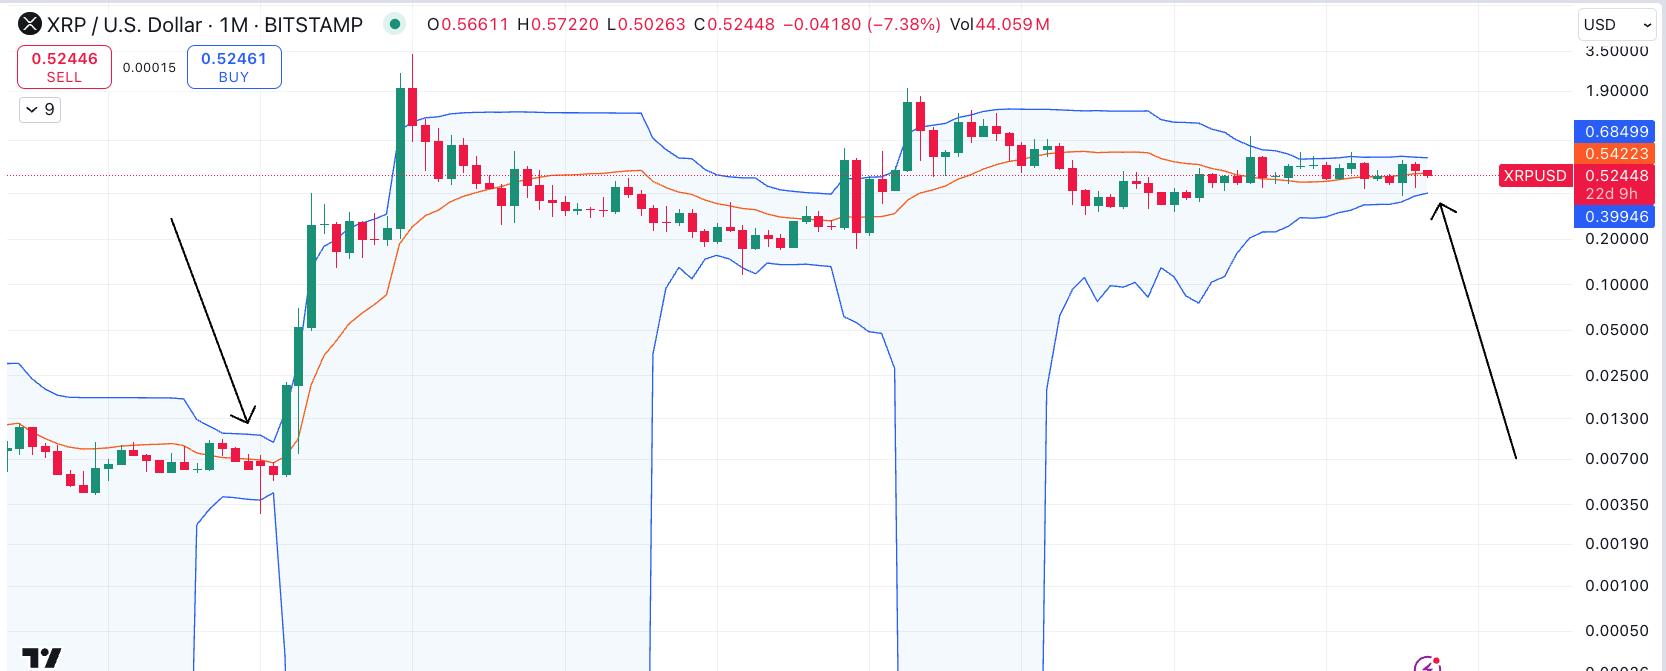
XRP historical chart showing tightening Bollinger Bands

Now, with the Bollinger Bands displaying a similar but even more compressed pattern, many analysts are speculating that a comparable breakout could be on the horizon. Hughes concluded his analysis with a hint at an impending price surge, noting that the tightening “will only end one way,” followed by a rocket emoji, implying bullish expectations.

Meanwhile, he offered no insight into how high XRP could go in the anticipated breakout. However, some analysts have suggested an upside potential of up to $150 for XRP. Currently, XRP is trading at $0.5312.

Ethereum Foundation, WazirX Exploiter Offload 5,500 ETH in Major Liquidation Move

0

Major Ethereum holders continued to dump assets on Monday, with the Ethereum Foundation and WazirX hacker in the mix.

Ethereum sales from co-founder Vitalik Buterin have slowed down following widespread community criticism. However, the Ethereum Foundation—an organization created to support the Ethereum network—has remained poised on offloading its Ether stash.

Data from Spotonchain showed that the non-profit organization had resumed Ether sales this week after trading 450ETH for $1.09 DAI on Monday. The Ethereum Foundation paused sales on Sunday, having been on a selling streak for over six days. On-chain analysis showed that the foundation had converted 550 ETH to DAI in the past four days at an average price of $2,324.

The Monday sales were done across three transactions at 7.23 UTC. The Ethereum Foundation sent 450 ETH to its multi-signature wallet, receiving 500,000 DAI and 536,407 DAI from address 0xbc…fbc3.

Ethereum Foundation’s Persistent Sales

The foundation has been a significant source of Ethereum liquidation, as data showed it has already dumped over 2,000 ETH ($4.65 million) this month. Per Arkham, the Ethereum Foundation started the month with an Ether balance of 274,000 ETH but has 271,802 left at the time of writing.

In August alone, the non-profit organization sold 35,000 ETH, worth over $81 million at the current market price. The firm obviously ramped up sales in August, as data showed it sold just 1,000 ETH in July. The reason behind these sales has remained unknown.

Notably, these incessant Ethereum liquidations have not gone down well with the community, as they have continued to make their feelings known. The sales have also contributed to Ether’s price weakness, with the asset underperforming the most among the ten cryptocurrencies.

Ethereum has dived 8% in the past seven days and 12% in the past month. This is worse than Bitcoin’s 7.97% and 9% weekly and monthly drawdowns.

WazirX Hacker Launders New Funds

Meanwhile, the hackers behind the exploit on India’s largest cryptocurrency exchange, WazirX, have laundered new funds. Data from PeckShield showed that they sent 5,001 ETH ($11.5 million) to a new address. This came after an earlier report of the hacker moving 2,600 ETH on September 3.

Following the transfer, the hacker started moving the ETH from the new address to the crypto mixer platform Tornado Cash. At the time of writing, the address had already laundered 2,000 ETH ($3.4 million) through the platform and had 3,501 ETH ($8.12 million) left.

Ethereum remained largely stable during these sell-offs, trading at $2,321 at press time. The asset’s trading volume stood at $12.8 billion, up 35% in the past 24 hours.

As Dogecoin Approaches $0.10, Wedge Pattern Breakout Targets $0.14419

As Dogecoin lifts off from the support trendline, the breakout rally chances for the biggest meme coin are increasing. Will the uptrend in DOGE surpass $0.10?

With the Bitcoin price stuck near $55K, the altcoin segment maintains a correction trend. Despite the minor-term recovery, top altcoins are under a bearish pattern. Amid this, Dogecoin prepares a bull cycle within a falling wedge for a breakout rally. Will it work out as the broader market sentiment struggles to recover?

DOGE Within The Fences of a Wedge 

In the daily chart, Dogecoin is forming a falling wedge pattern. Since hitting a yearly peak at $0.22899 on March 28, 2024, it has dropped to a 52-week low of $0.08049, marking a 64.85% decline.

Despite this drop, Dogecoin avoids a closure below the support trendline, resulting in a prolonged trapped movement. Recently, the coin has experienced a three-day recovery, rising by 6.72% to its current price of $0.09865.

This recent uptick puts Dogecoin on the cusp of reversing a 5.96% decline observed on Friday, which resulted in a bearish engulfing candle.

Dogecoin Price Chart

Analyst Points Out Dogecoin’s Potential Breakout 

In a similar price analysis, Ali Martinez hints at a potential breakout for Dogecoin, emphasizing a bullish outlook. He suggests keeping an eye on the falling wedge pattern on the DOGE daily chart. According to Martinez, a sustained close above $0.10 could trigger a bullish rally, potentially pushing the price to $0.15.

Dogecoin is currently approaching the $0.10 psychological level. If DOGE surpasses this mark, it could significantly enhance breakout prospects and positively impact market sentiment.

Dogecoin Crucial Price Levels

With the recovery rally gaining momentum, the MACD indicator signals a potential bullish crossover as the MACD line approaches the signal line. According to pivot levels, immediate resistance is positioned at $0.10161, aligning with the middle pivot point.

Should Dogecoin break out of the falling wedge pattern, it could test the R1 and R2 pivot levels at $0.12273 and $0.14419, respectively. Conversely, a bearish reversal would intensify pressure on the long-standing support trendline, increasing the risk of a breakdown.

In the event of a decline, crucial support levels for Dogecoin are at $0.08015 (S1) and $0.05903 (S2).

XRP Ledger Market Cap Reaches Record Low, Could it be a Good Thing?

0

The market capitalization of the XRP Ledger (XRPL) ecosystem has recently fallen to $80 million, marking its lowest point since January 2022. 

Artur Kirjakulov, the CEO of XPMarket, called attention to this record in a recent post on X. He noted that this decline highlights a significant moment for XRPL, raising concerns and opening up new possibilities for the platform.

Kirjakulov noted that while some might view this drop as alarming, it is important to look at the underlying factors contributing to the shift.

It is worth noting that the $84.32 million in the market cap of the XRPL ecosystem accounts for projects on the XRP network, including NFTs, AMMs, and others.

Shift in Capital Allocation and New Project Opportunities

According to Kirjakulov, the reduced market cap could suggest a reallocation of capital towards newer projects, either within or outside the XRP ecosystem. This adjustment may indicate that developers and investors are exploring decentralized finance (DeFi) or tokenization opportunities in search of innovation and growth.

As capital shifts, emerging applications may take the lead, providing the ecosystem with fresh areas for development. Importantly, this change aligns with XRPL’s ongoing focus on payments and tokenization, especially with the coming launch of RLUSD, which could lead to the creation of payment-related decentralized applications (dApps).

Further, as Kirjakulov notes, this decline in the market cap also reflects broader trends in the crypto market, where tokens across various blockchains have experienced similar downturns.

Notably, the drop in market capitalization is not unique to XRPL, as other platforms such as Ethereum, Solana, and Tron have also faced challenges in recent months.

Impact on Developer Activity

On the other hand, Kirjakulov also indicates that the decrease in XRPL’s market cap could be seen as a natural evolution, as weaker or abandoned projects phase out, making room for more promising ones.

Yet, this shift may also lead to a reduction in developer activity. Some developers may leave for other platforms that offer more support or financial incentives. As a result, the ecosystem could experience slower growth, reduced innovation, and declining community engagement.

Despite these potential setbacks, XRPL’s tokenization capabilities offer a pathway for the network to remain competitive. The network’s emphasis on core strengths, such as payments and real-world asset tokenization, could drive future growth, even amid ongoing challenges.

Community Reaction and Concerns Raised

Amid Kirjakulov’s analysis, WrathofKahneman (WOK), a notable member of the XRP community, raised questions regarding the interpretation of the data.

While acknowledging the thoroughness of Kirjakulov’s analysis, WOK pointed out that the general market cap trend may still be upward, even considering token inflation and a broader market downturn. He suggested that comparing another token within the same timeframe could provide a clearer picture of the ecosystem’s performance.

In response to WOK’s concerns, Kirjakulov explained that estimating token inflation on the XRPL is particularly challenging due to the lack of a formal token escrow system. As a result, estimates based on various formula-driven projections are necessary to understand inflation trends within the ecosystem. 

Cardano Targets $0.40 Amid Rising Network Activity and Double Bottom Reversal

Despite a falling wedge at play, Cardano eyes a double bottom reversal in a multi-time frame. Will this lead to a breakout run?

As Bitcoin reclaims the $55K mark, the altcoins are gradually gaining momentum this week. A mildly positive weekend limited the bearish intensity of last week, and Cardano is preparing for a bounce back.

Will a reversal in Cardano result in a breakout run to reclaim the $0.40 mark?

Cardano’s Strong Base At $0.312

In the daily chart, the Cardano price action reveals a falling wedge pattern. Currently, the Cardano price takes solid support at the $0.312 baseline. With multiple lower-price rejection candles, Cardano has successfully avoided a closing price below $0.312. 

Cardano Price Chart
Cardano Price Chart

Over the weekend, Cardano’s price saw a notable increase, climbing 3.49% and 3.99% over two days. It is currently trading at $0.341, reflecting an intraday gain of 1.37%. However, the intraday candle shows a higher price rejection, as it has dropped from a 24-hour high of $0.349.

This higher price rejection has pushed Cardano back below the 20-day EMA, which now acts as dynamic resistance. Despite this, the bullish divergence observed in the daily RSI between the double bottom at $0.312 suggests a potential for a bullish reversal.

Essentially, Cardano’s ongoing recovery is testing the overhead resistance trend line. If successful, the price could rise to $0.375, representing a potential upside of 10%.

Cardano Network Activity Hits 6-Month High

Cardano has witnessed a massive surge in the daily active addresses, the highest since March 2024. Historically, such spikes in address activity led to a surge in the token price.

According to recent data from Santiment, ADA recorded 39,451 daily active addresses on September 6, reflecting renewed interest in the network.

With Bitcoin and the broader crypto market poised for a potential rebound, this uptick in activity may signal a robust recovery for Cardano in the coming weeks.

4-Hour Timeframe Supports Broader Picture

In the 4-hour chart, the Cardano Price action reveals a bullish recovery and supports the chances of a bullish recovery. With a double bottom reversal from the $0.313 baseline, the Cardano Price teases a rounding bottom reversal. 

Cardano Price Chart
Cardano Price Chart

Retracing the Fibonacci level over the correction phase last week, the recovery run has surpassed the 23.60% level and is challenging the 38.20% level at $0.346.

On the 4-hour chart, the price has surpassed both the 20 EMA and the 50 EMA, though it is currently facing resistance from the 200-day EMA.

The uptick in the 20-day EMA suggests a strong likelihood of a bullish crossover. Additionally, the DMI indicator shows a positive trend with an increasing VI line and an uptick in the ADX line, signaling that the bullish momentum is building on the 4-hour chart.

If the uptrend continues, Cardano’s price could reach the 61.80% Fibonacci level at $0.366 or even the 100% Fibonacci level at $0.399.

On a more optimistic note, the 1-day chart indicates that the upside potential could extend to $0.422, aligning with the 200-day EMA and the 23.60% Fibonacci level.

Analyst Forecasts Major Cardano Surge, Breaks Down Factors Behind Prediction

0

Analyst Dan Gambardello stated that Cardano is primed, and all indicators show a notable surge soon.

An analyst has pointed to these favorable indicators, suggesting that Cardano could be up for an expansive parabolic upsurge. Seasoned crypto expert Dan Gambardello has stated that Cardano has primed and is poised for an explosive price movement.

In a Monday tweet, the expert analyzed the ADA/BTC chart, showing that Cardano is historically at a point of price rally. He stated that ADA was down against Bitcoin by 92% before the last bull cycle. The current chart shows a 90% correction, signaling that Cardano may have bottomed.

A bullish engulfing on the ADA/BTC one-month timeframe further confirmed this analysis. The ADA price recovered against Bitcoin in the 1M chart after eight successive red candles and has gained on six consecutive days.

ADA Shows Bullish Signs

Gambardello also referred to the moving average convergence/divergence (MACD) indicator on Cardano’s weekly chart as a bullish confirmation. The MACD, which flipped bearish in Aprii, now tends towards the baseline, showing a trend reversal.

The expert stated that if the market shows bullish momentum, ADA could see a massive run as all indicators are ticking in the asset’s favor. He, however, noted that Cardano is testing the 20-day moving average at $0.35 in the daily, and the 50-day MA is close enough at $0.57. Hence, a break above these averages would see ADA move to a much higher price.

Although Gambardello didn’t state a price target for this forming scenario, his earlier analysis showed that the professional analyst expects nothing below a 1,000% rally. Per The Crypto Basic, he pointed to bullish divergence in the ADA/BTC chart, noting that ADA would target $3.553.

Macroeconomic Boast for Cardano

A further heightened bullish scenario for Cardano is the buzz around the network’s recent move to the Voltaire era. The September 1 Chang hard fork saw the network embrace decentralized, community-driven governance.

Gambardello cited a video from ADA enthusiast Dawson Allen, who revealed how advanced the Cardano network has become. Critics have previously reprimanded the blockchain for not being decentralized, secure, or scalable.

In the X video, Allen explained that the Cardano network has now almost ticked all these boxes, placing itself as one that solves all the blockchain trilemma. According to him, the addition of Hydra, transaction bundling via unspent transaction output (UTXO), and the recent decentralization quest have positioned Cardano as one of the biggest networks in the crypto space.

Top Investor Says Very Bullish on Shiba Inu Despite Dips

0

Despite Shiba Inu’s inability to register significant price gains over the past week, famous investor Jake Gagain remains confident about SHIB’s future performance. 

In a tweet yesterday, Gagain expressed confidence in Shiba Inu, emphasizing that he is very bullish on the 13th-biggest crypto by market cap. This comment suggests that Gagain is not troubled by Shiba Inu’s current performance but anticipates a significant price uptick for SHIB in the future. 

Potential Reasons Behind Gagain’s Bullish Comment 

The potential reasons behind Gagain’s statement could stem from the number of updates introduced within the Shiba Inu ecosystem since its inception. 

Shiba Inu has grown from a token to a complete ecosystem, with many projects, including a play-to-earn game (Shiba Eternity), DAO, metaverse (Shib: The Metaverse), non-fungible tokens, layer-2 blockchain (Shibarium), and decentralized exchange (ShibaSwap). 

Moreover, the team behind the Shiba Inu ecosystem has introduced an automated burn portal, dubbed ShibTorch, to drastically reduce SHIB’s hefty circulating supply using a portion of Shibarium’s fees. Due to these projects, several community members like Gagain have remained bullish on Shiba Inu, anticipating a major rally for the asset. 

SHIB Crashes Amid Negative Macroeconomic Report

Gagain’s statement follows a sharp decline in Shiba Inu’s price over the past week. Data from CoinMarketCap shows that Shiba Inu plunged to $0.00001244 on September 6, crashing 7.09% from its daily high of $0.00001339. 

This crash was majorly triggered by weak ISM Manufacturing data, which saw the PMI index fall to 47.2 points from the market’s expectations of 47.5. The development had a negative impact on the broader financial markets, including stocks and cryptos. 

For cryptos, Bitcoin, the world’s largest cryptocurrency by market cap, crashed from around $58,000 to $53,000. Given Bitcoin’s influence on the broader crypto market, the prices of altcoins like Shiba Inu also recorded major declines. Nonetheless, Gagain has remained bullish on Shiba Inu, anticipating a major price uptick for the token. 

Shiba Inu to Hit $100B Market Cap 

As reported earlier, Gagain projected that Shiba Inu will hit a market cap of $100 billion before the 2024/2025 cycle ends. According to Gagain, Shiba Inu will hit the $100 billion threshold before the world’s biggest memecoin, Dogecoin. 

At the moment, Shiba Inu is trading at $0.00001311, with a market cap of $7.74 billion. This suggests that Shiba Inu’s market cap must surge by 1,191% to hit the $100 billion target. 

Such a remarkable rally would substantially impact SHIB’s price. A potential increase of 1,191% would propel Shiba Inu to a new all-time high of $0.00016925. 

Shiba Inu to $0.0001 Target 

Meanwhile, the $0.0001 target has gained popularity within the Shiba Inu community in recent times. Besides Gagain, several experts believe that Shiba Inu would surge to the $0.0001 price territory this cycle. 

Earlier this year, prominent analyst Bunchhieng speculated that Shiba Inu could replicate its 2021 performance and potentially hit the $0.0001 level in this cycle. 

Other experts, such as Oscar Ramos, Gem Sheriff, and Eunice Wong, think the $0.0001 target is also feasible for Shiba Inu. However, they did not set a timeline for when Shiba Inu could achieve it. 

Ethereum Supply Grows by 15,637 ETH in 7 Days as Staking Continues to Rise

0

Data from Ultra Sound Money has revealed that Ethereum’s supply increased by 15,637.76 ETH over the past week. 

This shift follows a noticeable trend in the Ethereum ecosystem, where supply dynamics have fluctuated based on the balance between issuance and burn mechanisms. Despite the implementation of Ethereum Improvement Proposal (EIP) 1559 in June 2021, which aimed to curb inflation through token burns, the past seven days have seen more ETH minted than burned. As of now, the total supply stands at 120,333,951 ETH, showing a modest annualized increase of +0.678%.

Screenshot 2024 09 09T114133739
ETH Supply / Ultra Sound Money

Supply Changes Driven by Issuance and Burns

Ethereum’s issuance and burn rates are crucial factors driving its supply. Over the 7-day period, a total of 18,263.28 ETH was issued, while only 2,625.52 ETH were burned. Burns served as a mechanism to permanently reduce the total supply by removing ETH from circulation with every transaction. However, during this specific timeframe, burns lagged behind issuance, leading to a net increase in Ethereum’s overall supply.

The balance between issuance and burning plays a central role in determining whether Ethereum’s supply will expand or contract. Notably, when more ETH is issued than burned, as seen in this period, the result is an inflationary effect, adding more coins to circulation. This uptick in supply reflects an ongoing trend where Ethereum’s supply is influenced by network activity and market demand.

Staking Strengthens Amid Supply Growth

While Ethereum’s supply has increased, staking activity on the network continues to grow steadily. Over the past seven days, the total amount of staked ETH saw a +0.24% rise. This increase in staked ETH represents growing confidence in Ethereum’s long-term potential as more holders lock their assets in staking contracts. Over the past 30 days, staked ETH has climbed by +1.13%, with an even more significant rise of +4.48% over the last 90 days.

ETH Staking
ETH Staking / IntoTheBlock

This consistent growth in staking indicates that many Ethereum holders are committed to the network’s future, reducing the circulating supply of ETH in the process. Although this week’s net issuance was positive, the growing volume of staked ETH contributes to lowering the supply available for everyday transactions.

Ethereum’s Supply Trends in 2024

The recent data points to broader trends in Ethereum’s supply throughout 2024. CoinGecko previously noted that from the start of the year until August, Ethereum emitted 540,958 ETH, while only 465,657 ETH were burned. This marked a net supply increase of 75,301 ETH since the beginning of 2024, highlighting Ethereum’s shift from a deflationary period in late 2022 to an inflationary phase during this year.

Ethereum’s deflationary characteristics were more evident between the fourth quarter of 2022 and the first quarter of 2024, where higher burn rates reduced the overall supply. However, reduced network activity in the second quarter of 2024 shifted the balance, resulting in an increase in total circulating supply.

Selling Bitcoin at $54K Will Haunt You When It Hits $1 Million, Top Analyst Warns

0

Scott Melker, widely known as “The Wolf of All Streets,” has shared a bold prediction regarding Bitcoin amid ongoing price fluctuations. 

According to Melker, Bitcoin could potentially reach $1 million by 2030. In a reflective take, he expressed how many investors might look back and regret their short-term decisions.

Specifically, Melker highlights the common tendency to panic over smaller price drops, like Bitcoin’s movement from $57,000 to $52,000 this month. However, in his view, those who sell too early will look back in regret when they see Bitcoin at $1 million per coin while they had sold at $52K.

Melker’s commentary calls investors to focus on the broader picture rather than reacting to short-term fluctuations. His advice encourages investors to maintain a long-term mindset, emphasizing patience and trust in Bitcoin’s sustained rise over the next decade.

Notably, Bitcoin would need to rise by approximately 1,723.92% to reach the price of $1 million from its current price of $54,827.

Mixed Reactions from the Crypto Community

In response to Melker’s projection, several commenters shared their thoughts on Bitcoin’s future. One individual expressed concerns about inflation, suggesting that by 2030, utility bills could soar by 500%, potentially diminishing Bitcoin’s $1 million value.

Another commenter shared this concern, positing that while Bitcoin might reach $1 million, hyperinflation could erode that value to just $50,000.

Further skepticism came from another commenter who speculated that Bitcoin’s price could be influenced by ETFs from BlackRock and government regulations, predicting it might hover around $70,000 by 2030 due to such speculative controls.

Meanwhile, analyst Nebraskangooner made a humorous comment, suggesting XRP would be the better investment by 2030.

Other Analyses Suggesting $1M Bitcoin

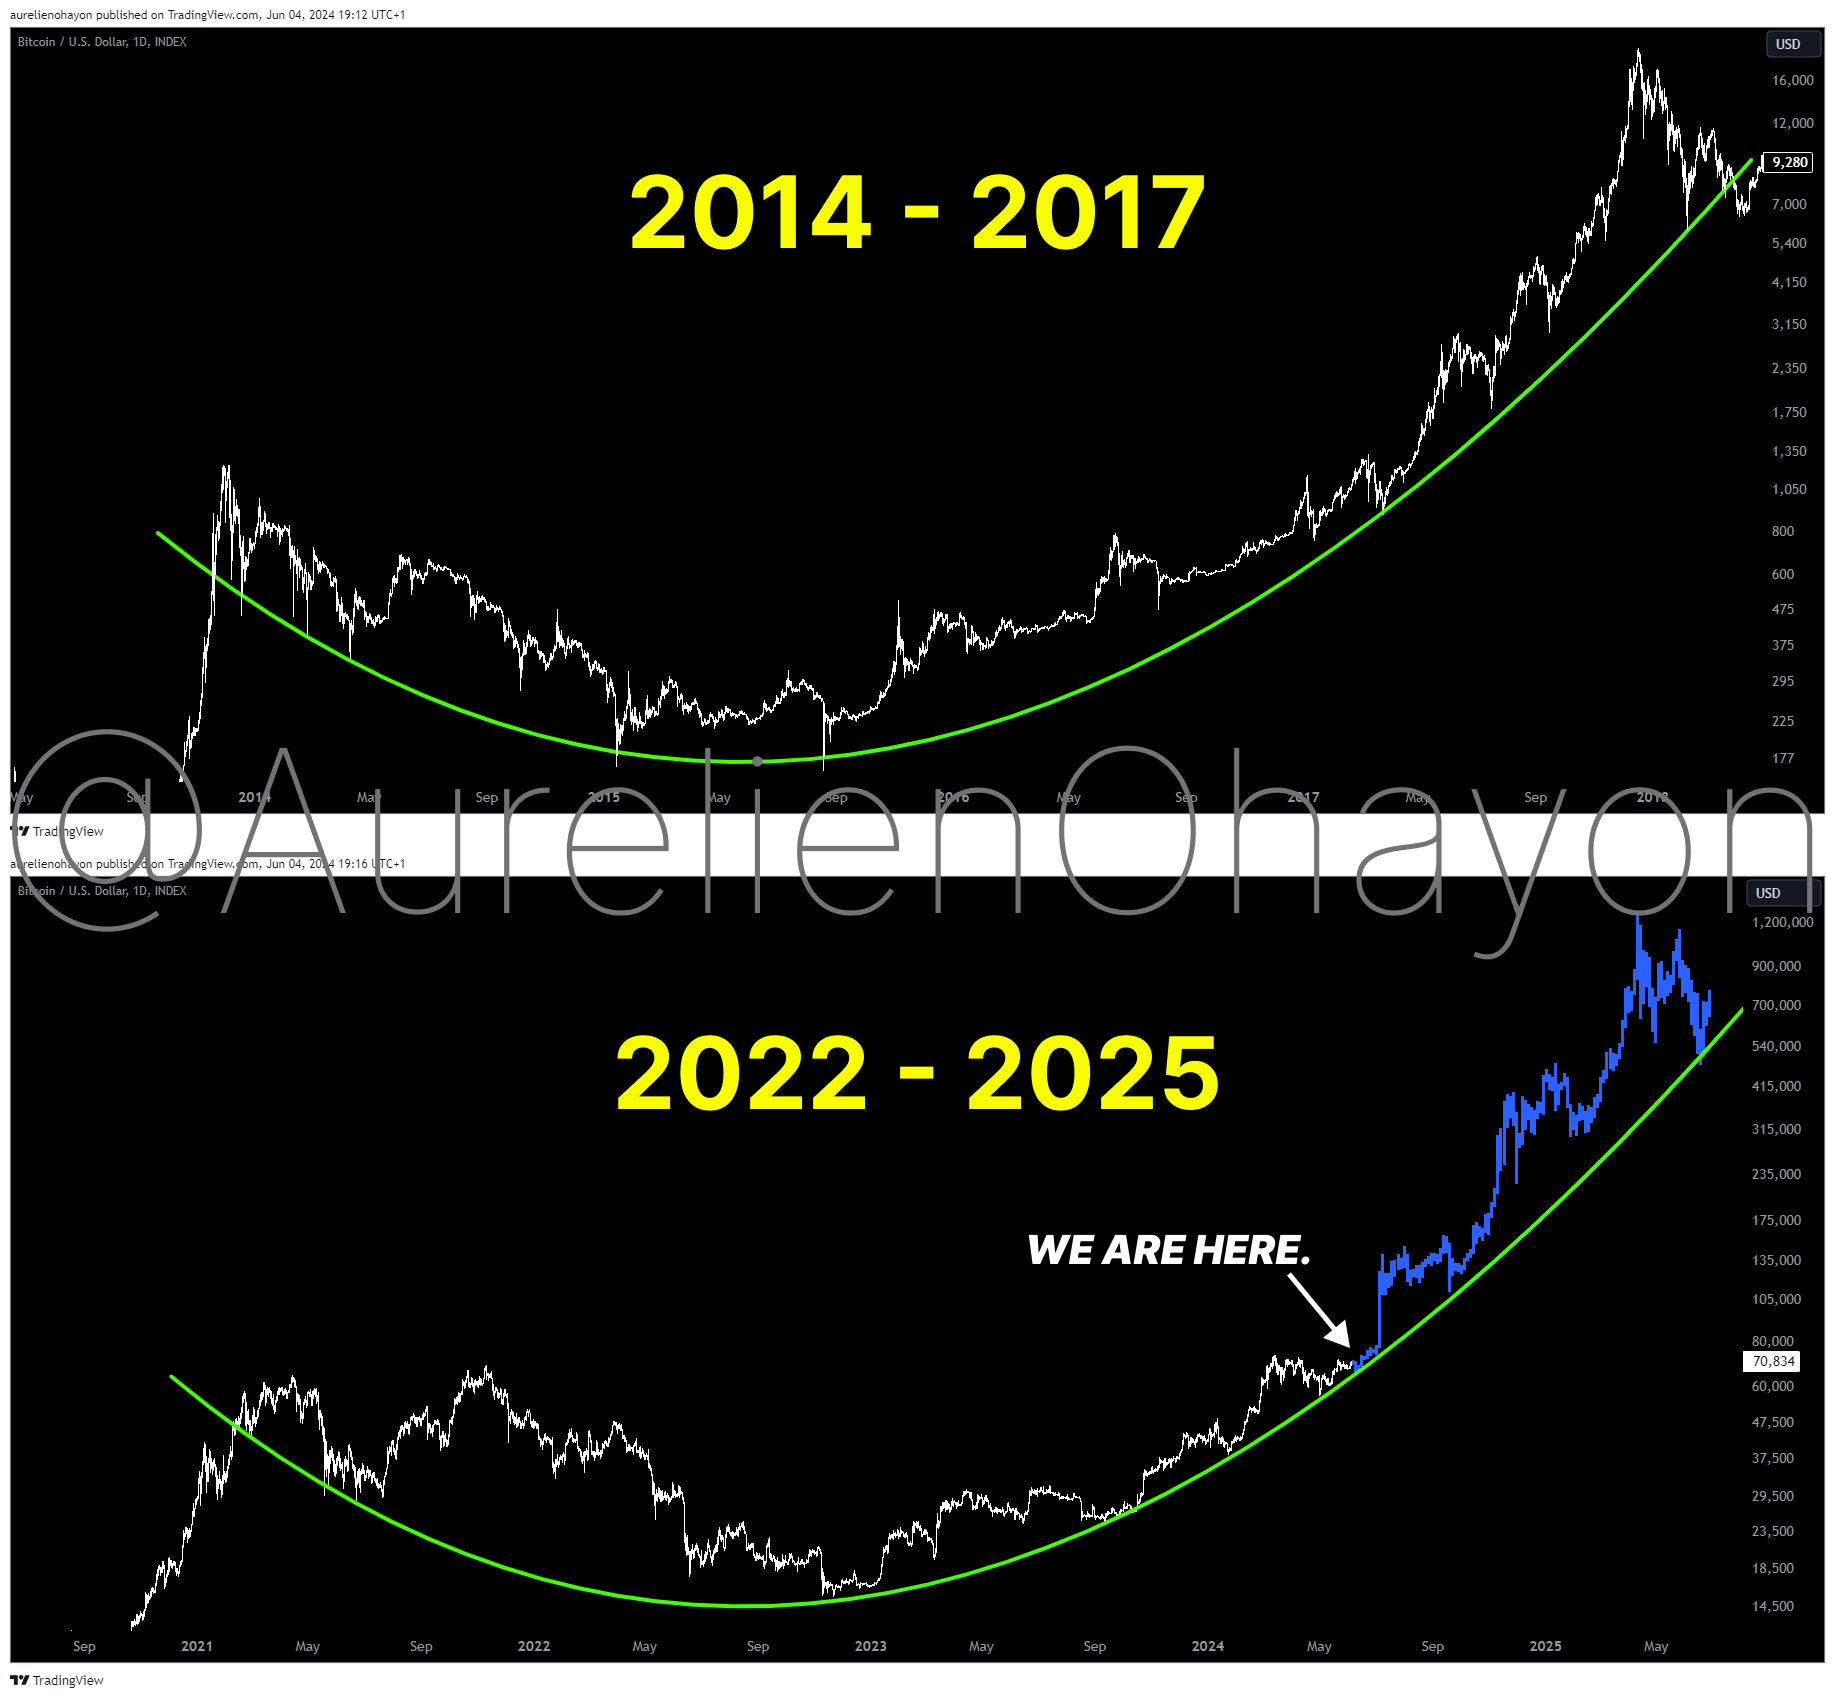
The $1 million prediction aligns with other analyses that suggest Bitcoin could experience significant long-term growth. A June report highlighted chart data indicating that Bitcoin might replicate past price spikes similar to those observed between 2013 and 2017.

Starting from a low of $162 in 2015, Bitcoin embarked on a substantial upward trajectory, eventually achieving new all-time highs.

Elsewhere, ARK Investment Management also predicted that Bitcoin could surpass $1 million by 2030. The firm’s report indicated that Bitcoin’s adoption as legal tender in countries like El Salvador could contribute to its increased market value.

Additionally, Bitcoin’s network has expanded significantly, now processing daily on-chain volume exceeding $46 billion—comparable to Visa’s settlement volume—which supports the optimistic projections for BTC.

Expert says XRP Won’t Just Experience a Bull Run, But a Perpetual Growth Cycle

0

Renounced XRP enthusiast says XRP will soon enter an unending upward trajectory in price and called on the community to buy the dip.

XRP and other cryptocurrencies have been dumped considerably recently, putting bulls in jeopardy. Bitcoin’s 5% weekly correction has spilled into XRP, with the Ripple-affiliated token struggling to hold $0.55.

This price underperformance has seen renounced experts question the validity of the expected bull cycle post-Bitcoin-halving, with Peter Brandt persistently raising concerns in that regard. However, XRP proponents have remained bullish, insisting that the asset would soar exponentially in the coming months.

According to Edward Farina, a crypto enthusiast and head of social adoption at XRP Healthcare, the XRPL native token would see a perpetual cycle. For context, a perpetual cycle insinuates an unending upward trajectory for the XRP price.

Expert Predicts XRP Surge

In an interview at this year’s Istanbul Blockchain Week, Farina stated that XRP and the crypto market will experience a perpetual bull cycle regardless of the current market predicament. He noted that it could take some time, but the market would experience the greatest bull cycle in history.

In a follow-up tweet, Farina noted that XRP would not just experience a bull run but an unending price surge. According to him, XRP proponents would look back at the current price of XRP in the future and marvel at the valuation difference.

Notably, Farina didn’t place a time for this call. However, he hinted to the XRP community how to prepare for the underlying parabolic expansion.

Farina Says to DCA

The crypto expert urged the community to keep accumulating assets with real-world use cases in preparation for the price spike. This is in line with an expert’s advice on diversification rather than investing only in XRP. Farina pointed specifically to tokens that are down 20x from their all-time high. Notably, XRP is down over 86% from its ATH of $3.84 in January 2018.

Also, the expert suggested a slow and strategic fund deployment on assets to accrue them at a good entry point. He noted that this would position users to make huge gains during the price upsurge.

Farina’s call for an XRP price explosion correlates with other experts who have seen the asset hitting lofty heights. Per earlier reports, analysts see XRP trading at higher prices like $50 and $100 in months.

Also, an expert stated that XRP’s fair market value price is $4,813. He based his prediction on the six-year-old Athey and Mitchnick model, which compares XRP price based on its usage for cross-border transactions and as a store of value.

Meanwhile, XRP traded at $0.5277 at press time, remaining almost neutral in the past 24 hours. Per CoinMarketCap voting, the XRP community remains bullish, with 73% of over 2,260 voters seeing the asset recovering soon.