Home Blog Page 1258

Ethereum Hits 4-Month High in Network Growth with 126,210 New Wallets Created on Typically Quiet Sunday

Despite a surge in network activity, the ETH price stays under $2,300 and takes a stand at a declining support trendline. Will Ethereum manage a bounce back or crash to $2,000?

Trapped in a bear channel, the Ethereum price is under extreme selling pressure, which puts massive pressure on the support trendline. Falling under $2,300, the minor recovery over the weekend with the network growth retests the broken $2,350 zone. 

With a higher price rejection and rising sell signals, Ethereum struggles to reclaim the $2,300 level and warns of a bearish continuation. Will this bearish continuation lead to the support trendline crackdown? Let’s find out. 

Rising Network Activity in Ethereum

In contrast to the ETH price fall, the network activity over the Ethereum blockchain has increased significantly. 

Over the last four months, the Ethereum network has grown fastest on Sunday. Although Sunday is traditionally the least active day of the week, 126,210 new ETH wallets were created on September 8.

This massive one-day spike over the weekend suggests increased network utility and signals a potential price rebound.

Amid the growing network, Ethereum whales are making a comeback. Over the last 48 hours, a whale has accumulated 5,000 ETH tokens worth $11.46 million at the recent bottom price. 

Historically, this whale has capitalized on price dips, purchasing 5,200 ETH at an average price of $1,322 in November 2022. This strategy paid off, as the whale later sold ETH at an average price of $2,093 in January, December 2023, and January 2024, earning over $4 million.

Ethereum Price at Declining Channel’s Support

On the daily chart, Ethereum is currently trading at $2,297, with an intraday peak of $2,320 facing rejection. Following a bearish close last week with a 5.29% decline, Ethereum experienced a lower price rejection at $2,150.

Despite holding this critical support level, Ethereum has seen a 16.98% drop over the past 14 days.

Ethereum price Chart

As the bearish continuation gains momentum, the support trend line of a more significant bearish channel is under pressure, warning of a breakdown rally. However, the bullish divergence in the RSI line teases a potential bounce back. 

Meanwhile, Ethereum’s broader market sentiment is turning bearish, undermining the momentum indicator. Further, the bearish crossover in the 100-day and 200-day EMA siren a selling signal. 

Amid the sell-off chances, Ethereum’s support levels are at the $2,150 mark near the trendline and the $1,930 horizontal levels.

Rising Ethereum Supply Puts Crucial Supports at Risk

Recently, a multi-signature wallet associated with Ethereum co-founder Vitalik Buterin has drawn attention amid its ongoing token dump. In August, this wallet received 3,800 ETH, valued at nearly $10 million, from Buterin. Since then, it has sold 760 ETH for $1.835 million USDC at an average price of $2,414.

Likewise, on Friday, a wallet linked to the Ethereum Foundation moved to unload 1,000 ETH tokens worth over $2.38 million. Notably, this wallet has a long history of dumping ETH at higher prices.

Essentially, despite some buyback moves from whales, these selling pressures continue to introduce bearish sentiment within the Ethereum community.

Ultimately, the rising supply is pressuring ETH prices downward. With the bearish trend persisting and market volatility high, maintaining key support levels will be crucial for determining Ethereum’s next move. Any significant breakdowns could lead to severe declines.

Expert says Do Not Be Fooled, Every Shiba Inu Dip is Preparing You for the Next Big Rise

0

Following the recent market downturn, popular Shiba Inu community member @ShibainuCoin advises SHIB investors to remain patient and stay strong. 

The ongoing market downturn has significantly impacted Shiba Inu, hindering the dog-themed token from progressing upward. Shiba Inu is struggling to break out of its current price range. The leading memecoin has remained within the $0.000013 price territory over the past week. 

Shiba Inu’s recent performance has left many investors concerned, with hopes of a near-term recovery gradually fading away. 

Top Community Member Issues Critical Advice

Amid this development, a pseudonymous Shiba Inu community member who goes by the X username “@ShibainuCoin” encouraged investors to stay patient during the ongoing downturn. 

They urged investors not to be misled by temporary declines, emphasizing that “every [SHIB] dip is just a setup for the next rise.” This suggests that each dip usually paves the way for a recovery.  

Furthermore, the expert indicated that temporary market declines are part of the normal market cycle, suggesting that investors should not be overly concerned. Notably, @ShibainuCoin emphasized the importance of remaining patient and trusting in Shiba Inu’s long-term prospects. 

Finally, they urged investors to hold SHIB rather than sell the asset during market downturns. 

Shiba Inu Team Issues Similar Advice 

It is noteworthy that this type of message is usually issued in the wake of significant price declines. Last month, Shiba Inu’s marketing lead, Lucie, issued similar advice to community members after SHIB staged a 23.48% decline in days, crashing from $0.00002010 to $0.00001538. 

At the time, the Shiba Inu marketing lead blamed the decline on unstable politics and global conflicts, especially the war between Israel and Hamas. 

Nonetheless, Lucie advised SHIB investors to ignore the short-term fluctuations and focus on the long-term developments, which could usher in a major rally.  

Shiba Inu is currently priced at $0.00001302, with a 24-hour trading volume of $113.96 million. Over the past 24 hours, SHIB has increased by 0.71%, but it’s down by 1.78% on the weekly charts.

SHIBUSDT 2024 09 09 06 55 11

It bears mentioning that Shiba Inu has embarked on major price recoveries over the years. For instance, Shiba Inu launched in August 2020 with an initial price of $0.000000000056. Two months later, SHIB eliminated a zero from its price, rising to $0.000000000132. Shiba Inu could not sustain this bullish momentum, as it fell to $0.000000000063 on November 30, 2020. 

While many investors thought SHIB would go down as another failed memecoin project, things started moving well for the asset. On January 31, 2021, Shiba Inu eliminated two zeros, reducing the number to eight.

A few months later, Ethereum co-founder Vitalik Buterin, who received 50% of SHIB supply (500 trillion SHIB) from the project’s pseudonymous founder Ryoshi, burned 410 trillion SHIB, putting the asset in the limelight, with top exchanges listing the token.

Shiba Inu later surged to an all-time high of $0.00008845 in November 2021, marking a whopping surge of over 150 million percent from its initial price. 

XRP Set to Surge 692%, Latest Technical Analysis Predicts Rise to $4.20

0

A recent technical analysis of XRP by Cointelegraph has sparked conversations about the value of the asset advancing toward $4.2

The analysis indicated that while the broader cryptocurrency market has seen significant growth in 2024, XRP has lagged. Indeed, Bitcoin and BNB have maintained over 30% gains year-to-date, while XRP has plummeted over 15% during the same time.

However, a closer look at XRP’s technical indicators reveals a promising trend. It suggests a potential turnaround in fortunes and a possible major price surge on the horizon for XRP.

Inverse Head and Shoulders Pattern Signals XRP Rally to $1

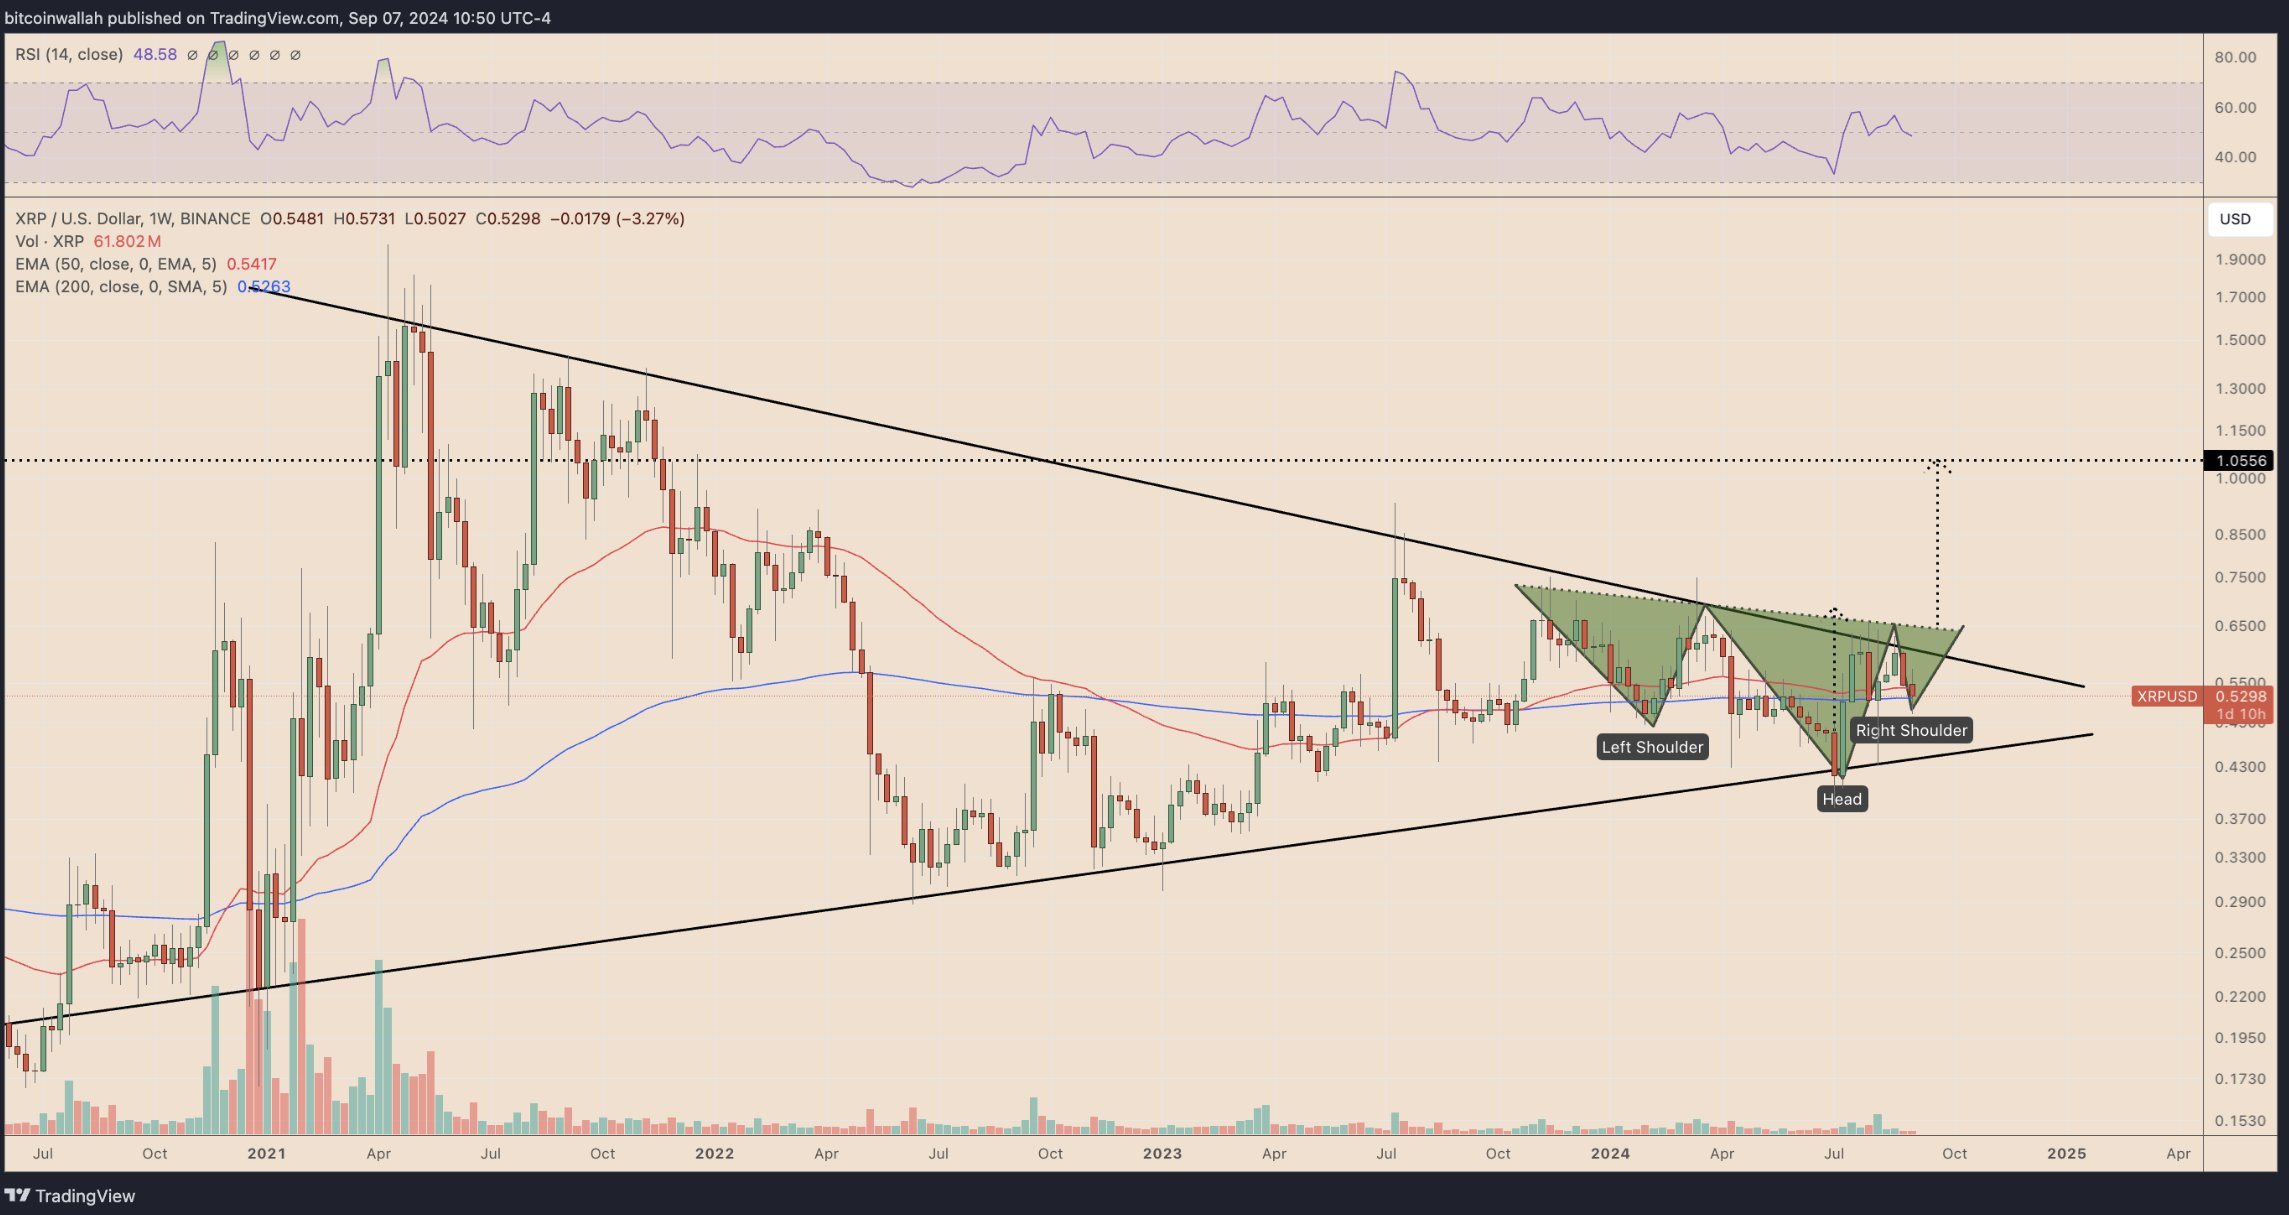
On the weekly chart, XRP appears to be forming a classic Inverse Head and Shoulders (IH&S) pattern, a well-known bullish reversal indicator. The left shoulder formed between May and December 2022, the head (or low point) in June 2023, and the right shoulder has been developing since August 2024.

XRP to $4.20
Image Source: https://x.com/Cointelegraph

Accordingly, the analysis identified key levels for traders to watch: the neckline of this pattern, located around $0.65 to $0.66. This is a trendline connecting the shoulders and head heights.

A breakout above this resistance could propel XRP toward the $0.90 to $1.00 range. This milestone will result in a return of over 90% from XRP purchased today at $0.526. Notably, the analysis highlighted that this target is attainable before 2024 ends.

Adding to the bullish case, XRP is currently trading above both its 50-week and 200-week exponential moving averages.

Symmetrical Triangle on Monthly Chart Hints at $4.20

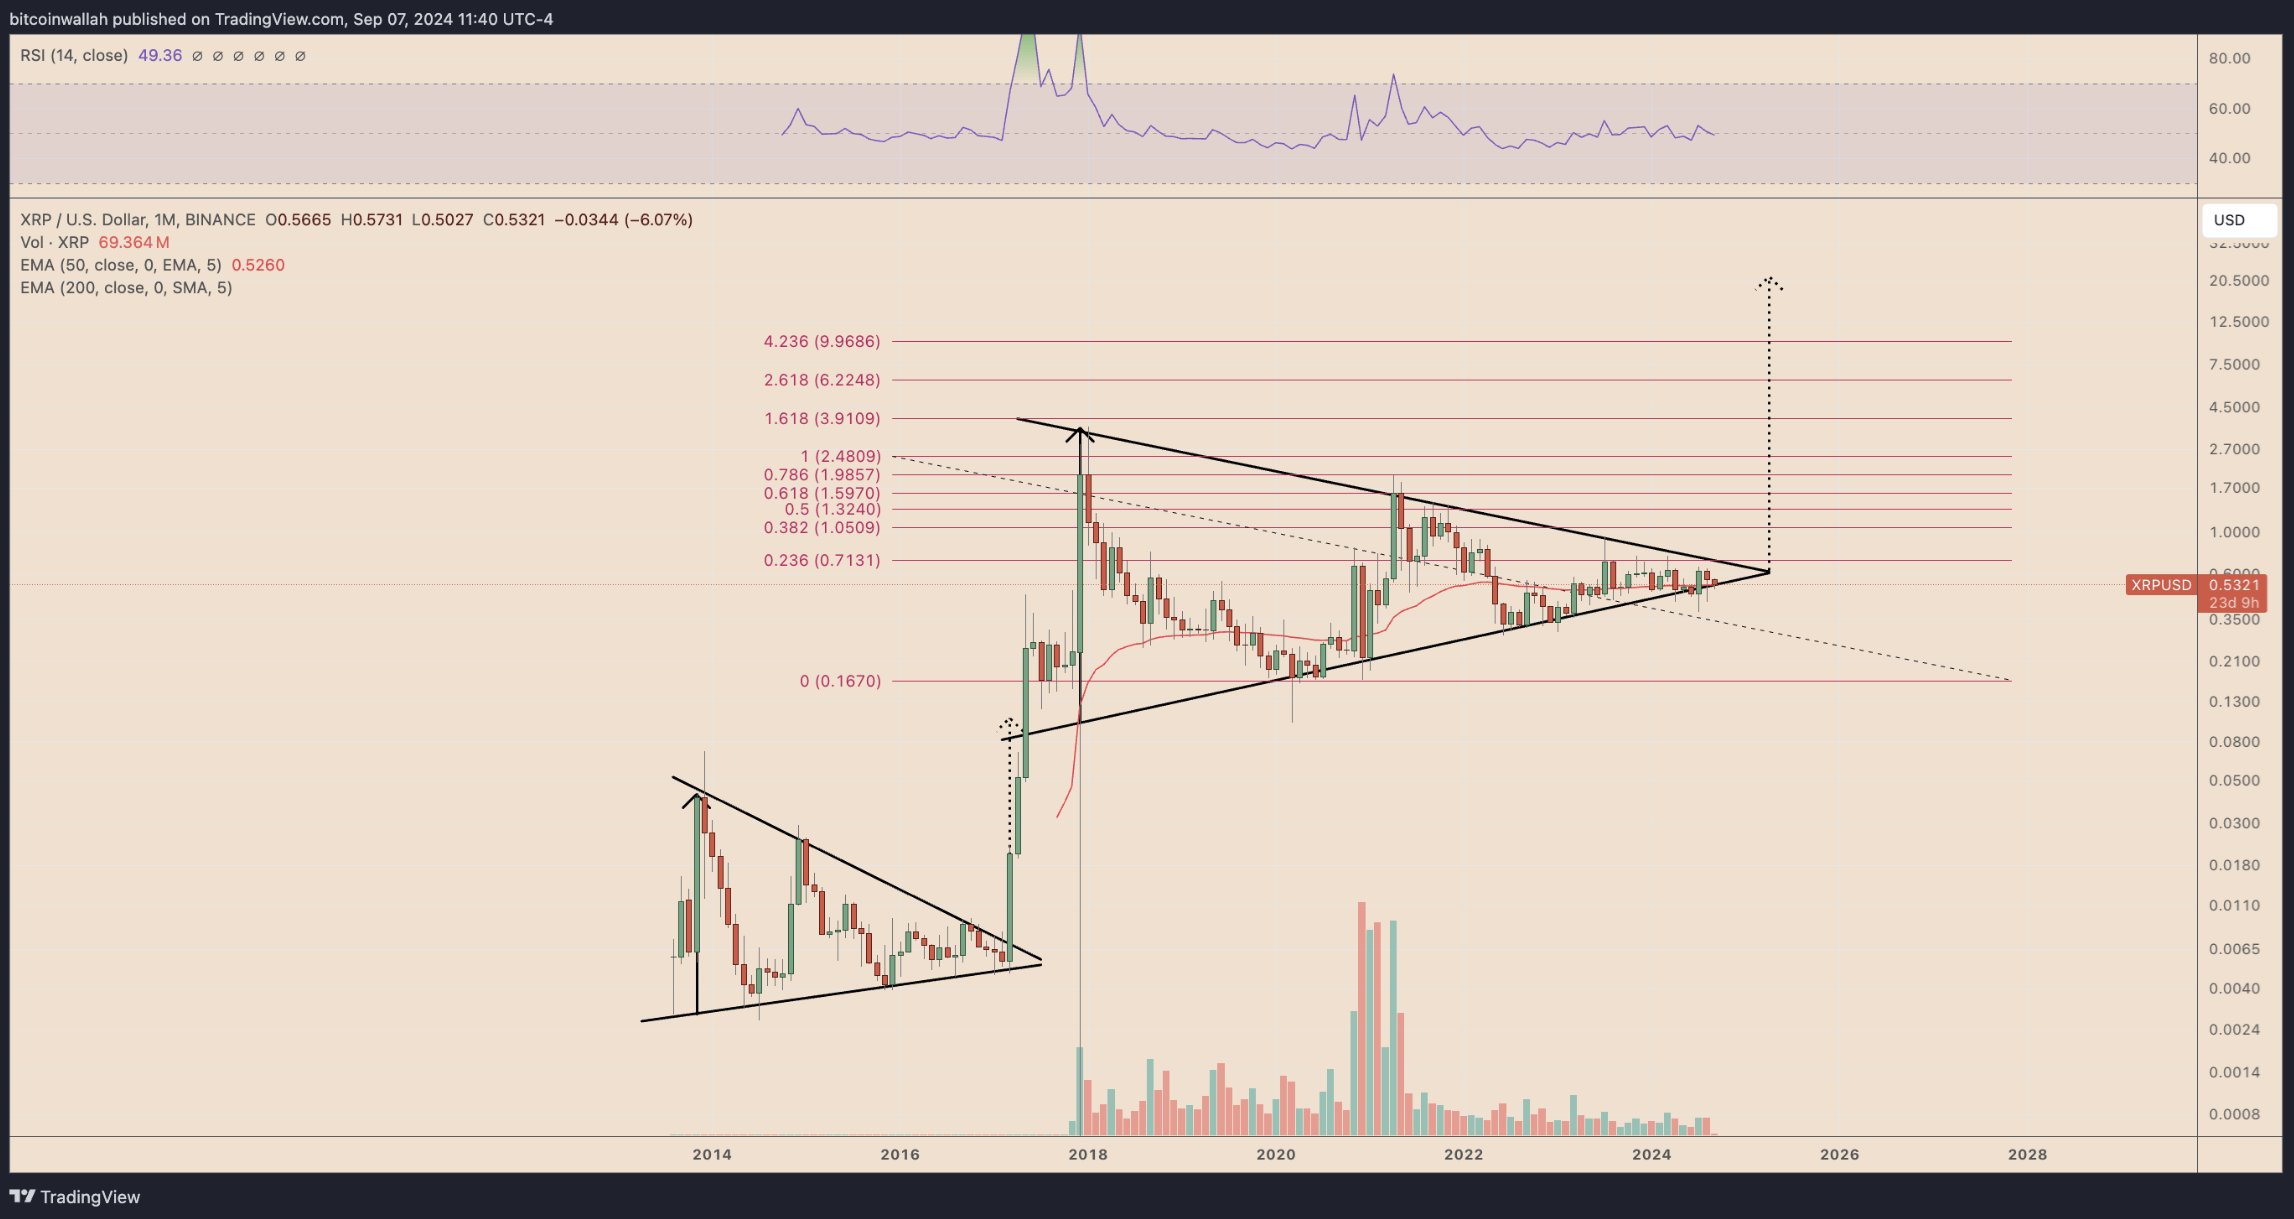
Zooming to the monthly chart, XRP also forms a symmetrical triangle pattern. Per the analysis, if the upper trendline of this triangle is broken, XRP could surge toward a target of $4.20 or higher based on long-term technical projections.

XRP to $4.20
Image Source: https://x.com/Cointelegraph

However, before this level is in play, XRP faces immediate resistance in the $0.71 to $1.05 range, which coincides with the 0.236-0.382 Fibonacci retracement levels. This zone aligns with the IH&S target, suggesting that a major rally could unfold if XRP breaks above these levels.

Community Reacts

Commenting on the analysis, Zach Humphries, a notable voice in the XRP community, expressed that XRP offers a strong opportunity both in the short and long term at its current price point. He stressed that XRP shows significant upside potential near or just under $0.50.

In previous analyses, some market observers have speculated that XRP could reach as high as $300 following a breakout from the long-term resistance. However, such projections are often resisted, with many considering them overly optimistic. 

The latest analysis, which suggests a more modest long-term target of $4.20, aligns with a growing consensus that this range is more achievable for XRP. Notably, reaching $4.20 requires XRP to advance by over 692% or expand by 7X.

Ethereum Whale Drops $16M on This Token—Here’s the Shocking Outcome

0

The unpredictable nature of the cryptocurrency market has led to substantial losses for another prominent figure.

Machi Big Brother, a well-known influencer and Ethereum advocate with a large following on X, is currently experiencing severe financial setbacks from his investments in the ERC-20 token FRIEND.

On-chain analysis by Lookonchain reveals that Machi Big Brother has lost more than $16 million due to the token’s price plummeting by over 90%.

Heavy Losses in FRIEND Token Investment

Machi Big Brother, who commands a substantial following of over 165,000 on X, invested heavily in FRIEND, initially purchasing $11.1 million worth of the token.

This substantial buy-in required Machi to spend approximately 5,200 ETH, valued at $16.7 million at the time. However, the token’s price recently suffered a sharp 26% decline over 24 hours, bringing its value down to $0.05927 per token.

This drop has dramatically reduced Machi’s position to a mere $0.7 million, resulting in a significant $16 million loss.

The rapid devaluation of FRIEND has added Machi to a growing list of crypto traders who have faced harsh outcomes in the volatile market. 

Previous Losses in FRIEND Token

This is not the first instance in which Machi Big Brother faced major losses with FRIEND. Back in June, the influencer encountered a 50% loss on his initial investment in the same token.

According to data from Lookonchain, Machi began accumulating FRIEND tokens in early May, acquiring 8.6 million tokens at an average price of $1.81 each. This early investment required approximately 4,975 ETH, worth $15.6 million at the time. Unfortunately, within 30 days, the token’s price plunged by 60%, causing Machi’s holdings to lose significant value.

By the end of June, his position had dropped to just $6.95 million, marking a $8.65 million loss in just over a month. This pattern of losses with FRIEND highlights the volatile nature of speculative crypto investments.

Market Overview of FRIEND Token

Currently, FRIEND is facing ongoing challenges in the market. As of this writing, the token is trading at $0.06114, marking a steep decline in both daily and weekly performance. 

In the last 24 hours alone, the token has fallen by 22.35%, and over the past week, it has experienced a 49.32% decline. FRIEND’s total trading volume in the last day reached $333,564, further illustrating the token’s current struggles in the highly volatile crypto space.

Here’s How High Shiba Inu Could Go if BTC Market Cap Hits VanEck’s Projection of $61T 

0

Shiba Inu (SHIB) could set a new all-time high record if Bitcoin hits a market cap of $61 trillion, as projected by VanEck. 

The massive bloodbath across the financial market has not spared Bitcoin, the world’s largest crypto by market cap. In the past 24 hours, Bitcoin’s price has declined by 2.87%, crashing to $54,455 per BTC. Moreover, the premier asset has witnessed a weekly loss of 7.93%. 

While Bitcoin’s recent performance has disappointed many investors, some enthusiasts are comforted by the positive projections for the cryptocurrency. 

VanEck Eyes $61 Trillion Market Cap for Bitcoin 

Out of the multiple projections, VanEck’s prediction stands out. As reported earlier by TheCryptoBasic, VanEck, the $108 billion asset manager and Bitcoin ETF issuer, predicted that BTC will hit a market cap of $61 trillion by 2050, exactly 26 years from now. 

According to VanEck, this market cap will see Bitcoin trade at $2.9 million per coin. VanEck predicted that Bitcoin would be an integral part of global finance by 2050, emphasizing that it would be used to settle 10% of international transactions. 

The firm also projected that central banks would hold 2.5% of their assets in BTC, potentially driving Bitcoin’s market cap to $61 trillion. To hit this $61 trillion target, Bitcoin’s valuation must surge 5,600% from the current level of $1.07 trillion. 

Shiba Inu Correlation with Bitcoin 

With VanEck expecting Bitcoin to hit a valuation of $61 trillion by 2050, investors are concerned about how this massive surge could impact the altcoin market, including Shiba Inu (SHIB). 

It is common knowledge that Bitcoin has consistently determined the performance of the crypto market. Notably, Shiba Inu’s price has closely followed Bitcoin’s movement, as observed several times. 

According to IntoTheBlock data, Shiba Inu has maintained an 85% correlation with Bitcoin’s price over the past 30 days. This suggests that Bitcoin has significantly influenced Shiba Inu’s price movements during this period. If this correlation persists, a rise in Bitcoin’s price could propel a similar rally for SHIB and vice versa. 

Here’s Shiba Inu’s Price if Bitcoin Hits $61 Trillion 

With Bitcoin expected to surge 5,600% to hit VanEck’s projected market cap of $61 trillion, Shiba Inu’s valuation could similarly soar to $436.05 billion from its current level of $7.65 billion, provided it continues to maintain its strong correlation with Bitcoin. 

This market cap would take Shiba Inu’s price to a new all-time high (ATH) of $0.00073929, marking an increase of 5,600% from the current price of $0.00001297. 

Hitting the $0.00073929 could be challenging for Shiba Inu due to the asset’s hefty supply of 589.27 trillion. However, with projects like Shiba Eternity expected to bolster the ongoing SHIB burn campaign, the token could achieve greater milestones, including hitting the $0.00073929 target.

Here’s the Only Reason Shiba Inu Cannot Surge to $1, $0.01, or $0.001

0

The ambitious $1 price for Shiba Inu stands far-fetched due to valuations that could exceed even the global wealth estimate.

Amid the ongoing market downturn, Shiba Inu remains at the mercy of the bears. On Friday, SHIB again retreated to the $0.000012 price range. Now, SHIB trades at $0.00001291, down by over 7% over the past week.

However, regardless of the ongoing bearish sentiment in Shiba Inu, proponents continue to hold lofty aspirations for the meme coin. They anticipate a future where SHIB trades with fewer leading zeros, like $0.001, or where it has none, trading at $0.1 or $1.

However, a much-overlooked aspect of these price predictions is the potential market valuation that SHIB would accrue at these prices.

Shiba Inu Market Size at $0.001

In August, Armando Pantoja from Benzinga’s crypto advisory board predicted a major surge for Shiba Inu, projecting a 72X increase to $0.001. Pantoja cited a bullish RSI divergence and suggested that the cryptocurrency had entered a prime buying zone.

He asserted that SHIB could rise dramatically, offering investors a potential 7,193% gain from current prices. The August analysis built upon an earlier one in which Pantoja asserted that Shiba Inu was headed towards $0.001 after Bitcoin’s halving.

Notably, with a supply of over 589 trillion SHIB tokens, this meme coin would command a market cap exceeding $589 billion. Remarkably, this hypothetical market cap is even more than twice the current valuation of Ethereum, the king of altcoins.

Critics see this enormous market cap as a far-fetched dream, countering those who think it is attainable by next year.

Shiba Inu Size at $1 and $0.01 Prices

Meanwhile, hopes of Shiba Inu someday attaining a $0.01 price point or even $1 are widespread in the crypto community. Among the leading voices championing this bold forecast is even a team member of the Shiba Inu project crew, Lucie, the content marketing specialist.

During the Shiba Inu frenzy of early this year, Lucie conveyed her long-term sentiment that SHIB will one day attain $0.01. Aside from Lucie, the one-cent dream is a standing aspiration for the meme coin among community members. Although, most have avoided issuing a timeline for this to happen.

Notably, should its supply remain unchanged, Shiba Inu will clock a market cap of $5.89 trillion at a price of $0.01. This theoretical market cap is more than five times the current valuation of Bitcoin, the biggest crypto.

More remarkably, at $1, Shiba Inu would command an insane cap of $589 trillion. For context, the global wealth is estimated at $454 trillion. As a result, this market cap required for SHIB at $1 makes the price point unrealistic because it asks the question of what would be the global wealth figure in such a case or even the cap of Bitcoin, where only SHIB could attain $589 trillion.

Essentially, the resulting market cap of Shiba Inu at prices of $0.001, $0.01, and $1 makes predictions for these prices mere fanciful dreams with barely any dose of reality.

Shiba Inu needs to increase by 7,745,833% to hit $1. Interestingly, looking at history, Shiba Inu’s percentage price surge from its all-time low far exceeds this required growth.

It is worth mentioning that prediction platform Telegaon, which forecasts a SHIB $1 price, has set a timeline of 2050, which is nearly three decades away.

Here’s XRP Price if Bitcoin Market Cap Hits $61 Trillion

0

XRP price could reach unprecedented levels if XRP follows Bitcoin as the market leader guns for a $61 trillion market cap.

Notably, at press time, Bitcoin (BTC) currently boasts a market cap of $1.072 trillion, firmly holding its spot as the largest cryptocurrency by valuation. BTC alone accounts for over 55% of the global crypto market cap, with the entire altcoin market sharing the remaining 45%.

Being the market leader, Bitcoin often dictates the direction of the broader crypto market. This trend has been observed across multiple market cycles, where a BTC drop leads to a bearish market and an uptrend typically triggers a bull run.

XRP and Bitcoin Price Correlation

For instance, with Bitcoin now down 2.66% over the past 24 hours, the rest of the market has collapsed. XRP, one of the top 10 largest altcoins, has also trailed Bitcoin’s price action. Data from CoinMarketCap confirms that XRP price has consistently moved alongside Bitcoin over the past month.

Bitcoin and XRP Price Correlation

Due to this price correlation, any upsurge recorded by Bitcoin could spill to the altcoin market, impacting XRP. As a result, bullish predictions surrounding Bitcoin could indirectly translate to a positive outlook for the entire crypto market, with XRP poised to benefit significantly from such positive movements.

One such bullish prediction came from Bitcoin ETF issuer and asset manager VanEck. In a report earlier this week, The Crypto Basic confirmed that VanEck predicted a possible spike in Bitcoin’s price to $2.9 million by 2050. Remarkably, such a value could push Bitcoin’s market cap to a whopping $61 trillion, the largest for any single asset.

XRP Price if Bitcoin Hits $2.9 Million

Bitcoin, which trades for $54,219, would need to rally 5,248% to hit the $2.9 million target. If XRP follows in Bitcoin’s footsteps, its price could surge tremendously. For context, XRP price currently hangs around $0.5274, with a market cap of $29.7 billion. A 5,248% increase would push XRP to $28.2, with a market cap of $1.58 trillion.

Meanwhile, AI chatbots ChatGPT and Grok presented a mix of varying targets for XRP if Bitcoin hits the $2.9 million goal. Grok predicted that XRP could rally to $16.897 in a scenario where BTC clinched the VanEck target, considering multiple market assumptions.

However, ChatGPT presented a more bullish outlook. According to the OpenAI-backed LLM chatbot, XRP is capable of reaching $29.85 if it mirrors Bitcoin’s gains on the back of a rally to $2.9 million.

Power Law Analysis Predicts XRP to Surge 9,355% to $50 in Months

0

Levi Rietveld, a popular crypto YouTuber, has recently leveraged a mathematical phenomenon to forecast the price trajectory of XRP over the next few months.

In a recent video, Rietveld explained how the power law—a concept that accurately predicts the rotational speeds of planets and word frequency in languages—can also be applied to cryptocurrencies. 

According to Rietveld, this law has been “dead accurate” in forecasting Bitcoin’s price movements over the last decade and XRP’s performance in recent years.

Applying the Power Law to Bitcoin and XRP

Rietveld’s analysis hinges on the concept of a log line chart, which he says provides insight into Bitcoin’s entire price history. He points out that the chart’s bottom red line represents Bitcoin’s long-term support, a level below which it is unlikely to fall.

Conversely, the top line marks Bitcoin’s all-time highs, providing guidance on when to buy and sell. This same method, when applied to XRP, presents a promising outlook for the asset’s future price.

Rietveld’s analysis suggests that Bitcoin’s next major peak could reach as high as $200,000 by mid-2025, aligning with historical price movements after previous halving events. More notably, XRP could soar to $50 per coin during the same period.

XRP Price Predictions for 2025

According to Rietveld’s calculations, XRP’s base case projection for mid-2025 falls between $5 and $20 per coin. However, under the most optimistic scenarios using the power law, the price could touch $50. 

Notably, XRP trades at $0.5288 today, down by 1.25% over the past day. Its last all-time high price was $3.84. Given the $50 price point forecasted by the power law by mid-2025, XRP must rally by 9,355% to hit the target in less than a year.

These predictions are based on XRP’s historical trading data from 2017 and 2021, coupled with broader market conditions such as Bitcoin halving and anticipated interest rate cuts by the Federal Reserve.

In parallel, Rietveld stressed that now may be the ideal time for XRP investors to consider increasing their positions. In his video, he even shared his own profitable long positions on XRP, encouraging others to join him in leveraging opportunities using futures trading. 

According to him, the power law’s predictions and market trends provide a “perfect alignment” for a potential blowoff top for XRP next year.

Shiba Inu to Surge 7,167% to $0.00094035 if Ethereum Hits $166K as Predicted by Ark Invest

0

This article outlines how Shiba Inu can surge above $0.0009 if Ethereum hits the $166,000 price projected by Ark Invest CEO Cathie Wood.  

The top two biggest cryptocurrencies by market cap, Bitcoin (BTC) and Ethereum (ETH), have continued to impact the performance of other crypto assets, including Shiba Inu (SHIB). 

Shiba Inu Has More Correlation With ETH Than BTC 

For instance, Shiba Inu’s price has plunged 2.3% over the past 24 hours to $0.00001294. Similarly, Bitcoin and Ethereum have also recorded declines of 2.93% and 2.54% in the same timeframe, respectively. 

Data from blockchain analytics platform IntoTheBlock (ITB) shows that Shiba Inu correlates more with Ethereum than Bitcoin. According to ITB, Shiba Inu boasts a correlation of 93% with Ethereum’s price over the past 60 days. However, the dog-themed token’s correlation with Bitcoin stands at 71% in the same period. 

SHIB correlation with ETH

This suggests that Ethereum’s performance has impacted Shiba Inu’s price more in the past 60 days. Should Shiba Inu maintain this correlation, its price will surge anytime Ethereum stages an increase, and vice versa. 

Here’s Shiba Inu’s Price if ETH Hits $166,000 

Following the recent decline in the crypto market, we analyzed some top ETH predictions and how they could impact Shiba Inu’s price. Specifically, we focused on the prediction from ARK Invest’s CEO Cathie Wood, who projected that the ETH price could hit $166,000 by 2032. 

According to Cathie, ETH will hit a market cap of $20 trillion by 2032, approximately eight years from now. For ETH to hit this target, the second-biggest cryptocurrency by market cap must surge 7,167% from its current price of $2,284. 

Therefore, if Shiba Inu experiences a similar growth rate of 7,167%, its price would increase to $0.00094035, assuming SHIB’s circulating supply remains fairly stable at 583.45 trillion. In this hypothetical scenario, Shiba Inu’s market cap will surge from $7.62 trillion to a whopping $554.29 trillion. 

It is noteworthy that this analysis is for informational purposes. Hence, it should not be taken as financial advice as there is no guarantee that SHIB would hit this target anytime soon. 

XRP Fair Market Value Stands at $4,813, Per Athey and Mitchnick Model

0

A valuation model by Susan Athey and Robert Mitchnick reveals a potential fair market value for XRP, positioning it at an impressive five-figure price. 

XRP, currently trading for $0.5281, has underperformed across multiple market cycles. However, some suggest this underperformance is due to price suppression from several factors, including the just concluded Ripple lawsuit.

As a result, several individuals have introduced multiple models to evaluate XRP’s fair market value if this suppression never occurred. Developed in 2018, the Athey and Mitchnick model is one of the first publicly shared attempts to determine XRP’s true worth. It factors in XRP’s role as a transactional asset and a store of value.

XRP Fair Market Value at $4,813

The Athey-Mitchnick model builds its projections on two major drivers: XRP’s use in cross-border payments and the demand for it as a store of value. The model assumes that by 2030, 10% of global transactions would be processed using the XRP Ledger (XRPL). 

Additionally, the 10% target also applies to global assets moving to XRP, contributing to the price surge. The model takes into account XRP’s utility for fast, borderless transactions, along with its ability to be stored, which limits supply in circulation for payments.

XRP Fair Market Value by Athey and Mitchnick Model

According to the valuation technique, XRP’s fair market value sits at a massive $4,813. A key aspect of this projection revolves around XRP’s unique virtuous cycle, where an increase in adoption for payments results in a higher price. 

This, in turn, spurs more users to hold the asset for its long-term value, effectively reducing its availability for transactions. This is central to the forecasted exponential price increase, as both demand for transactions and store of value push prices upwards. 

Further Considerations and Limitations

In addition, the model also estimates that escrowed XRP would not be available for use in transactions, further limiting supply and adding upward pressure on the price.

To compute this fair market value, Athey and Mitchnick assume that daily transaction volume could reach $700 billion, while demand for storing XRP could amount to $53 trillion by 2030. The circulating supply of XRP is set at 56 billion tokens, with a discount rate of 10% applied to adjust for the future value of money.

Interestingly, they suggest that the model is conservative in that it excludes some potential markets like real estate and derivatives, meaning the fair value could be even higher if those factors were included. Despite this, it discusses the price potential of XRP as adoption scales across various sectors.

However, it’s worth noting that the model does not factor in supply shocks, central bank digital currencies (CBDCs), or new use cases that may emerge post-2030. This presents certain limitations to its accuracy, yet its influence remains substantial in the ongoing debate about XRP’s suppressed price due to past regulatory challenges, including the SEC lawsuit.