Home Blog Page 1303

Bitcoin Funding Rates on Binance Hit Year’s Lowest Level, Will Bearish Momentum Continue?

0

Bitcoin’s funding rates on Binance have recently reached their most negative level for the year, indicating a shift in market sentiment. 

This is according to a recent CryptoQuant report. Notably, per the report, Binance holds the largest share of open interest (OI). As a result, the fact that funding rates on the exchange have turned negative could suggest a short-term bearish outlook.

The report emphasizes how this change in funding rates mirrors Bitcoin’s fluctuating price behavior, especially since November 2023, when Bitcoin saw a significant price surge before experiencing intermittent corrections and a gradual decline into August 2024.

Funding Rates Turn negative

Funding rates on Binance are essential indicators of market sentiment. These rates reflect the payments exchanged between traders based on differences in the perpetual contract price and the spot price. Positive rates indicate a bullish market, while negative rates suggest bearish conditions. 

The volatility in these rates became more pronounced in Q3 2024, as the rates fluctuated between positive and negative values. Notably, in November 2023, funding rates briefly turned negative when Bitcoin’s price neared the $25K mark.

Now, in August 2024, they have reached their most negative point of the year, coinciding with Bitcoin’s recent price decline. 

The rise of Bitcoin’s price began in November 2023, after the Binance funding rates turned positive, surging from the $25K range to over $70,000 by June 2024. This swift increase was accompanied by occasional corrections, but overall, the price trend remained upward. 

As of August 2024, Bitcoin’s value has fallen to approximately $58,000, reflecting ongoing market volatility. 

April Halving Sparked Funding Rate Drop

Recall in April, data from the Bitcoin futures and derivatives markets revealed that Bitcoin’s funding rate had turned negative for the first time this year, just before the halving event. Market research firm Kaiko spotlighted this shift while analyzing Bitcoin’s network performance leading up to and following the April 20 halving. 

According to Kaiko’s recent report, the halving has already begun to exert a broad influence on Bitcoin’s market dynamics. Notably, one key effect occurred right before the halving, when Bitcoin’s funding rate shifted into negative territory for the first time in 2024.

Capital Flow Shifts in Bitcoin and Ethereum

Adding to the negative sentiment, recent data reveals a notable shift in capital flows within the crypto market. According to Glassnode, capital inflows for Bitcoin and Ethereum have dropped significantly in the past two weeks. 

This decrease from $20 billion to $14 billion suggests a decline in investor interest, likely due to increasing concerns over market volatility. Simultaneously, investments in stablecoins have surged from $2 billion to $4 billion.


Xaman Wallet Partners with Mastercard’s Immersve to Roll out Self-Custody Web3 Cards

0

Xaman Wallet collaborates with Immersve, a global web3 card issuing platform and principal member of Mastercard, to launch self-custodial web3 cards.

Xaman Wallet, formerly known as Xumm Wallet, has announced its partnership with Immersve to roll out a self-custody web3 cards powered by Mastercard.

Xaman Wallet announced the partnership in an August 15 post on X, quoting an Immersive tweet to the XRP community. The disclosure spotlighted a new functionality that will power the web3 MasterCard experience.

XRP community figure Eri reacted to the collaboration between Xaman Wallet and Immersve, congratulating Jerome Faury, the founder of Immersve, on the milestone.

In an August 14 blog post on its official website, MasterCard explained the motive behind the project and the rising need for self-custody web3 cards, which give users full control over their funds.

Mastercard emphasized that its new web3 program will usher in a Mastercard experience for self-custody wallet users. It is also expected to enable them to enjoy the global reach of Mastercard while having full control of their funds at the same time.

Other Partnerships

Mastercard has a similar partnership with industry leaders like MetaMask, Baanx Group, Monavate, and 1inch, as it aims to bridge the gap between the traditional and decentralized financial worlds.

Some basic features of the end product of these partnerships include Know Your Customer and anti-money laundering protocols. These new products also allow users to view transaction history and reverse transactions.

New Documentation for Decentralized Apps

Immersve, which focuses on issuing web3 cards designed for decentralized apps and exchanges, has already released detailed documentation for decentralized app developers. The documentation gives a framework to decentralized app developers who want to embed their own branded web3 Mastercard for their respective projects.

Xaman Wallet, rebranded from Xumm last December, is the leading self-custody wallet for the XRP Ledger, allowing users full control over their assets, unlike centralized wallets. 

South Korea’s National Pension Service Buys $33.75M in MicroStrategy Shares

0

South Korea’s National Pension Service (NPS) increases its indirect investment in Bitcoin with a fresh $33.75 million in Microstrategy shares.

Data confirms the pension service purchased 24,500 shares of US-based software company MicroStrategy in the second quarter of the year. 

The NPS submitted its 13F quarterly report to the United States Securities and Exchange Commission (SEC) on August 13, revealing that the fund has acquired MicroStrategy (MSTR) shares worth $33.75 million in Q2 2024, with each stock valued at an average price of $1,377. 

The NPS purchase occurred before Microstrategy announced a 10 for 1 stock split effective from August 1. The 10-for-one stock split has now toaken NPS’s total shares in Microstrategy to 245,000, still with a valuation of $33.75 million. 

NPS Coinbase Investment

The recent investment by the NPS is its second foray into indirect investment in Bitcoin. In the third quarter of 2023, the pension service debuted its indirect investment in Bitcoin strategy by acquiring 282,673 shares of Coinbase stock, another US-based company. 

The National Pension Service acquired the Coinbase (COIN) shares at an average price of $70.5, totaling an investment of $19.92 million. 

Microstrategy’s Bitcoin investment

Notably, Microstrategy, co-founded by Bitcoin advocate Michael Saylor, is the single largest United States company holding Bitcoin. 

As of August 1, 2024, Microstrategy owns 226,500 Bitcoin. According to Bitcoin Treasuries, the average purchase price of the company’s Bitcoin stash is $35,158 per coin, totaling $7.538 billion. Michael Saylor earlier described Bitcoin as the best strategy given the upward surge in Microstrategy’s stock price since it adopted Bitcoin.

XRP Price Prediction: XRPL Network Demand Surges Despite $28B Crypto Market Dip

XRP’s price remained steady above the $0.57 mark on Thursday, August 15, gaining 6.7% over the last four days. On-chain data reveals steady growth in user activity on the XRP Ledger (XRPL) network since the recent update in the Ripple vs. SEC case. With this catalyst in play, could XRP’s price push above the critical $0.60 level?

XRP Has Climbed 4% this Week

At the beginning of August, XRP had a difficult start as its price dropped to the lowest point in three months on August 5. However, the overall cryptocurrency market began to show signs of improvement during the second week of the month. This recovery was partly due to the less severe penalty imposed on Ripple by U.S. authorities. This decision was viewed positively by many investors, especially considering the prolonged legal dispute with the Securities and Exchange Commission (SEC).

XRP Price vs. TOTAL3 | XRPUSD | TradingView

During the recent market fluctuations, XRP has shown remarkable resilience when compared to other alternative cryptocurrencies. This resilience can be observed in the price action, as XRP experienced a notable 6.7% price increase, rising from $0.55 to $0.574 between August 11 and August 15. Meanwhile, the TOTAL3 chart indicates a 4.8% decline in the broader altcoin market, which lost over $28.4 billion in market capitalization. This contrast suggests that XRP has internal bullish catalysts, propelling its performance ahead of the market average.

Ripple Victory Has Sparked an Increase in Network Usage

The impact of the ruling appears to extend beyond mere FOMO buying. Underlying on-chain data shows a significant increase in user activity on the XRP Ledger blockchain since the ruling. Specifically, daily transactions on the XRP Ledger have surged, reflecting broader market confidence.

XRP Ledger Daily Transactions Count vs. XRP Price | CryptoQuant

The chart highlights that daily transactions rose from 985,498 on August 6 to 1,587,800 by August 13. This represents a 61% increase in just a week. The surge correlates with the U.S. court’s decision to fine Ripple $125 million, marking a positive end to the prolonged SEC case.

Two factors contribute to this bullish signal: first, increased daily transactions often indicate heightened network activity, a precursor to price surges. Second, more transactions suggest growing adoption, which is typically positive for long-term price stability. If this trend continues and broader market sentiment improves, XRP could be on the verge of a major breakout.

XRP Price Forecast: $0.61 Sell-Wall Looming Large

The technical outlook for XRP is cautiously optimistic, with key resistance and support levels in focus. XRP has been trading within a narrow range between $0.55 and $0.57. The recent uptick to $0.574 brings XRP closer to a critical resistance level at $0.61.

The Keltner Channel (KC) indicator suggests that XRP’s price is nearing the upper boundary, a potential sign of overextension. However, the Parabolic SAR (Stop and Reverse) dots remain below the price, indicating a continuing uptrend.

XRP Price Analysis (XRPUSD) | TradingView

The first major resistance at $0.61 is significant, as it marks the upper limit of the current trading range.

If XRP manages to break through this resistance, the next target would likely be around $0.65. However, failure to surpass $0.61 could lead to a retest of support at $0.55, with a potential further downside toward $0.50 if market sentiment deteriorates.

In summary, while XRP’s recent performance is promising, it faces a crucial test at the $0.61 level. A break above could signal further gains, but investors should be cautious of a possible pullback if this resistance holds firm.

Shiba Inu at a Crossroads: 50% Drop or 1,197% Rally Possible

0

Shiba Inu (SHIB) continues to navigate a challenging market environment this August. Recent technical analysis suggests that the meme coin could face further downside if current trends persist.

In a recent update, analyst Cryptorphic highlighted key support and resistance levels that could determine SHIB’s price action in the near future.

Shiba Inu Price prediction 16 8 24
Shiba Inu Price prediction, Image Source: Trading View

Shiba Inu Key Support and Resistance Levels

Notably, the analysis took a comprehesve observation of SHIB on the weekly timeframe. It found that the asset hovers between a critical support level at $0.000006836 and a primary resistance level at $0.00001799 as Shiba Inu is trading at approximately $0.000013401.

Notably, the price has been following a downward-sloping resistance trendline, which currently intersects around $0.000025. This trendline has consistently capped Shiba Inu’s attempts at recovery, keeping the asset in a prolonged downtrend.

Furthermore, the analyst observed that Shiba Inu’s Relative Strength Index (RSI) is nearing the oversold zone. While this could indicate that SHIB is undervalued and might see a price bounce, the overall market conditions suggest caution, according to the analyst. 

A move below the more immediate support at $0.00001073 could see SHIB testing lower levels. In a separate analysis, another market watcher noted that Shiba Inu could find support around the $0.000008 region, which, if breached, could imply SHIB is headed toward the $0.000006836 mark. 

For context, this price level would mark a considerable 50% drop from Shiba Inu’s current value.

Shiba Inu Can Still Rally 1,197% to ATH

However, Cryptorphic’s analysis also points out the potential for a market reversal. He noted that a quick market shift could alter the current bearish outlook, though he noted this still requires confirmation.

Nonetheless, if bullish momentum returns, SHIB could break through the resistance levels, with an ambitious target near its previous all-time high of $0.000088640. More immediate resistance levels are noted at $0.000023 and $0.000025.

Remarkably, Cryptorphic expects Shiba Inu’s market sentiment to completely reverse if the bears drive SHIB to the $0.000006836 support level. He foresees a massive wave driving a strong 1,197% rally to the ATH level in such a scenario.

From $2,518 to $166,000: Eight Top Ethereum Future Price Predictions Explored

0

While Ethereum grapples with maintaining crucial support levels around $2,500, prominent entities have issued daring projections for ETH, targeting up to $166,000

Today, Ethereum revisited the $2,518 low, adding to the broader bearish trend that has persisted. Data show a significant drop of 24% over the past month, indicating negative momentum in the higher timeframes.

At its current value, Ethereum is far from the key resistance at $2,670, a critical level that would need to be breached for this downward trend to shift. Despite this, several experts suggest there could be an upside.

Price Predictions for Ethereum

Amid the current market challenges, a recent CoinGecko study offers a more optimistic view of Ethereum’s long-term prospects. The study examines eight predictions from several reputable industry voices, including Ark Invest, Changelly, VanEck, and others. All eight sources forecast a rise in ETH’s value, with estimates ranging from $4,400 to $166,000.

Ethereum price prediction 16 8 24
Ethereum price prediction, Image Source @coingecko.

Among the predictions, the lowest estimate targets $4,443.63 by 2025. On the other hand, Cathie Wood of Ark Invest anticipates a much higher value, predicting ETH could reach $166,000 by 2032. While most analysts foresee an increase, only two sources—VanEck and Cathie Wood—expect ETH to cross into six-digit territory. 

VanEck projects a potential rise to $154,000. Importantly, shorter-term predictions, including those from QCP Capital, Bernstein, and Standard Chartered, suggest a more modest rise to between $6,000 and $8,000 within the year. On the other hand, crypto exchange Changelly thinks Ethereum will climb to $5,094 by 2025, while Digital Coin Price puts their odds at $7,528 by 2025.

Potential Drivers for Surge

Per CoinGecko’s study, several factors could play a role in determining Ethereum’s trajectory in the months ahead. The transition from proof of work to proof of stake, completed in September 2022, continues to influence the network. Staking requirements have notably reduced decentralization potential, raising concerns about transaction censorship. However, PoS also enables Ethereum to scale, with Layer 2 networks driving higher transaction volumes and reduced fees.

Ethereum currently processes twice the daily transactions of Bitcoin. As Ethereum’s 2.0 roadmap introduces sharding, the network could achieve 100,000 transactions per second. This improvement, combined with Ethereum’s unique position as a prime platform for Layer 2 projects, enhances its attractiveness to investors.

The latest developments, such as Grayscale’s introduction of new cryptocurrency trusts for SUI, TAO, and MKR, further highlight the growing institutional interest in crypto assets.

This development fueled hopes of increased institutional adoption, notably lifting Ethereum’s price by 30% between August 5 and August 10. Despite this optimism, Ethereum’s price experienced fluctuations, notably declining 6% on August 14 after U.S. CPI data led to market volatility.

New Whale Amasses 397 Billion Shiba Inu Amid Bearish Market

0

Shiba Inu (SHIB) continues to capture attention even in a bearish environment for meme coins. 

Recent data reveals that a single wallet has accumulated an impressive 397.845 billion SHIB tokens last week. Valued at approximately $5.35 million, this acquisition highlights strategic interest in Shiba Inu despite market challenges.

However, this wallet has also experienced losses amounting to $23.87k, likely due to SHIB’s price fluctuations. This address has not engaged in any transactions beyond the SHIB accumulation, currently holding only Shiba Inu tokens.

Screenshot 77
Wallet holdings / Arkham

It is important to note that during this press, Shiba Inu was changing hands at $0.0000134. This represents a decline in all timeframes, particularly 30% in the past 30 days.

Volatile Profit and Loss Trends

The wallet’s profit and loss figures reflect significant volatility. Early on, its cumulative P&L remained stable, showing minimal variation. However, losses on August 12 caused a steep decline, which was partially reversed by a recovery the following day. 

Arkham Intelligence
Arkham Intelligence

Subsequently, August 15 and 16 saw further declines in value, though not as severe as the August 12 drop. 

Significant Inflows and Wallet Activity

During this period, other major wallets also experienced significant inflows of Shiba Inu tokens. Coinbase’s hot wallet saw an influx of 725.79 billion SHIB, valued at $10.01 million, while Binance’s hot wallet received 686.23 billion SHIB, worth $9.59 million. 

In addition to the recent accumulation, other notable whale transactions have occurred in the Shiba Inu market. On May 31, Lookonchain identified a whale who withdrew 58.08 billion SHIB tokens from Binance. Around the same time, another whale transferred 445.87 billion SHIB tokens from Robinhood to a private wallet.

A separate report confirmed that Shiba Inu whales and sharks recently increased their balances, adding over 4.35 trillion SHIB tokens between March and mid-May, according to Santiment. Moreover, on May 2, an anonymous wallet withdrew 1.75 trillion SHIB tokens from Robinhood, continuing an accumulation streak amid a price dip.

Distribution of Shiba Inu Holdings

Elsewhere, looking at the distribution of Shiba Inu holders, as of August 12, Shiba Inu had 1.36 million addresses holding the token, with prices fluctuating around $0.000014. Small retail investors have shown increased interest, with the number of addresses holding between 0 to 1 million SHIB growing by 1.58% over the past 30 days. 

Screenshot 78
Holders Distribution | IntoTheBlock

Larger holders, particularly those with over 100 billion SHIB, have remained relatively stable in their positions, reflecting confidence among whale wallets. However, mid-tier investors have reduced their positions slightly.


Analyst Says XRP Risk-Reward Ratio is “Insane,” Sees $100+ Target

0

Market analyst Moonshilla believes the risk-reward ratio for XRP is “insanely” good, suggesting the token could be on the verge of a massive rally. 

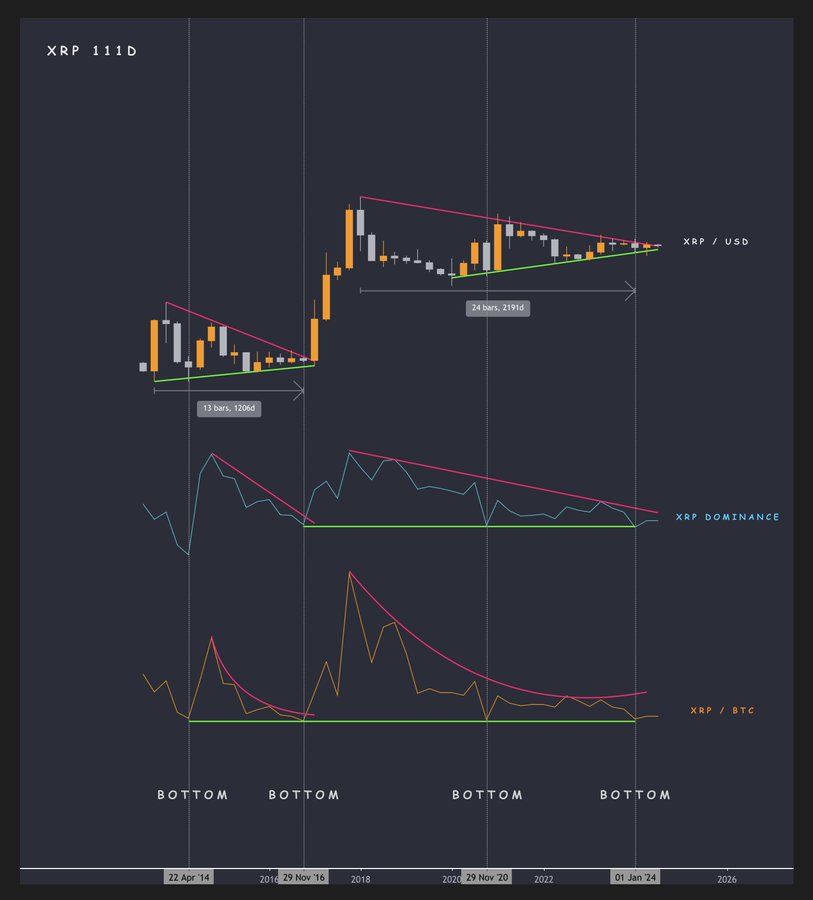
The market watcher presented three different charts to confirm his thesis. According to him, the XRPUSD, XRP Market Dominance and XRPBTC charts all suggest that XRP is in a favorable position marketwise. 

Image

XRPUSD Consolidation

The XRP/USD chart shows a consolidation phase. Moonshilla pointed out that this consolidation period has almost doubled compared to the previous one seen between 2014 and 2016. 

The chart reveals a symmetrical triangle pattern, which has been developing for 2,191 days. This pattern often leads to a strong breakout. In this case, XRP is close to the apex of the triangle, signaling that a breakout is imminent. 

The last similar pattern, which lasted 1,206 days, led to a massive surge in XRP’s value. If history repeats itself, the current setup could result in another explosive move upward.

XRP Dominance Triple Bottom Formation 

The XRP dominance chart further bolsters this bullish outlook. The chart shows a triple bottom formation, a classic bullish reversal pattern. This pattern occurs when an asset’s price hits the same support level three times without breaking below it. 

The pattern on the dominance chart suggests that XRP has found a strong support level and is now poised to regain market share. A declining trendline above the chart indicates that this period of underperformance might be ending, potentially leading to a significant increase in XRP’s market dominance.

XRP/BTC Shows Quadruple Bottom and Reversal Potential

Meanwhile, the XRP/BTC chart shows a quadruple bottom pattern, another bullish reversal indicator. 

This pattern, similar to the triple bottom, indicates strong support at a particular price level. Notably, XRP has found support against Bitcoin four times, suggesting that the downside is limited, and a reversal is likely.

The chart also features a downward-sloping trendline, which XRP looks ready to challenge. If XRP can break through this trendline, it could signal the start of a new uptrend against Bitcoin.

XRP Poised for an Imminent Run

When these three charts are viewed together, they point to a massive rally in XRP. Moonshilla emphasized that trading is all about balancing risk and reward, and in this case, the potential reward far outweighs the risk.

The analyst drew parallels between the current market conditions and those seen in 2014-2016, a period that preceded a 50,000% increase in XRP’s value within 333 days. 

He acknowledged that it may be hard for investors to believe in such a rally, especially given XRP’s recent performance. However, the historical context and current technical setup suggest that XRP could surprise the market once again.

XRP Boasts “Insane” Risk-Reward Ratio 

Moonshilla also makes a broader case for XRP as a long-term investment. The analyst argues that XRP’s longevity—having been around for over 11 years—sets it apart from other assets, particularly the meme coins that have come and gone in a matter of days or hours. 

He asked investors to secure a position in XRP, even if it’s a small one. The analyst suggests that the risk-reward ratio is too favorable to ignore, especially given the potential for a massive upside. 

He believes that XRP could be the “true ticket to financial freedom.” When asked about his possible target for the future, Moonshilla noted that he imagines a price above $100. This would represent a minimum of 17,477% increase from XRP’s current price of $0.5689.

NEIRO Price Prediction: Consolidation Range Expands, puts Bullish Positions at Risk

As the bullish trend in NEIRO struggles to surpass $0.30, the bearish activity tests the $0.18 strength. The ongoing brawl extends the lateral trend in the meme coin. At the crossroads of consolidation, will NEIRO take a bullish exit?

With a market cap of $202.66M, NEIRO moves in a sideways shift despite the increased market volatility. Furthermore, with the meme coins segment indecisive about the upcoming phase, the NEIRO consolidation will likely be prolonged. Will bulls hold the position longer, or is there a downfall coming for NEIRO?

Buyers Struggle For An Upcycle 

Following the bullish breakout of a flag pattern in the 4-hour chart, the NEIRO price jumped 168% within two days, from $0.10 to $0.28. However, the bullish momentum fails to sustain the uptrend in NEIRO, resulting in a sideways trend for the last nine days. 

POLONIEX:NEIROETHUSDT Chart Image by Trojan69420

The consolidation range extends from $0.18 to $0.30 horizontal levels. Furthermore, as per the trend-based Fibonacci level, the consolidation range is between the 0% baseline at $0.18 and the 50% Fibonacci level at $0.28. 

Currently, NEIRO trades near the 0.20 psychological mark as it witnesses a 5% drop in the past 4 hours. 

Nevertheless, the bullish crossover in the stochastic RSI signals a potential comeback within the consolidation range. This could retest the overhead resistance trendline or the 50% Fibonacci level. However, the MACD indicator in the 4-hour chart maintains a slightly bearish position as it threads laterally in the negative zone.

The credibility of the 23.60% Fibonacci level at $0.23159 is a bit debatable. This is due to its failure to uphold any significant price move apart from a failed bullish reversal on 9th August. 

Will NEIRO Achieve $0.50?

A bullish breakout of the consolidation range will result in a price jump to the 100% Fibonacci level at $0.38. Optimistically, the increased demand could result in a price surge to the 161.80% level, coinciding with the $0.50 psychological milestone. 

On the downside, the support levels are at $0.10 and prior to that $0.15 could result in a minor recovery. 

Bitcoin Miner Marathon Digital Increases BTC Holdings With 4,144 BTC Acquisition

0

Marathon Digital’s second acquisition in less than a month takes its Bitcoin stash above 25,000 BTC.

Florida-based crypto miner Marathon Digital has announced an acquisition of 4,144 BTC ($249 million), taking its total Bitcoin stash to over 25,000 BTC. The miner noted that it made the new purchases between August 12 and 14 at an average rate of $59,500.

In a press release on Wednesday, Marathon (with ticker MARA) said it had acquired the 4,144 BTC from funds realized in a convertible senior note auction earlier in the month. The miner announced on August 12 that it was looking to raise $250 million to buy Bitcoin.

However, Marathon’s convertible senior notes sales saw preposterous demands. The miner raised $300 million ($292.5 million after purchaser’s deductions), about $50 million above its initial planned offerings.

With $249 million already spent on boosting its Bitcoin reserve, the firm noted it would use the remaining funds to “acquire additional Bitcoin and for general corporate purposes.”

Marathon’s periodical Bitcoin purchase is part of its “full HODL” strategy, as its CEO, Fred Thiel, stated in July after acquiring $100 million worth of Bitcoin. The Florida-based miner adopted keeping the largest crypto asset as a strategic reserve asset, mimicking MicroStrategy’s disposition.

Has Marathon Acquired More?

On-chain data from Lookonchian points to a possible fresh Bitcoin acquisition from Marathon on Friday. The analytical firm spotlighted multiple transactions which saw MARA’s wallet receive 3,869 BTC ($227.9 million) from Galaxy Digital, Falcon X, and New York Digital Investment Group (NYDIG).

Marathon received 1,095.76 BTC from Galaxy Digital, 2600 BTC from FalconX, and 199.99 BTC from NYDIG in the past two days. If it was a fresh buy, the crypto miner would have spent more than the funds realized from the convertible senior note sales on Bitcoin purchases.

At press time, MARA is up 2% and is trading at $15.46. However, the stock is down more than 5% in the past five days. Meanwhile, Bitcoin changes hands at $58,600 amid a 1.83% increase this morning.