Home Blog Page 1311

Expert Targets $57 for MATIC by 2025 if Key Support Holds

0

The Polygon native token, MATIC, has recently experienced a sharp decline, losing almost 30% of its value within the last month. 

Notably, the token reached a local low of $0.30, a level recognized for its historical significance as a key support point. However, after this decline, MATIC showed signs of recovery last Monday, which has led analysts to predict the possibility of a significant rally in the near future.

Key MATIC Support at $0.30

Ali Martinez, a prominent analyst on X, highlighted the importance of the $0.30 support level. He pointed out that while MATIC could see substantial gains if the altcoin season begins, a weekly close below $0.30 would invalidate any bullish predictions.

Martinez’s analysis spans MATIC’s price action over several years, starting from 2021. During this period, MATIC experienced considerable volatility with notable peaks and troughs.

Screenshot 66
Ali Martinez price target

In the initial uptrend from 2021 to 2022, MATIC saw a strong rise, peaking above $2.3. However, from 2022 onwards, the token entered a corrective phase featuring lower highs and lows. This period was marked by a downward-sloping trendline, which MATIC has struggled to break. 

As of August 2024, the token’s price has recently touched the 0.618 Fibonacci retracement level. Following this period, Martinez’s chart suggests an aggressive price target of over $57.5188 by mid 2025, representing a potential increase of 15,169.31% from current levels. 

Other Analysts Concur

Notably, another analyst, Javon Marks, supports this bullish thesis. Marks predicts a potential climb to new all-time highs and above $3, representing a 558% increase from the local low. 

Screenshot 67
Javon Marks analysis chart

His analysis indicates a bullish continuation pattern, often identified as a flag or pennant formation, which could signal a significant rally if the price breaks out of its current consolidation phase.

Volume Indicators and Short-Term Outlook

Supporting the bullish outlook, volume indicators from Marks’ chart reveal a significant historical pattern. Notably, the volume has hit its support line before surging, suggesting that market participants have been accumulating MATIC during these low-volume periods. 

Further analysis from The Crypto Basic indicates that Polygon may be forming a morning star pattern, a bullish reversal signal, from the crucial support level at $0.38. Currently, Polygon trades at $0.409, showing a 1.24% price increase at the start of the week.

This development suggests that if the broader market remains stable or recovers, MATIC could see further gains, potentially reclaiming the $0.50 mark.


Ripple Signs New Partnership to Promote XRPL Use in Web3

0

Famous XRP community figure “Crypto Eri” calls attention to a recent strategic partnership from Ripple to foster the use of the XRP Ledger (XRPL) in the Web3 community. 

According to an announcement today, SBI Digital Community, a subsidiary of SBI Holdings, has entered into a strategic alliance with Ripple. Under the partnership, SBI Digital Community will promote the use of XRPL in the Web3 sector, potentially increasing its users.  

In particular, SBI Digital Community’s Web3 platform Bto3 will expand the use of XRPL, especially supporting the issuance of non-fungible tokens (NFTs) on the leading blockchain. 

SBI Digital Community to Launch NFT Via XRPL  

Per the announcement, SBI Digital Community will leverage xrp.cafe’s infrastructure to issue the NFTs. Interestingly, xrp.cafe confirmed the development in an X post today, emphasizing that SBI Digital Community will indeed utilize XRPL via its service. 

“Together, we aim to connect businesses, creators, and users in Japan with the XRPL,” xrp.cafe tweeted. 

For context, xrp.cafe is a leading NFT marketplace on XRPL. Data from Bithomp shows that xrp.cafe is currently the second-biggest NFT marketplace on XRPL, with a sales volume of $109,833 recorded over the past 30 days. The marketplace also boasts a record of 17,757 minted NFTs and unit sales of 3,865 within this timeframe. 

Based on xrp.cafe’s dominance within the XRPL ecosystem, SBI Digital Community chose to leverage its build to issue its NFT. Furthermore, the SBI Digital Community unveiled plans to reward both creators and contributors in XRP in the future. 

The development comes over a month after SBI Holdings, the parent company of SBI Digital Holdings, launched the EXPO2025 NFT on XRPL. 

Ripple Fosters NFT Creation on XRPL 

Meanwhile, Ripple has contributed immensely to the widespread adoption of the XRP Ledger. Besides sponsoring the development of the XRPL, Ripple has also launched important projects on the blockchain, including its stablecoin. 

Furthermore, Ripple has been attracting more creators to XRPL via its $250 million Creator Fund. Through the Creator Fund, Ripple provides financial and technical support for creators seeking to launch cutting-edge projects on XRPL. 

Shiba Inu Lead to Reveal Exciting Ecosystem Updates in His Speech at Futurist Conference

0

Shiba Inu lead developer Shytoshi Kusama hints at the disclosure of exciting updates during his upcoming speech at the Blockchain Futurist Conference.

Shytoshi Kusama, the lead developer of the Shiba Inu ecosystem, recently announced on X his excitement to speak at the upcoming Blockchain Futurist Conference. 

Shiba Inu Lead’s Speech at Blockchain Futurist Conference 

The event, set to take place from August 13-14, 2024, at the Rebel Entertainment Complex in Toronto, is generating considerable buzz within the Shiba Inu community. 

Kusama hinted at major updates to the decentralized Shiba Inu ecosystem that will be unveiled during his speech. His mention of being moved to tears by the content he will present has only heightened anticipation.

In May, the organizers of the event unveiled Shiba Inu as a prominent title sponsor of the Blockchain Futurist Conference, reflecting its growing influence in the cryptocurrency and blockchain space. Recall that Shiba Inu also sponsored the event last year.

The conference is Canada’s biggest Web3 event, attracting more than 6,500 attendees, including leading voices and brands in the industry. As a result, Shiba Inu’s involvement as a sponsor will help with the project’s commitment to expanding its reach and influence within the blockchain community.

The conference will feature multiple speakers, with Shytoshi Kusama among the key figures set to share insights. This event is particularly notable for Shiba Inu as it provides a platform to showcase new developments, including those related to Shibarium, their Layer 2 solution. 

Significance of the Event

The conference will include three stages, expo booths, private cabanas, and numerous networking opportunities. It will run alongside the ETHToronto and ETHWomen hackathons, which focus on developer-centric projects, adding another layer of excitement for participants.

As anticipation builds, some community members are speculating whether Kusama will maintain his tradition of appearing in a mask, a signature move that has become a point of intrigue. 

Kusama previously discussed plans to reveal himself but has since been making it to public spaces with a mask. Earlier this month, the Shiba Inu lead simply remarked “Mask off” in an X post. This disclosure triggered speculation among proponents.

The expectation of a possible twist, coupled with the promise of significant ecosystem updates, ensures that Kusama’s appearance will be one of the most closely watched moments of the conference. It bears mentioning that the Shibarium launch was revealed in last year’s Blockchain Futurist Conference.

Bitcoin Price Targets $68K Amid Triangle Squeeze

A Bitcoin triangle formation on the 1-hour chart teases a bull cycle with a breakout run potential. Will this result in a 17% surge to the $68K level? 

Bitcoin’s growing volatility in a strictly sideways lane over the last few days seems to have hit an end. With growing underlying demand, the indicators and derivatives market anticipate a bullish outburst will come shortly. 

Will this Bitcoin breakout run result in a massive surge beyond $65K? Let’s find out. 

Bitcoin’s Changing Dynamics in 1-hour Chart

In the one-hour chart, Bitcoin shows a consolidation move after a price jump to the $61,000 mark. The sideways continuation leads to the formation of two converging trend lines that form a triangle pattern. 

Bitcoin is resting at the support trendline and has formed a streak of four bearish candles that accounts for a price drop of 1.30%. However, in the last hour, Bitcoin has recovered 0.20% and is trading at $58,812.

As Bitcoin takes support at the trendline, the chances of a bullish reversal are increasing. Based on the trend-based Fibonacci level, retraced over the recovery rally last week from $49,700 to a peak of $57,470, Bitcoin is taking support at the 50% Fibonacci level at $58,676.

Bitcoin price chart
Bitcoin price chart

Furthermore, the one-hour RSI line shows a lateral movement near the halfway line slightly below it. 

Even the Bollinger bands on the 1-hour timeframe converge, reflecting an increase in tension. Thus, the chances of a sharp move in Bitcoin are increasing. 

However, since the consolidation started near the support trend line, the RSI line has revealed a bullish divergence. This increases the possibility of an uptrend continuation and an overhead trend line breakout.

Will Bitcoin’s Breakout Surpass $63K Resistance?

A bullish breakout of the overhead trend line will challenge the 78.60% Fibonacci level at $61,095. In doing so, Bitcoin will reclaim the psychological mark of $60,000. With the additional momentum, the Bitcoin price will likely continue to rally and challenge the peak of $62,970, the 100% Fibonacci level. 

Following the breakout, a minor retracement for a retest is possible. The retest can find support at two levels: the 78.60% Fibonacci level at $61,095 or the broken trendline closer to the $60,000 psychological mark. 

A post-retest bull run will be the perfect buying opportunity for the sideline traders.  The uptrend is likely to surpass $63,000, and a clear path is visible to the $68,713, the 161.80% Fibonacci level. 

Derivatives Shift to Bullish Side

Bitcoin Derivatives Data

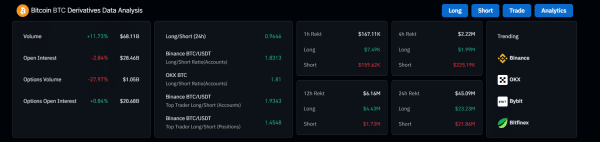
According to recent data from CoinGlass, $159.62K worth of Bitcoin short positions were liquidated in the last hour. In contrast to the $7.49K worth of long liquidation in Bitcoin, liquidation data reveals a stronger bullish side. Hence, the changing dynamics in the derivatives market bolster the possibility of a bullish breakout in Bitcoin.

Shiba Inu Targets 116% Rise as Indicators Confirm Bullish Momentum

0

Recent analyses suggest a potential price recovery for Shiba Inu (SHIB) as it navigates crucial support and resistance levels and strives to get over its monthly lows.

According to MMBTtrader, an analyst on TradingView, Shiba Inu might be gearing up for a significant upward movement. Amid ranging and falling prices for Shiba Inu, the analyst presented a chart highlighting strong daily support around the $0.00001 level. Another support level lies lower, slightly above the $0.000005 region. The identified support zones are considered strong, and the possibility of a pump from these levels is highlighted. 

Screenshot 64
Source: TradingView

Furthermore, MMBTtrader’s analysis highlighted resistance zones between $0.00002 and $0.00005, which could challenge the price ascent. However, the analyst remains optimistic about a potential 116.92% increase, targeting a price of around $0.00003 for SHIB in the short term.

Shiba Inu Bullish Momentum Confirmed 

Adding weight to this bullish outlook, another analyst, Maks Klimenko, has observed a reversal pattern following a sweep of key lows around the $0.00001333 mark. Additionally, the MACD indicator on the daily timeframe supports this view, showing a bullish divergence as the histogram turns positive and the MACD line crosses above the signal line. 

Screenshot 65
Source: TradingView

This momentum shift suggests that bearish forces are weakening, and bulls are beginning to dominate. The target level for this move is identified at approximately $0.00002024, further reinforcing the potential for a price increase.

Essentially, the MACD’s bullish signals align with MMBTtrader’s analysis, indicating a possible upward trend in the near future for Shiba Inu.

Potential Trend Reversal?

According to The Crypto Basic, a higher low pattern has emerged on the Shiba Inu chart, signaling a potential trend reversal. This pattern indicates growing buying interest, suggesting that the selling pressure is diminishing. Currently trading near the 50-day EMA, SHIB’s next move could be crucial. Holding above this level may trigger a price surge, while falling below could lead to further declines. 

Recent developments in the Shiba Inu ecosystem also hint at a positive trend reversal. The increased adoption by platforms like NowPayments further enhance SHIB’s position within the crypto ecosystem, possibly contributing to the anticipated price recovery.

During this writing, SHIB traded at $0.00001363, dropping over 2% from its daily high and 14% from its weekly high.

Arthur Hayes Predicts Altcoins to Rebound only if Bitcoin breaks $70,000 and Ethereum $4,000

0

American Entrepreneur and crypto enthusiast Arthur Hayes gives his technical conditions for a rebound of the Altcoins while predicting cryptocurrencies to break out of bearish trajectory from September.

Arthur Hayes, an American entrepreneur and former CEO of cryptocurrency exchange Bitmex, has revealed his opinions on the general performance of Altcoins and what he thinks is necessary for the Altcoins to rebound.

Arthur Hayes revealed his analysis in an article written on Substack, explaining the correlation between Bitcoin, Ethereum, and Solana price levels and the general performance of Altcoins. 

Hayes explained that Altcoins will rebound only if Bitcoin and Ethereum break through $70,000 and $4,000, respectively. He also expects Solana to climb to over $250. 

He further explained the correlation between a Bitcoin and Ether rally to the performance of altcoins saying a rally by the two biggest crypto assets by market capitalization will definitely lead to a rebound of the Altcoins. 

“The combination of a surge in dollar liquidity driving the rally of Bitcoin and Ether towards the end of the year will set the stage for the resurgence of a volatile altcoin event,” Hayes expressed.

According to Hayes, Bitcoin, and Ethereum were able to perform a lot better than other Altcoins in the long run because they both now have structural bids in the form of Net inflow into US-listed Exchange Traded Funds (ETF). 

He explained that the ETFs by the two biggest crypto assets helped them escape the meltdown witnessed in the altcoin markets. Bitcoin ETFs were launched in the US in January, while Ethereum ETFs came much later in July. 

US Elections very Uncertain

Hayes, in his write-up, explained his trading strategy for the United States Election cycle, which he described as a coin toss. He also expects the crypto market to exit its sideways to downward trajectory by September. 

The United States presidential elections are slated for November this year, and Hayes believes there is no better time for liquidity. He explained his strategy for the election cycle, which involves not liquidating his portfolio and taking profits from his speculative momentum trades. 

“The outcome of the election seems uncertain, akin to a coin toss. Personally, I’d prefer to observe the ensuing chaos from the sidelines and re-enter the markets once the US debt ceiling has been raised. I anticipate this occurring around January or February,” Hayes remarked.

As regards the outcome of the election, Hayes recognized the momentum the Trump campaign train gained after his attempted assassination. He believes the stepping down of Joe Biden and his replacement with Kamala Harris could really dent Trump’s chances come November. 

Bitcoin at $1 million is the best case

Hayes double-downed on his prediction of Bitcoin hitting $1 million in a best-case scenario.

He believes that once the issue of the US debt ceiling is taken care of, Liquidity will pump from the Treasury and possibly the Feds to get the market back on track.

Only then will the Bull market season kick in fully with a possibility of Bitcoin hitting $1 million in a best-case scenario.

Ethereum Outperforms Major Assets as Its Spot ETF Sees $4.9M Inflow

0

The Ethereum spot ETF saw a net inflow of $4.9 million, its first inflow in the last four trading days.

The second-largest crypto asset, Ethereum, outperformed major assets like Bitcoin and Solana on Tuesday, posting a 24-hour gain of 3%. The asset’s daily surge followed a net inflow from its US spot exchange-traded fund (ETF) on Monday.

Data from Sosovalue showed that the US Ethereum spot ETF saw a single-day net inflow of $4.9 million on Monday. Notably, the positive flow was the product’s first in the last four trading days.

Preceding Monday’s net inflow was a three-consecutive outflow day, during which the Ethereum product shaded $42.26 million in assets. This saw Ethereum’s price struggle to impress in those days.

Slight Inflows

Fidelity Ethereum Fund (FETH) led inflow yesterday, posting a single-day net positive flow of $3.98 million. The issuer has had a net outflow from its fund just once since the launch of the ETF on July 23. FETH now has a cumulative net inflow of $345.69 million, the second-best among the nine listed funds.

Bitwise Ethereum Fund (ETHW) saw a net inflow of $2.89 million after recording zero flow on Friday. Franklin Ethereum ETF (EZET) recorded a positive flow of $1.01 million, rebounding from a two-day streak of zero flows.

Every other issuer aside, the Vaneck Ethereum ETF (VETH) recorded zero flows on Monday, signaling a cautious play among investors. VETH saw a single-day net outflow of $2.92 million, its first outflow since the ETF’s launch.

Ethereum
Ethereum

Has Grayscale’s Selling Pressure Ended?

A notable event on Monday’s Ether ETF trading session was the lack of outflow from the Grayscale Ethereum Trust (ETHE). The issuer has been the major source of outflows for the Ethereum product, with a total of $2.29 billion leaving the fund since July 23.

Before the zero flow, data showed a trend of dwindling selling pressure from ETHE, with lesser outflows seen from the fund daily. This turnaround signals a shift in sentiment from selling to holding among the fund’s investors.

Ethereum traded at $2,639 at press time, with a market cap of $317.5 billion. At the time of writing, the asset’s 24-hour trading volume was up 33.8% to $21.32 billion.

Cardano Faces Challenges Attracting New Users Despite Biggest Upgrade in History

0

The addresses holding Cardano (ADA) have stagnated around 4.45 million wallets for over a year despite the network set for its biggest technical advancement. 

Analytic platform IntoTheBlock confirmed this data in a recent update. The report highlighted that the Cardano ecosystem has seen a flattened progression in wallets holding ADA tokens since 2023.

The trajectory of Addresses Holding Cardano 

Notably, Cardano saw a consistent uptrend in ADA holders in the last bull cycle. This was due to Cardano being promoted as an alternative to the largest smart contract network, Ethereum. 

Accordingly, ADA-holding wallets quickly expanded from below the 1 million count in January 2021 to close to the 4 million threshold by September 2021. 

Remarkably, the growth in Cardano addresses was reflected in the token’s market value. Specifically, ADA rose steadily and reached an all-time high of $3.1 in September 2021.

Even as the value of ADA commenced a downtrend from the peak, the number of Cardano wallets kept growing, though at a reduced space. However, it has lost momentum for further expansion since breaking the 4.45 million level in 2023.

Cardano Active Addresses
Cardano Active Addresses | IntoTheBlock

During this period of stagnation, the Cardano development team has been preparing for the final phase of its roadmap, the Voltaire Era, which the Chang Hard Fork will introduce. This upgrade will effectively place the future development of Cardano in the hands of steadfast community members.

Why Cardano Faces Challenges Attracting New Users

However, despite the hype around the upgrade, the number of addresses holding Cardano has not increased significantly. In other words, Cardano has struggled to attract new users even as the blockchain is set to undergo what is expected to be the most significant change in its history.

IntoTheBlock observed that this trend is due to a shifting sentiment in the crypto scene, where market participants are gravitating toward blockchains like Solana and Base. Notably, these two platforms have become the outlets for launching meme coins, the leading narrative for this bull season.

Solana hosts billion-dollar-cap meme coins such as BONK and Dogwifhat (WIF), while Base is home to BRETT, which boasts a market cap of over $900 million. In contrast, Cardano’s meme coin, SNEK, has a market cap of only $54 million.

Yet, Cardano Processes $7.2B Daily. 

Meanwhile, IntoTheBlock noted that despite the recent slowdown in new user adoption, Cardano’s active user base and transaction count have remained steady over the last four months. 

The report also reveals that Cardano processes an impressive $7.2 billion daily on-chain transactions, outpacing many other networks. This results in a remarkably low NVT ratio of 2.62, which may suggest that ADA is undervalued.

Cardano transaction
Cardano transaction | IntoTheBlock

Furthermore, the percentage of ADA tokens held by long-term investors has reached an all-time high, as they hold nearly 40% of the total supply. Essentially, this figure demonstrates a substantial level of confidence from ADA holders.

Solana at Crossroads Finds Bullish Influence at $140, Eyes Breakout Run to $175

Solana’s bullish flag formation finds strong support at $140 as the short-term pullback makes buyers cautious. Will an upside move propel Solana to $200, or is a crash to $100 imminent?

Failing to maintain the bullish momentum, Solana continues its struggle to hold dominion over the crucial support of $150. Amid a surge in bearish sentiments in the crypto market as Bitcoin dips under $60K, Solana prepares to bounce back. Will the bullish powers lead to a price jump to $200?

Solana’s V-shaped Reversal Makes A Bullish Flag

Concluding a bearish patch between July 29 and August 5, the 42% dip drops Solana to $110 from $192. The V-shaped reversal tops $160 before taking another retest to $140 amid a quick bullish bounce.

Solana Price Chart
Solana Price Chart

The recent pullback phase completes a bullish flag pattern in the chart above with a declining trend and solid support at $140. Currently, Solana trades at $145.09 while facing opposition from all the crucial EMAs (20:red, 50:orange, 100:blue, and 200:violet). 

However, the average lines in the MACD indicator prepare for a crossover to regain positive alignment. Thus, the momentum indicator signals a potential reversal. 

Will Bulls Propel Solana to $200?

In the chart below, Solana’s quick reversal rally, accounting for a 33.22% jump, fails to surpass $160 and drops to $140 instead. Further, the pullback phase starts a bear run in the super-trend indicator, as shown in the chart below. 

Solana Price Chart
Solana Price Chart

Based on the Fibonacci levels, Solana consolidates between the 38.20% level at $141.41 and the 50% level at $151. A bullish breakout of $151 could find resistance at a 61.80% Fib level of $160 and a 78.60% Fib level of $174 before topping the $192 peak. 

A Counter Opinion for Solana

In a recent tweet, Ali Martinez mentioned the possibility of a head-and-shoulder with a neckline for $141.


However, the recent price movement reveals a bullish sustenance above the neckline. Nevertheless, a breakdown below $140 will nullify the bullish flag pattern.

In such a case, a bearish run could result in a retest of the 23.60% Fibonacci level at $129 or $110. 

USDT Volume on Tron Hits $1.25 Trillion in Q2 2024, One-Third of Visa’s Annual Volume

0

Recent data from Token Terminal reveals a significant milestone for the Tron blockchain, where the transfer volume of Tether (USDT) has grown remarkably.

This growth is a proof of Tron’s increasing relevance in the stablecoin market, particularly in comparison to traditional payment systems like Visa. As of Q2 2024, Tron’s USDT transfer volume has reached approximately one-third of Visa’s annual settlement volume, proving the expanding role of blockchain networks in global financial transactions.

Dramatic Growth Over Four Years

The growth trajectory of USDT transfer volume on Tron has been nothing short of extraordinary. Starting in Q2 2020, the transfer volume was recorded at $25.2 billion. Over the next four years, this figure escalated dramatically, reaching $1.25 trillion by Q2 2024. 

Screenshot 63
USDT Volume on Tron

Tron Vs. Visa in Annual Settlements

A key comparison between Tron’s USDT transfer volume and Visa’s annual settlement volume shows the scale of the blockchain’s growth. According to Visa’s CEO, Ryan McInerney, the payment giant processed $15 trillion in transactions during FY23. 

In comparison, Tron’s USDT volume in Q2 2024 alone has reached one-third of this amount. 

Stablecoin Transactions Across Networks

Further analysis from Dune Analytics highlights the growth in transaction count on Tron, which surged from approximately 3 million in early 2021 to over 15 million by August 2024. This increase also points to the widespread adoption of USDT on Tron, especially for larger payments exceeding $100,000. 

Screenshot 61

Meanwhile, on the BNB network, USDT transaction counts have risen even more sharply. However, unlike Tron, the majority of transactions on BNB are in the lower payment brackets, particularly those under $1,000. This contrast indicates that BNB is predominantly used for smaller, more frequent payments.