Home Blog Page 1325

Top Analyst Says Buy XRP, Go to the Beach, and Relax, As No Lower Lows Are Seen

Analyst Egrag advises crypto investors to stock up on XRP and relax at the beach, highlighting the absence of new lower lows amid market volatility.

In a recent post, pro-XRP analyst Egrag explored XRP’s pattern amid yesterday’s landslide dip in the crypto market. The analyst emphasized that XRP defended some of its earlier gains, avoiding a drop to the lower levels observed in July.

But XRP and Head to beach
Image Source: https://x.com/egragcrypto/status/1820445171344978055

Notably, during the market downturn in July, XRP crashed to around $0.38, a price point last seen over a year ago. The reason for XRP retesting $0.38 was Bitcoin’s fall to the $53K price range, triggered by the German government’s dump of $3 billion in Bitcoin in July.

XRP was significantly impacted, and its reaction was exacerbated by widespread apprehension about its performance prior to the landslide fall. However, before the month ended, XRP staged a commendable comeback.

It quickly rallied to a four-month high above $0.65 in less than two weeks. XRP defended the $0.6 level into August before the onset of another bearish momentum.

XRP Shows Greater Resilience Amid Massive Dump

This time, the selling pressure in the crypto market was so massive that Bitcoin relinquished multiple support levels and broke back into the $49K region for the first time since February, following a 19% drop. 

Altcoins like Cardano, Ethereum, and Solana experienced even more pronounced declines. Meanwhile, XRP crashed from an intraday high of $0.5253 to $0.4335. This was the lowest value XRP reached yesterday before its recovery began. 

Essentially, despite the shocking dump that wiped out over $1 billion from leveraged traders, XRP did not set a lower low yesterday.

On the other hand, Cardano hit $0.2799, a significantly lower bottom compared to the initial yearly low of $0.321 set on July 5. Similarly, Solana crashed to $110.61 yesterday, establishing a new bottom from last month’s $121 level.

Given the resilience XRP exhibited compared to other rival altcoins, analyst Egrag humorously advised crypto market participants to amass more XRP tokens and relax at the beach. 

Notably, XRP set an intraday high at $0.5185 at press time and is defending its gains above $0.5.

One commenter responded to Egrag’s update by saying that the current market fluctuations are nothing to worry about in the grand scheme of things. He cautioned that the recent price bounce might be temporary. However, the commenter suggested that buying XRP now and holding it for the long term could be a profitable strategy regardless.

Notably, Egrag is among the most ambitious XRP analysts, expecting XRP to become much more valuable in the coming weeks. In various analyses, he has charted the paths XRP could follow to reach higher price points beyond the $10 range.

How Many Millions of Shiba Inu Can You Buy with $1,000, $5,000, and $10,000 as Prices Dip to $0.00001

As Shiba Inu continues to hover around the lower thresholds of the $0.00001 range, the market presents an opportunity for investors to procure more tokens at a discount.

Yesterday was a challenging day for seasoned Shiba Inu holders, as SHIB touched a new bottom since attaining a yearly high in March. In particular, Shiba Inu hit $0.00001087 on August 5, dangerously close to losing a leading zero.

While this performance caused holders significant angst, it represents a favorable entry point for Shiba Inu admirers. This article examines the quantity of SHIB tokens new buyers could fetch with investments of $1,000, $5,000, and $10,000.

Shiba Inu You Can Buy with $1,000, $5,000, and $10,000

Notably, at press time, Shiba Inu has reclaimed most of the losses from yesterday’s fallout with a 15% rebound. At press time, SHIB hovers around $0.00001345, which is still a dip considering that the asset sold for $0.0000201 last month.

A $1,000 investment would fetch an investor 74.3 million SHIB tokens at its prevailing market value. However, if Shiba Inu sustains its ongoing bullish momentum to reclaim $0.00002, the $1,000 sum would amount to $1,486, representing around 50% short-term profit. 

Notably, a higher risk exposure of $5,000 in Shiba Inu would give one a portfolio of 371.75 million tokens. Similarly, a Shiba Inu rebound to the $0.00002 channel would elevate this $5,000 sum to $7,434.

Also, with $10,000, an investor would amass approximately 743.49 million Shiba Inu tokens. By the time SHIB recaptures $0.00002, this investment would have accrued an extra $4,869.

Meanwhile, Shiba Inu dip buyers stand to earn even more substantial returns when considering popular projections by analysts.

Shiba Inu Comeback Targets

Last week, analyst Kerschne identified a key support level Shiba Inu needs to maintain to confirm a rally to $0.000033. In another analysis, market watcher Javon Marks highlighted that Shiba Inu is due for a recovery to the $0.000045 yearly high. Marks projected that the comeback would spark a continuation to new price levels in the $0.00015 range.

At the $0.00015 hypothetical price, $1,000 invested in Shiba Inu today would be worth $11,152, while a $10,000 investment would amount to $111,524.

Overall, the prospect of earning substantial returns from Shiba Inu may be tantalizing to investors. However, it is essential to consider the potential impact of Bitcoin’s performance on Shiba Inu’s uptrend. Specifically, if Bitcoin exhibits more bearish volatility, it could delay Shiba Inu’s ascent.

Analyst Outlines What’s Next for XRP As XRP Slumps 85% from 6-Year Peak

0

XRP has witnessed a dramatic collapse of 85% from its all-time high, but market data suggests there may be chances of a recovery.

Market analyst Northstar first called attention to this bearish situation. Notably, XRP peaked beyond $3 in January 2018, following an impressive surge from the $0.005 low in February 2017.

The cryptocurrency has since plummeted by 85%, trading around $0.48 at the time of Northstar’s analysis. This massive decline has raised speculation about XRP’s future trajectory, but market data indicates that the crypto asset might still boast chances of a rebound.

Notably, a long-term symmetrical triangle, identified by Northstar on the two-week chart, shows XRP’s struggle since its peak. The chart shows multiple failed attempts to break above the triangle’s resistance, ultimately resulting in a breakdown below the support line at around $0.55. 

XRP 2-Week Chart Northstar
XRP 2W Chart | Northstar

This breakdown is critical, as it indicates an increase in the bearish momentum. The triangle’s measured move suggests a potential bearish target of $0.30 if the selloff momentum continues, marking a further decline of nearly 40% from current levels.

XRP Current Market Position

Meanwhile, on the weekly chart, a smaller XRP symmetrical triangle pattern, formed following the drop from $0.93 last July, recently saw a breakout. XRP breached the triangle’s upper trendline, reaching resistance at the middle Bollinger Band around $0.65. 

However, the recent market drop has led XRP to retest the upper trendline, now acting as support around $0.48. XRP needs to fiercely defend this support to hedge against any drop back into the symmetrical triangle.

XRP 1W Chart
XRP 1W Chart

Nonetheless, the Stochastic Momentum Index (SMI) shows a downward trajectory, indicating weakened buying pressure. If XRP fails to reclaim the $0.52 resistance, the next support levels are critical. 

Notably, the $0.4270 support, marked by the lower Bollinger Band, is a key level to watch. A breach below this could see XRP targeting $0.30, consistent with the descending triangle’s measured move.

Volatility and Market Activity

As market uncertainty prevails, data sourced by Santiment shows an interesting relationship between price volatility, active addresses, and XRP’s price. Notably, XRP experiences massive price movements, both upward and downward, during periods of increased volatility and active addresses. 

XRP Volatility and Active Addresses
XRP Volatility and Active Addresses | Santiment

For instance, major price spikes in late 2017 and early 2018 correspond with heightened volatility and active addresses exceeding 200K. Similarly, the price drop in mid-2021 following a rally to $1.96 aligns with spikes in these metrics.

Currently, active addresses hover around 25.9K, while volatility remains moderate. This scenario suggests the potential for upcoming price swings. If volatility increases with active addresses, as seen historically, XRP could experience significant movement from the current level.

What’s Next for XRP?

Given the current technical setup, XRP could face a challenging path ahead. The six-year symmetrical triangle breakdown on the 2-week chart and one-year symmetrical triangle retest on the 1-week chart suggest bearish continuation or potential consolidation.

Key levels to monitor include the $0.52 resistance and the $0.40 support. Failure to hold these levels could validate the bearish targets, with $0.30 being a critical risk for the downturn.

However, the momentum could shift. An increase in volatility and active addresses, as indicated by Santiment’s data, could lead to price swings. If buying pressure returns, reclaiming the $0.52 level could negate some bearish sentiment. In such a scenario, XRP might aim for higher resistance levels around $0.60 and $0.70.

Ethereum (ETH) Price Plunges 60% amid $279M Whale Sell-Off

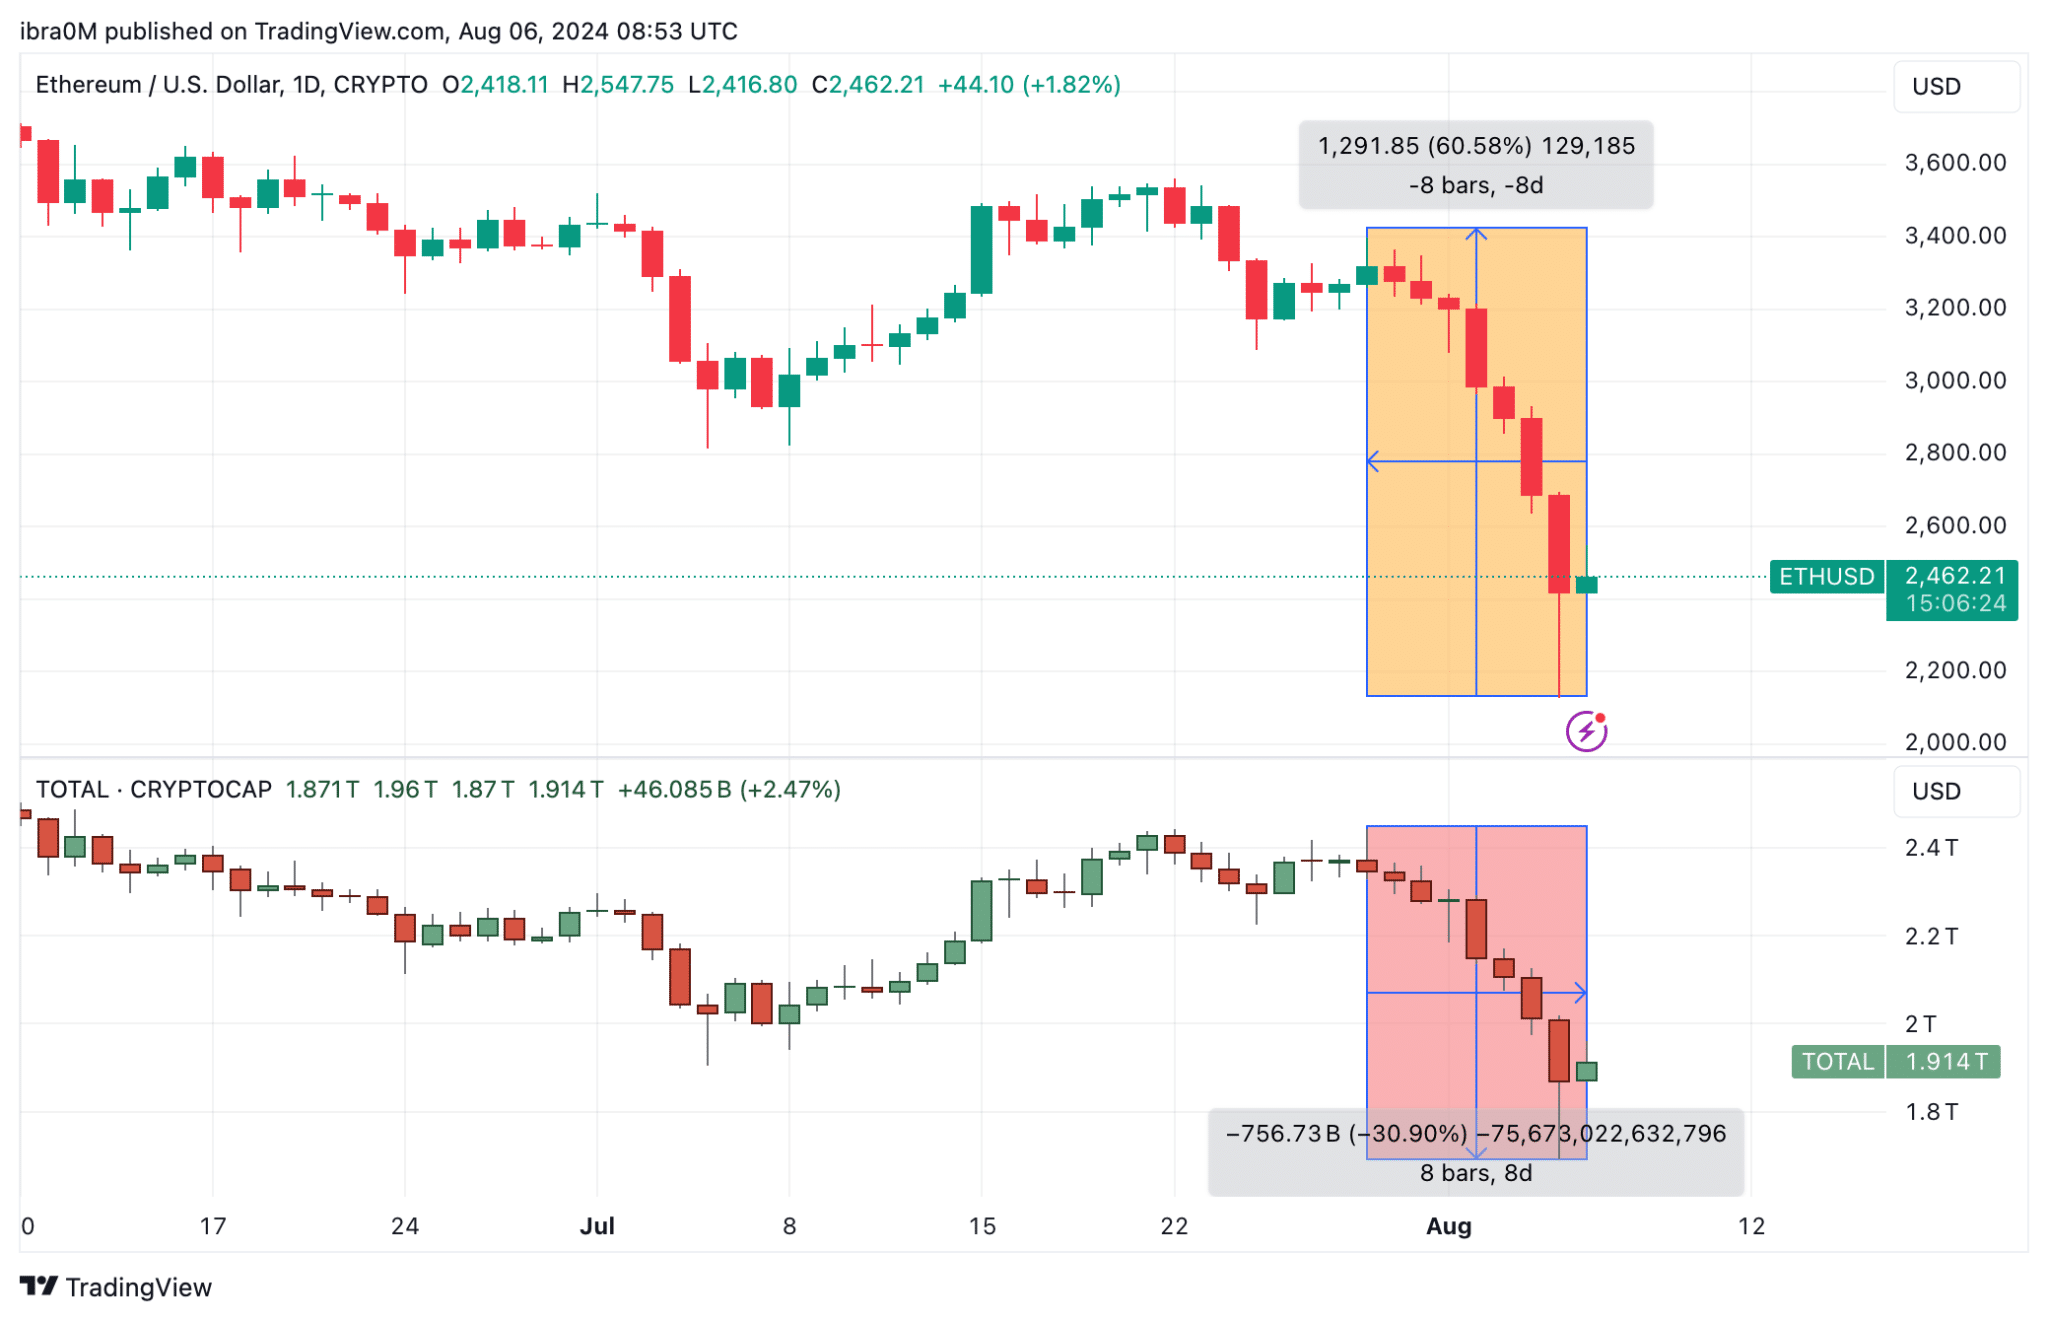
Ethereum price plunged to $2,127 on Aug 5, down by a staggering 61% within the 7-day timeframe, markets data suggests that a sell-off from Ethereum ETFs and major crypto trading firm had accelerate the ETH downswing.

Ethereum Price Sees New 2024 Low as JumpTrading Sells $277M ETH

On Monday, Aug 5, 2024, the cryptocurrency markets experienced a historic downturn attributed to several bearish catalysts.

The downtrend first began around August 2, when the US Bureau of Labor Statistics first published data on US Non-Farm Payroll (NFP) for July 2024. Based on that report, the US recorded a 114,000 surge in unemployment claims for July. This hawkish labor market report further exacerbated investors’ bearish sentiment after the US Fed announced a rate pause during the FOMC meeting held on July 31.

But curiously, market data shows that Ethereum price experienced losses significantly larger than its rival assets like Bitcoin and XRP. More so, when compared to the broader crypto market average ETH also performed abysmally below the industry average.

Ethereum Price Action (ETH/USD) | TradingView

Looking at the chart above we see that ETH price declined by 60.58% when it slid toward $2127, on Monday Aug 5. Meanwhile, in comparison, the global crypto market capitalization (TOTALCAP) only declined by 30.90%, as it shed $756 billion during the heat of the cascading liquidations.

When a major asset like Ethereum underperforms relative to the broader market trends, it signals the presence of a dominant internal bearish catalyst. Based on recent media reports, Ethereum’s dramatic 60% decline has been linked to massive sell-offs from whale investors.

Ethereum Whale Offloads $279M Amid Market Crash

While Ethereum ETFs recorded negative net flows last week, another major crypto trading firm, JumpCrypto, has also been spotted making a strategic ETH sell-off, further amplifying the bearish market liquidations.

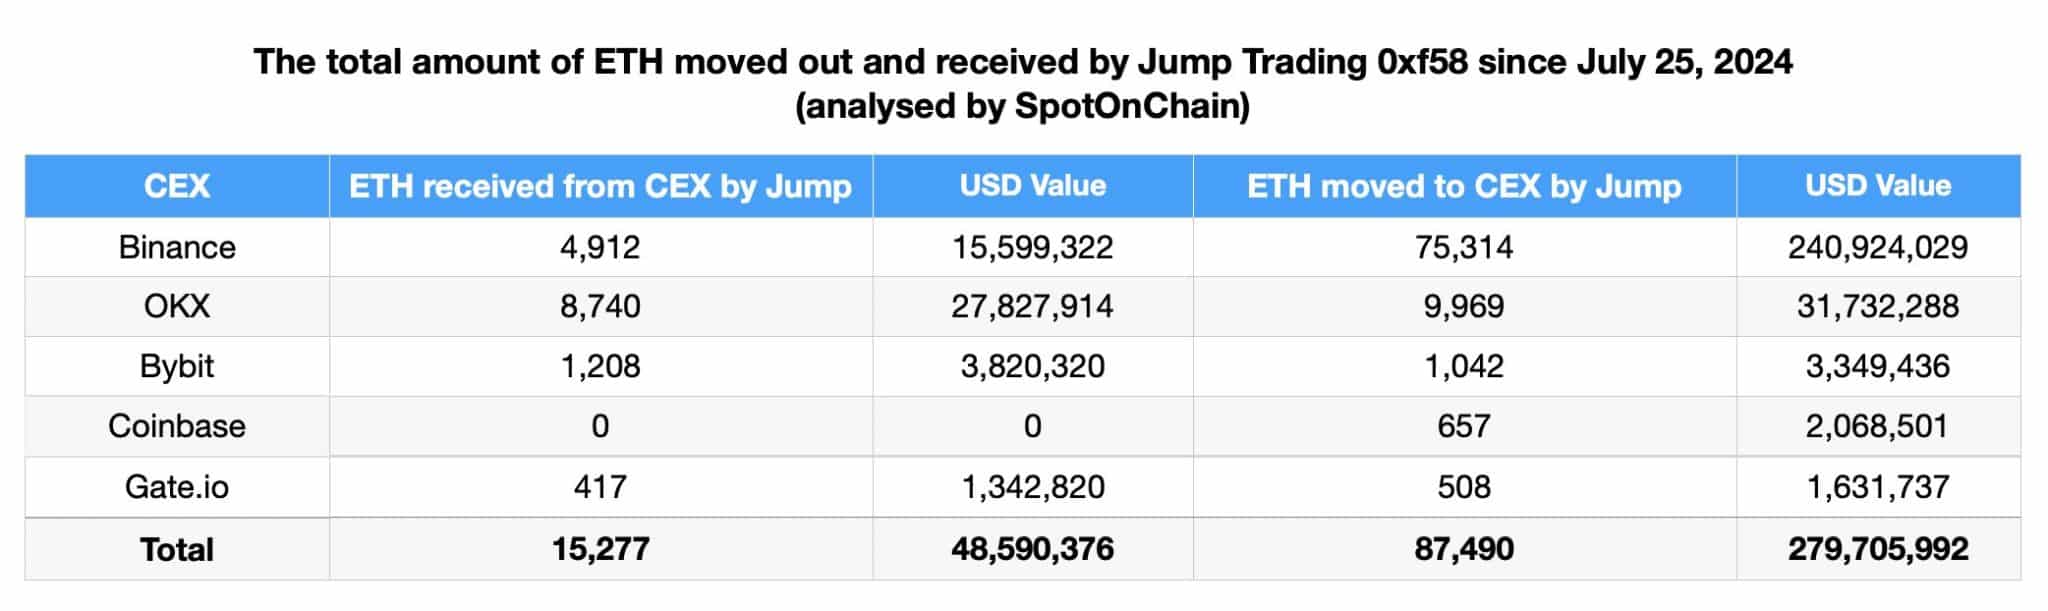
JumpCrypto Moves  Ethereum (ETH) Worth $279M into Exchanges
JumpCrypto Moves  Ethereum (ETH) Worth $279M into Exchanges.

Since July 25, Jump Trading has sold Ethereum coins worth $279.7 million. Jump Trading currently has approximately 37,600 wrapped staked Ether (wstETH), equivalent to $128 million, along with 21,000 Ether (ETH), amounting to $61.5 million in their wallet. Additionally, they have around 11,500 Lido-staked Ether (stETH) valued at $33.5 million in the process of being unstacked. These significant movements have added to the bearish sentiment, driving Ethereum’s price down significantly.

These key events played a critical role in ETH price downtrend on Monday, spooking retail investors and derivatives traders into closing out their ETH positions. This explains Ethereum price has experience much larger losses (60.58%) compared to rival assets like Bitcoin (30%) and XRP (26%) between Monday July 29 and Aug 5.

Ethereum price forecast: ETH Bulls Face Uphill Task Reclaiming $3,000

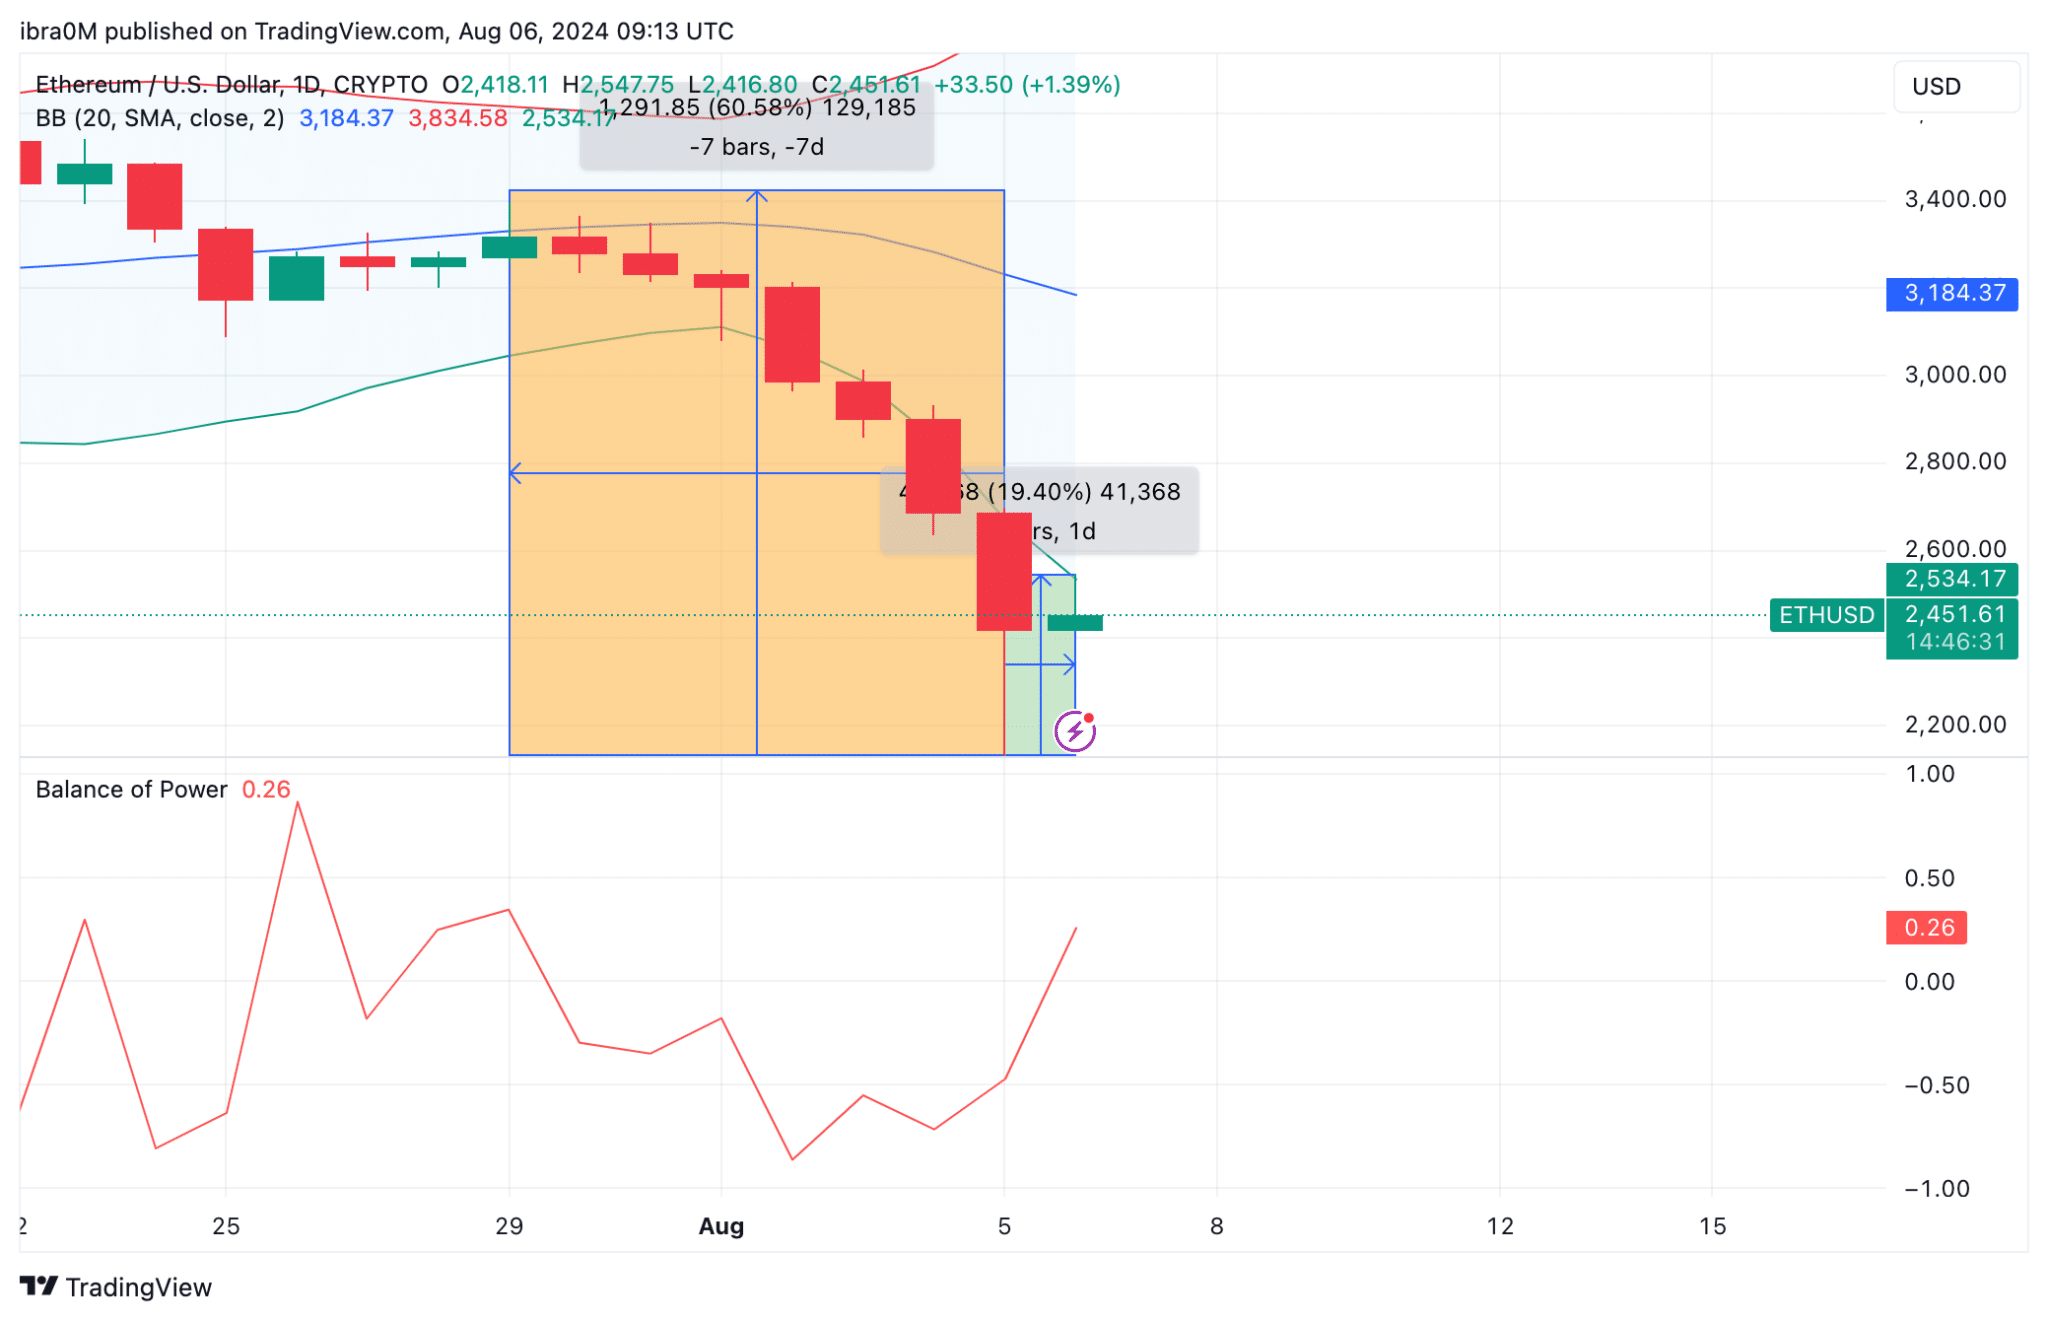
Ethereum price has rebounded above $2,400 at the time of writing on Aug 6, up 19% from historic lows recorded on Monday. Looking at key technical indicators, Ethereum’s price is now facing an uphill task of reclaiming the $3,000 level.

The Bollinger Bands on the daily chart show that ETH has experienced significant volatility, with the price recently dropping from over $3,100 to just above $2,400. This sharp decline indicates increased selling pressure, and although the current rebound is encouraging, it might not be strong enough to push ETH back above $3,000 in the short term.

Ethereum Price Forecast | TradingView

The Balance of Power (BoP) indicator is currently at 0.26, suggesting that sellers still hold the upper hand. This indicator needs to show a stronger positive value for bulls to gain confidence. Additionally, the resistance level at $2,534.17, which aligns with the upper boundary of the recent downtrend channel, must be convincingly breached for any sustainable upward momentum.

In conclusion, while Ethereum’s recent rebound provides a glimmer of hope, the road to reclaiming the $3,000 mark remains challenging. Bulls need to overcome several resistance levels and shift the market’s balance of power to re-establish a strong uptrend.

XRP Hits Strong Bottom, Here are Factor That Could Propel XRP Parabolic Surge Against Bitcoin 

0

Popular wealth advisor Mickle highlights how XRP’s value could surge dramatically against the premier crypto asset, Bitcoin (BTC). 

In a recent assessment, Mickle observed that XRP is establishing a bottoming formation against Bitcoin. For context, such a formation indicates that an asset is approaching the end of a drawdown. This pattern essentially presents a support level that could pave the way for a rebound. 

The wealth advisor forecasted that if XRP maintains the strong bottoming formation and Judge Analisa Torres issues a favorable verdict favoring Ripple against the SEC, the token could surge tremendously relative to Bitcoin.

“If it [XRP] can maintain this strong bottom, I think it is highly likely that as we get that ruling from Judge Torres, just as we talk about on the other chart, this could be the thing that really makes XRP move parabolically against Bitcoin,” Mickle remarked. 

Potential Impact of Judge Torres’ Verdict on XRP Price Action 

The potential impact that Judge Torres’ final decision could have on XRP’s price action cannot be overstated. This upcoming ruling is expected to end the multi-year lawsuit between the SEC and Ripple at the district court level. 

Notably, many crypto stakeholders, including Ripple CEO Brad Garlinghouse, predict that the judge might issue the decision this year. 

The crypto community recently observed how the lawsuit’s conclusion might influence XRP price action, particularly if the final ruling favors Ripple. Last month, XRP’s price spiked above $0.65 amid rumors that the SEC and Ripple could settle soon. However, XRP’s price plunged after it became evident that the settlement would not happen. 

XRP Soars Nearly 10% After Devastating Collapse 

At the time of writing, XRP has increased 9.78% daily to $0.5104, recovering from the latest collapse. Like other major crypto assets, XRP recorded a swift rebound after plummeting to a 24-hour low of $0.4335. 

XRPUSDT 2024 08 06 09 18 36
XRP 1D Chart

Meanwhile, Judge Torres’ final verdict could be in Ripple’s favor if the court imposes a lower penalty against the company and denies the SEC’s requests for an injunction on future XRP sales to institutional clients, particularly those related to ODL (now Ripple Payments). 

Such a decision could bolster XRP demand among institutional clients in the United States, potentially increasing the asset’s price.

XRP Rises 20% to Break $0.50 as Crypto Market Recovers: Will XRP Hit $0.65 by Weekend

The recovery of Bitcoin past $55K has sparked a rally in altcoins, with XRP rising 20% from $0.43 to $0.50. Will XRP hit $0.65 by the weekend?

Despite the 2.60% drop in the Dow Jones on Monday and the $1.93 trillion lost from U.S. markets, the crypto market is making a comeback. Further, the Japanese and Indian indices are similarly recovering today, reflecting a bounceback earlier than anticipated. 

Accordingly, crypto assets are gaining bullish momentum. The recovery run is sending the market back to the $2 trillion mark, with an 8.5% gain today.

Bitcoin led the charge as it recaptures $55K today after briefly touching $49K yesterday. Amidst the recovery run, XRP rose 20% from the low of $0.43 to reclaim the $0.50 psychological milestone. Will XRP sustain above $0.50 for a 25% surge this week?

XRP Reversal Reclaims $0.50

With an overnight reversal from the $0.43 level, XRP takes a breakneck recovery to reclaim the $0.50 mark. The lower price rejection from the $0.43 mark results in a 20% surge in just 16 hours.  

XRP Price Chart
XRP Price Chart | TradingView

The comeback rally is on the verge of crossing above the resistance trendline with a V-shaped reversal. However, the bearish influence of the previous crash warns of a death cross between the 50 and 200 EMA in the four-hour chart. 

As per the Fibonacci levels, XRP challenges the 38.20% Fibonacci level at $0.51945. Further, the recovery run resulted in a bullish crossover of the MACD and signal lines. 

What are the Extended Recovery Hopes in XRP?

In the one-day chart, the lower price rejection in the daily candle holds the closing above $0.48. Further, the uptrend continuation results in an intraday jump of 4.81% and makes a bullish candle aiming to undermine yesterday’s fall. 

XRP Price Chart
XRP Price Chart

As the XRP price is above the 23.60% Fibonacci level at $0.47716, the chances of a bullish recovery improve. However, the downfall risks the golden crossover in the 50D and 200D EMA. 

Optimistic XRP Traders Over Binance Expect Longer Rally

As per Coinglass data, the top XRP traders on Binance show a Long/Short ratio of 2.4412 for accounts and 1.6412 for positions. Furthermore, the overall Long/Short ratio for accounts stands at 2.6969. Thus, the derivatives data from Binance indicate a stronger bullish sentiment among top traders anticipating an extended recovery. 

Will XRP Price Hit $1?

Rising demand for XRP as the market recovers from the dramatic crash can give the bulls an additional push. For context, XRP posted a massive trading volume of over $3.2 billion earlier today.

Further, the trendline breakout and sustenance above $0.48 indicate strong demand at lower levels. 

According to the Fibonacci levels in the four-hour chart, the uptrend will likely challenge the $0.65 peak if the trendline breakout gains momentum. Optimistically, hype around the potential FED rate cuts in September could propel XRP to top $1 this year. 

Shiba Inu Gains Momentum As These Crucial SHIB Metrics Climb Despite Market Challenges

0

Amid the massive market drawdown, popular social intelligence platform LunarCrush highlights Shiba Inu’s impressive performance in social and market activities in the past six months. 

According to LunarCrush data, Shiba Inu has witnessed a massive boost in its social and trading metrics in the past six months. 

Shiba Inu’s Social Activity  

Particularly, SHIB performed well in terms of social interactions, the number of social media posts created, active creators’ postings, and posts with interaction. 

The meme coin recorded an increase of 2,760% regarding its social interactions in the past six months. This suggests that social media posts, including tweets about the token, skyrocketed by 2,760%. 

Regarding the number of social media posts created for Shiba Inu, this metric surged by 2,794%. Out of the total figure, the number of posts with interaction increased by 3,467% in six months. 

Additionally, there has been a surge in the number of active creators posting about Shiba Inu within this timeframe. This metric saw a remarkable growth of 2,805%. Nonetheless, Shiba Inu’s social dominance and sentiment dropped 4.3% and 6.8%, respectively. 

Trading Metrics 

Furthermore, LunarCrush also shed light on Shiba Inu’s trading performance over the past six months. Per the data, the price of SHIB surged 53.71% in the past six months to $0.00001358. 

Interestingly, Shiba Inu has recorded a double-digit gain despite recently experiencing one of its major declines since the FTX saga. The Crypto Basic reported that SHIB’s price slumped over 20% on August 5, plunging to a daily low of $0.00001087. However, the asset witnessed a quick recovery that saw it bounce to over $0.00001300. 

Under LunaCrush’s trading metrics, Shiba Inu’s market cap grew by 53.7% in the last six months. Lastly, LunarCrush’s data shows that SHIB’s trading volume substantially increased by 452% within this period.  

Overall, Shiba Inu’s galaxy score increased by 1 in six months, earning it the 256th position on LunarCrush’s AltRank. 

SHIB Current Performance 

Meanwhile, Shiba Inu is currently trading at $0.00001391, up 25.72% over the past 24 hours. At press time, SHIB’s market cap stands at $8.18 billion, making it the 13th biggest token globally. 

Moreover, Shiba Inu’s daily trading volume has surged 42.04% to $823.54 million. This places SHIB in the 17th position in terms of crypto assets with the most trading volume. 

XRP is Not Designed for Retail Investors but for Wholesale Financial Use: Ripple Exec

Dilip Rao, an ex-global head of infrastructure innovation at Ripple, suggests that XRP is mainly for institutional investors rather than retail.

Rao expressed this view during a question-and-answer session at a Global Islamic Economic Summit held in Dubai. Members of the audience asked Rao to clarify the situation where many people use crypto to make quick gains. They wonder whether this hurts the growth of cryptocurrencies when used for a quick buck.

XRP is For Institutions, Not Retail

Rao explained that while the current market includes many individuals trading XRP speculatively, this is not Ripple’s primary focus. He noted that there are over 200 exchanges globally trading XRP, and some of this activity is superficial.

The ex-Ripple executive clarified that this deviates from the XRP use case the company pursues. Instead, Ripple aims to position XRP as a financial asset that sophisticated institutions utilize for more substantial purposes, such as a bridging mechanism in financial transactions.

Rao acknowledged that speculative trading does create noise in the market, which is not ideal. However, he pointed out that a shift was occurring where in a quarter, most Ripple’s XRP sales were to institutional investors. 

This trend indicates a move towards using XRP for significant wholesale financial applications, marking a critical turning point in its adoption and utility.

“As this transition from retail to institutional use continues, XRP will be used more for wholesale financial purposes, which is when we’ll see a significant turning point,” Rao remarked.

XRP Army Reacts

Notably, this summit took place in 2018, although members of the XRP Army recently resurfaced the clip. 

A lot has changed in the six years since Rao expressed this sentiment. XRP remains among the top ten most heavily traded crypto assets, with over $3.15 billion in trades over the last 24 hours. It is listed in over 250 markets, demonstrating its enduring popularity.

However, Ripple’s sales of XRP to institutions have since become the subject of litigation with U.S. regulators, with potential fines reaching up to $2 billion, as demanded by the SEC.

Notably, Rao’s 2018 statement that XRP is not meant for retail has continued to spark bullish sentiments among XRP holders. They believe institutional participation in the XRP market will increase the asset’s value, making it a worthwhile investment.

In response to Rao’s statement, an XRP enthusiast exclaimed, “Every single XRP will be like GOLD.”

Previously, Rao was Ripple’s managing director for the APAC and MENA regions, where he successfully led his team in securing banking partnerships for RippleNet (now known as Ripple Payments). As a result, payment services powered by Ripple Solutions that use XRP were launched across multiple corridors in this region.

Peter Brandt Believes Bitcoin Recovery Sets Stage for a “Pump” to $92,579

0

The previous week has been marked by major losses and liquidations for Bitcoin and the broader crypto market, but market veteran Peter Brandt expects an impending BTC pump.

Notably, the cryptocurrency market is already showing signs of recovery, with traders and analysts anticipating significant gains in the upcoming trading sessions. 

Particularly, expert chartist Peter Brandt highlighted the importance of focusing on possibilities rather than certainties, as he emphasized Bitcoin’s potential for further growth.

Bitcoin’s Weekly Price Movements

In a recent chart, Brandt presented an 8-period moving average to track short-term trends. In Q1, Bitcoin experienced a strong surge, establishing a bullish sentiment. However, this was followed by various fluctuations, including minor recoveries and declines, alongside smaller oscillations in price.

GUOj9vLXkAAR9uH

The chart notably highlights significant dumps, labeled Dump #2, and #3, indicating substantial pullbacks within the year. Despite these setbacks, Bitcoin has shown resilience, recovering after each dump and edging closer to previous highs. 

Sentiment is Optimistic

Market sentiment is optimistic, with a speculative arrow marked “PUMP???” suggesting a significant rise may be on the horizon. 

As Bitcoin approaches the $92,579 target, it’s crucial to monitor potential resistance levels. Notably, Bitcoin needs to rise by approximately 65.96% to reach the target price of $92,579 from its current trading price of $55,784.

Additionally, previous data by Brandt indicates that Bitcoin’s current post-halving decline mirrors patterns seen during the 2015-2017 halving bull market cycle. During his analysis, Bitcoin retraced to the $49,000 price channel for the first time in over seven months. This range reappeared after Bitcoin’s value fell from $61,000 to $49,000, marking a significant 20% correction in one day.

Historical Patterns and Future Outlook

Brandt pointed out data showing the current retracement resembles the 2015-2017 halving bull market cycle. The second Bitcoin halving occurred on July 9, 2016, with BTC closing at $650 during the halving week. However, the asset dropped to a low of $470 weeks later, marking a 27% post-halving decline.

Bitcoin halving patterns

Bitcoin faced a resistance level at $790, which it needed to surpass to reach new price territories. Ultimately, Bitcoin overcame this barrier, setting a new cycle high of approximately $20K within 24 weeks, one year after the halving. This historical perspective suggests that if similar patterns unfold, significant gains could be in Bitcoin’s future.

Expert Says XRP Will Exceed Many Expectations, Predicts It Will Reach $15 to $18 Soon

0

Analyst Javon Marks recently analyzed XRP’s price movements, suggesting XRP may soon experience significant price levels that could surpass expectations.

The market watcher presented his latest analysis on X today amid XRP’s recovery from the recent bloodbath. Marks’ chart reveals a long-term symmetrical triangle pattern, indicating potential price volatility. 

The triangle began following the drop from the $3.31 all-time high in January 2018. Notably, XRP’s price movement has consolidated within this pattern for over 2,400 days. During this period, the altcoin recorded notable lower highs and higher lows in a convergence.

XRP Symmetrical Triangle Javon Marks
XRP Symmetrical Triangle | Javon Marks

Interestingly, the symmetrical triangle setup is not new for XRP, as a similar formation occurred between 2014 and 2017. This formation eventually led to a massive breakout. During that period, XRP’s price surged by over 60,000%, setting a precedent for potential future movements.

XRP Rally Could Surpass Expectations

Marks’ confidence hinges on this historical event. According to him, the recent price action has shown signs of a bullish divergence, supported by the RSI (Relative Strength Index) indicators. 

He notes that while bulls could not sustain a recent breakout attempt, the underlying patterns still suggest a bullish breakout could be imminent. Marks estimates that a conservative breakout could target levels between $15 and $18, representing a substantial increase of over 2,100% from current levels. 

However, he also hints at the possibility of a more extensive logarithmic scale follow-through. The analyst suggests such a follow-through could propel XRP’s price to more than $100, translating to a monumental 20x rise.

Drawing from his experience and past market behaviors, Marks emphasizes that the levels XRP could reach may be beyond what many can currently envision. His confidence is bolstered by XRP’s historical performance, which at the time surpassed expectations.

Current XRP Conditions and Short-term Movements

Meanwhile, in the short-term, XRP is looking to recover from the latest market collapse. At the reporting time, XRP’s price has surged to $0.5160. This level represents a 19.6% recovery push from the recent low of $0.4312.

XRP Stoch RSI and Keltner Channel

The Keltner Channel, which measures volatility and identifies overbought or oversold conditions, shows that XRP recently dipped below the lower channel line at $0.473, suggesting an oversold condition. This typically precedes a rebound, which aligns with the observed price recovery.

The Stoch RSI, a momentum indicator, also supports this view. The Stoch RSI values indicate that XRP was oversold, with a reading of 6.79, well below the typical oversold threshold of 20. The subsequent upward movement in the Stoch RSI suggests a potential recovery phase.