Home Blog Page 1327

Buterin Dumps His Entire Neiro Holdings for 44.53 ETH

0

Vitalik Buterin, the co-founder of Ethereum, recently sold a substantial amount of Neiro for ETH tokens, as reported by Lookonchain, a smart money tracker. 

Buterin’s wallet executed a transaction involving the sale of 17.15 billion Neiro for 44.53 ETH, approximately valued at $112,448. This transaction, conducted on Uniswap V2, occurred after the Neiro team transferred these tokens to Buterin, representing 4.08% of the total Neiro supply.

Screenshot 2024 08 05 at 125751

Transaction Details 

The transaction, completed at midnight today, caused an initial dip in Neiro’s value as the market reacted to the significant sale by a prominent figure in the crypto space. 

However, according to CoinMarketCap, Neiro on ETH surged more than 15% following the initial dip, indicating a volatile market reaction.

Neiro Team’s Response 

In response to the sale, the Neiro team publicly addressed Vitalik Buterin, suggesting that he donate part of the proceeds to a stray dog shelter. They also acknowledged his contribution to the crypto ecosystem. 

The team clarified several points, denying that the token distribution to Buterin was an attempt to gain credibility. They emphasized that the tokens were airdropped by the original developer who abandoned the project, and that the community now manages the project with no ties to the initial developer.

Previous Activities of Vitalik Buterin

Buterin’s sale of Neiro on ETH tokens is not an isolated event. In May, the Shiba Inu ecosystem team recalled Buterin’s historic move of burning over 410 trillion SHIB tokens, a gesture that significantly impacted the SHIB community.

Additionally, in September 2023, Buterin transferred 2,000 ETH, worth over $3 million, to a secondary wallet with a history of deposits to Bitstamp, raising speculation of a potential sale. 

Shiba Inu Team Explains Why This Token Should be a Valuable Part of Investors’ Portfolios 

0

Shiba Inu marketing lead, Lucie, highlights the potential of Bone ShibaSwap (BONE) and why it should constitute a valuable part of investors’ portfolios. 

According to Lucie, BONE plays a central role within the Shiba Inu ecosystem, potentially bolstering its demand and value. 

BONE Integration with Shibarium and DAO 

In a recent tweet, the marketing lead emphasized that BONE is the official gas fee token of the Shiba Inu ecosystem’s layer-2 blockchain Shibarium. This suggests that Shibarium users must leverage BONE to initiate transactions on the L2 network.  

In addition, Lucie revealed that BONE will become one of the governance tokens in Shiba Inu’s decentralized autonomous organization (DAO) once it goes live. 

With its integration as a governance token, users can leverage BONE to vote on crucial decisions that could potentially influence the ecosystem’s future. 

Capped Supply and Future Growth 

Interestingly, Lucie mentioned BONE’s limited supply as another factor that could bolster its demand and value. It is noteworthy that BONE’s supply is capped at 250 million, with 229.92 million tokens currently in circulation. According to Lucie, BONE’s limited supply could drive up its value as demand increases. 

Furthermore, the marketing lead revealed that BONE will play a crucial role in Shiba State by establishing the guidelines and framework relating to data privacy, technology, and digital rights. 

Lastly, Lucie indicated that BONE has enormous room for growth as the ecosystem expands with new partnerships and projects. Amid these growing partnerships and projects, Lucie asserted that demand for BONE would skyrocket, potentially boosting its price. 

Meanwhile, she clarified that while BONE boasts numerous potential, her commentary about the token is not financial advice. Hence, investors are required to exercise caution. 

BONE Current Performance 

At the time of writing, BONE is trading at $0.3645, marking a drawdown of 13.41% in 24 hours. BONE is also down 28.21% in the past seven days following a prolonged dip across the crypto market. 

In the meantime, the token’s 24-hour volume has surged 110.57% to $10.88 million. With a market cap of $83.47 million, BONE is currently ranked as the 328-biggest crypto in the market. 

BONEUSDT 2024 08 05 10 26 51
BONE 1D Chart

‘This is Why XRP Wins’: Expert Analysis Reveals Why XRP Is Poised for Victory

0

Mickle, a market commentator and wealth advisor, calls attention to the utility that Ripple and XRP provide to banks and other large corporations.

The seasoned crypto YouTuber spotlighted this in a recent disclosure on X. According to his commentary; this utility is the reason XRP will win in the long term. Mickle began by noting that Ripple does not necessarily wish to replace banks or other financial institutions, as popularly inferred.

Ripple Does not Seek to Replace

Notably, XRP has often taken center stage in discussions around the disruption of traditional finance. This is due to its more efficient transaction system, which leverages the XRP Ledger (XRPL) for faster and more cost-efficient payments. 

Last November, asset manager Grayscale identified XRP as a viable alternative to SWIFT. This sentiment is held by multiple industry experts. In September 2023, a live demo showed how XRP reduced transaction cost and time while facilitating payment between Japan and the United States.

Despite XRP’s attractive features and the prevalent sentiments, Mickle suggested that Ripple does not wish to replace these large institutions. According to him, Ripple’s goal is to provide corporations with new tools and infrastructure to help them facilitate better payments.

This is evident in the multiple partnerships that Ripple has secured with central banks across the globe for CBDC initiatives. For instance, Ripple collaborated with Palau to help the country develop its digital stablecoin. In December 2023, Ripple and the Palau finance ministry launched the second phase of the stablecoin pilot program.

Ripple and XRP Utility Keeps Them Relevant

Mickle stressed that Ripple’s utility is the reason behind its constant appearance in multiple documents. The industry commentator said these corporations are now coming to understand that the global system is shifting to the digital era, and they all need to adapt to this change.

However, these institutions do not have the necessary engineers, infrastructure or technical know-how to adapt. As a result, they are heavily reliant on the tools firms like Ripple have offered to them. “That is where Ripple comes in,” Mickle remarked.

As a testament to Ripple and XRP’s growing utility, the payment firm recently expanded its partnership with Fenasbac, the National Federation of Associations of Central Bank Servers. The development was an effort toward bolstering the use of the XRPL in Brazil, a South American country.

Multiple commentators have pointed to this XRP utility in mainstream applications as one factor that could bolster its price growth. Highlighting this utility, analyst XRP Captain argued last month that XRP could reach $57. Following XRP’s spike to $0.74 in March, Ripple CEO Brad Garlinghouse emphasized the importance of real-world utility.

Has the PEPE 40% Breakdown in 7 Days Hit a Reversal Spot?

Amid the market crash, the PEPE price fell by 40% in the last seven days. Further, the support trendline fails to hold the rising supply, giving a sell signal. As the downfall hits $0.0000065 support, will buyers be able to halt it?

Amid the broader market crash, meme coins experience a free fall with a constant surge in supply. Amid this crash, PEPE registers an intraday drop of 16.53% as it loses the $0.000010 psychological milestone. 

With a breakdown under the 200D EMA, the PEPE market cap drops to $1.71B as it fractures multiple supports. Let’s take a closer look at the price analysis to find the next reversal spot.

Triangle Breakdown Puts PEPE Under Extreme Pressure

Taking a rejection from the $0.000013 resistance levels, the PEPE price fails to hold at any crucial levels in seven days. Breaking under all the crucial EMAs (50, 100, and 200), the meme coin tests the $0.0000065 support level. 

PEPE price chart
PEPE price chart

Furthermore, the streak of bearish candles breaks a support trendline in motion, and the previous low was at $0.00000835. With a new lower-low, PEPE teases a new bearish trend formation. 

Currently, the PEPE meme coin trades at $0.000006726 with a lower price rejection in the daily candle. Hence, a possible retest of the broken trendline could be seen in the near future. 

The daily RSI line shows a declining trend entering the oversold zone, reflecting the underlying surge in supply. Further, the downtick in the 50D EMA warns of a bearish crossover with the 100D EMA. 

Will PEPE Downfall Reverse From $0.0000065?

As Bitcoin and other top crypto assets crash, meme coins fail to sustain above any support levels. Hence, PEPE is likely to collapse even further as the downfall in the broader market gains momentum. 

Furthermore, with the trendline breakout, the overall sentiment in the daily chart is bearish. Hence, a potential drop to the next support levels at $0.0000050 and $0.0000042 is possible.

Although the sentiments and predictions are bearish, a recovery in the global markets will propel PEPE to $0.000010. 

Experts Analyze XRP Price Path Before Next Massive Pump

While XRP records a consequential price fall today, analysts expect a further drop near the $0.39 channel before the next massive pump.

The price of XRP has fallen back to the $0.4 range following the market-wide downturn, particularly as Bitcoin crashed below the $50K price point earlier today. Following Bitcoin’s dump, XRP touched a $0.45 low today, crashing by over 19% from the intraday high of $0.5567.

Looking at a broader timeframe, XRP has fallen by over 30% from its recent four-month high of $0.65, reached two weeks ago. This outcome has caused market analysts to review their bullish XRP projections based on current realities.

XRP Price Action Before Next Leg Up

In a recent post, analyst Cryptoinsightuk noted that XRP reached his area of interest upon breaching below the $0.5 level as he observed a reactionary bounce. He considers the price action a positive initial step for better upside potential.

XRP
Image Source: https://x.com/Cryptoinsightuk/status/1820182080128733471

Meanwhile, the analyst mentioned that he desires to see XRP move deeper into the $0.4 price range. He anticipates a gradual increase in volume, indicating accumulation, followed by bullish divergences before the next impulsive upward movement.

Although Cryptoinsightuk expects a substantial rebound in XRP once it reaches a bottom around $0.4, he did not provide an explicit upside price target for investors to watch.

XRP Target for Next Uprend After Dip

Meanwhile, in a separate analysis, widely followed market observer “CrediBULL Crypto” hinted at XRP’s potential uptrend. This analyst similarly projected that XRP would reach the lower boundary of the $0.4 range before making a significant upward move.

He stressed that XRP’s dip was not unexpected, as he had anticipated it weeks in advance during XRP’s pump.

Now, CrediBULL has disclosed his interest in opening a long position for XRP at its current low price. He expects a comeback that could drive XRP to $0.95, as shown in the chart accompanying his update.

XRP chart analysis by CrediBULL Crypto

Accordingly, market observers are urging participants to view the low XRP value as a buying opportunity rather than a cause for concern.

They believe XRP will break out of its wider downtrend in the coming weeks or as early as this month. Some analysts have highlighted the significance of XRP re-entering the $0.9 range, noting that this could signal the end of its downtrend.

Here is The Main Reason Shiba Inu Could Face Further Price Drop

0

Shiba Inu price could continue its decline to lower levels following the discovery of a bearish pattern in its 4-hour chart. 

Leading dog-themed token Shiba Inu (SHIB) has not been spared in the collapse recently witnessed across the broader market. Amid the latest market downturn, Shiba Inu’s price has dropped for eight consecutive days since July 28. This marked SHIB’s largest intraday losing streak of all time.

Shiba Inu Confirms Death Cross on 4-Hour Chart 

As a result of this intensive price collapse, there are confirmations of a death cross on Shiba Inu’s short-term price chart. For context, a death cross is a bearish trend that occurs when the short-term moving average of an asset drops below the long-term moving average. 

This particular bearish trend was spotted on Shiba Inu’s 4-hour chart recently. Specifically, the chart shows that the 50-day moving average has crossed from below the 200-day moving average. 

With the death cross spotted on Shiba Inu’s 4-hour chart, the dog-themed token could likely witness further decline in the short term. However, factors such as positive updates from the ecosystem team and a shift in the broader market sentiments could initiate a potential reversal in the asset’s price. 

Potential Outcomes for SHIB’s Price Action 

In the meantime, Shiba Inu is currently trading at $0.00001136, down 19.69% over the past 24 hours and 33.92% in the weekly charts.

SHIBUSDT 2024 08 05 08 06 39
Shiba Inu 1D Chart

Following the recent price decline, SHIB plunged below crucial support at $0.00001269. The next support level is situated between $0.000008 and $0.000013, where a whopping 133.56 trillion SHIB tokens were procured by 345,340 addresses, according to data from IntoTheBlock. 

If this support holds, Shiba Inu could potentially break above the daily moving averages of 50 and 200 at $0.000017 and $0.0000202, respectively. However, failure to hold this support could lead to a further decline for SHIB. 

Global Market Cap Plunged Nearly 17% 

It bears mentioning that Shiba Inu is not the only crypto that has recorded a significant price collapse. The broader crypto market has experienced intense selling pressure in recent weeks, which has resulted in huge declines in crypto prices. 

Data from CoinMarketCap shows that the global crypto market cap is down 16.59% to $1.84 trillion. This massive downturn was triggered by macroeconomic factors and a shift in investors’ sentiment.

Major XRP Whale Moves 95,678,794 XRP Following 17% Price Decline

0

An XRP whale wallet carried out a significant XRP transfer worth $50,622,428 as the market records one of its bearish moments this year.

This transaction has raised concerns as it coincides with a substantial dip in the price of XRP. The cryptocurrency’s price, currently at $0.4596, reflects a 17.25% decline in the last 24 hours and a 23.60% drop over the past week.

XRP Whale Activity

The transaction involved the transfer of 95,678,794 XRP between two unidentified wallets: rKs1TWFpdp…hS3ekPTMNN and rMMoG6nqJD…FKgrij9kjw. The large volume of this transfer has potential implications for the market, as movements of such magnitude can influence price fluctuations.

Notably, previous activity from the sender’s wallet on the same day included a transfer of 2.800 million XRP to another wallet, further proving significant activity. However, the recipient wallet is a relatively newer address, activated at the time of the transaction.

The latest movements represent one of multiple instances of increased XRP whale activity. In May, XRP experienced significant whale activity, with Santiment reporting that whales added a staggering 3.17 billion tokens, boosting network activity. This accumulation coincided with a flurry of whale movements, with major players acquiring 540 million XRP worth over $270 million in five weeks.

Reports also revealed active accumulation by whales and sharks across Bitcoin, Ethereum, XRP, and Chainlink. At the time, analysis showed a strategic uptick in asset procurement by large-scale holders, with XRP particularly standing out.

Increasing Number of Holders 

Amidst the large transfers, the total number of XRP holders has shown a steady upward trend. This growth suggests increased interest in XRP.

Screenshot 2024 08 05 at 100810

XRP Breakout by August?

Elsewhere, Michael XBT predicts that XRP will reverse its ongoing downtrend by August, expecting the cryptocurrency to reclaim its long-lost $2 price point. He points to the formation of a historic bull pennant on the XRP chart. 

Confident that a breakout will occur this month, Michael XBT emphasizes that the current dip in XRP’s price should be viewed as an accumulation opportunity, as the window to purchase XRP at a low price is rapidly closing.

XRP Bollinger Bands Support Breaks, What’s Next for Investors?

0

XRP currently trades at a critical juncture amid a market crash that has pushed prices below the significant support provided by the Bollinger Bands.

The entire crypto market has suffered its biggest crash this year, resulting in most mainstream cryptocurrencies collapsing to lows last seen in February. XRP has not escaped this bloodbath, equally posting significant losses that have now placed it in a critical position.

Notably, for nearly a month, the lower Bollinger Band had served as a potent defense against steeper declines for XRP. For context, the Bollinger Bands help traders measure market volatility and also identify overbought or oversold conditions. 

A drop below the lower band is a typically rare occurrence, which only occurs during times of intense selling pressure. While such a crash indicates a sharp increase in selloffs, it also suggests that the crypto asset in question may be oversold and could potentially rebound. 

XRP Drops Below Lower Bollinger Band

XRP first retested the lower Bollinger Band yesterday when it dropped to $0.5137. However, it found robust support at this level, holding firm as it awaited strength to recover. Nonetheless, this never came, with the broader crypto market recording a sharp drop this morning. The drop is due to the crash in Japan’s equities and a decline in the U.S. stock market.

XRP 1D Chart 2
XRP 1D Chart

XRP is now down 11.98% today, having slipped below the Bollinger Band support. This level is especially critical, as XRP’s immediate defense sits at the $0.4399 level at the 78.6% Fibonacci retracement level. If this level gives way, XRP could collapse further to the $0.38 territory. However, this would set the stage for a possible double bottom formation.

A double bottom usually forms when an asset reaches a support, rebounds and then drops back to that support. In this case, the XRP support level rests at $0.3806, a level the asset hit amid the July 5 crash. If the ongoing bearish pressure pushes XRP back to this level, the double bottom formation could be on the horizon.

The formation would be confirmed when XRP rebounds from the $0.38 territory to break above the neckline at $0.60. At the current level, XRP is still far from recording this formation, but its price action in the next few days is extremely crucial.

XRP Monthly Bollinger Band Contraction

Interestingly, despite the 27.8% collapse in August, XRP has not broken below the lower Bollinger Band on the monthly chart. However, the monthly Bollinger Bands appear to be contracting, a trend which typically follows an explosive price surge.

XRP Monthly Bollinger Bands

The last time this contraction occurred was from January to December 2020, with XRP equally recording a crash in December. This crash, which pushed XRP to an oversold position, was a result of the SEC’s lawsuit against Ripple. Despite this, the contraction eventually resulted in an XRP upsurge to $1.96 in April 2021.

The latest contraction took form in November 2023 and has persisted since then. With XRP now recording a similar collapse to the December 2020 drop, it is now oversold. A rebound could trigger a similar rally to what the market witnessed in early 2021. XRP currently trades for $0.4510.

Here is How Much XRP You Can Get with $1,000, $5,000, and $10,000 as XRP Falls Below $0.47

0

Following the massive plunge in XRP price below the $0.47 mark, some investors are leveraging the dip to acquire the token at discounted prices.   

The broader crypto market has continued to witness colossal selling pressure. The market is reacting to concerns about the geopolitical tension in the Middle East, with many predicting it could lead to global recession. The stock markets in Japan, U.S. and India are recording intense selloffs.

Expectedly, the bears have capitalized on the angst to spark massive sell pressure. This renewed sell pressure has led to a devastating collapse in the prices of Bitcoin and altcoins, such as XRP. For instance, Bitcoin, which soared to nearly $70,000 last week, is trading at $52,620 at press time. 

XRP Crashes Below $0.47 From $0.6541 

Based on XRP’s correlation with Bitcoin, the token has also witnessed a massive decline over the past week. Recall that XRP recently surged above $0.65 amid rumors about a potential settlement in the SEC v. Ripple lawsuit. 

Currently, XRP is trading below the $0.47 territory, with a token priced at $0.4678. This represents a decline of 15.26% over the past 24 hours and a drop of 23.4% in the weekly charts. It also reflects a 28% drop from XRP’s weekly high of $0.6541, registered on July 31, 2024. 

How Much XRP Investors Can Buy with $1,000, $5,000, and $10,000 At $0.4678 

While this decline has left many investors in regret, others have seized the opportunity to acquire XRP at discounted prices. Consequently, The Crypto Basic recently analyzed how much XRP you can acquire with $1,000, $5,000, and $10,000 at the current price.  

With $1,000, an investor can purchase 2,137.66 XRP at the current price of $0.4678. However, as of last week, when XRP traded at $0.6541, this $1,000 would have fetched the investor only 1,528 XRP. 

Also, at the current exchange rate of $0.4678, an investor can purchase 10,688 XRP with $5,000. As of last week, this $5,000 would have only acquired 7,644 XRP when the token traded for $0.6541. 

Furthermore, $10,000 will purchase 21,376 XRP today, compared to the 15,288 tokens that could have been acquired when XRP was priced at $0.6541 last week. 

Potential Returns If XRP Reclaims Previous ATH 

Meanwhile, despite the recent price decline, several market watchers, including “XRP Avengers,” have projected that the token will revisit its previous ATH of $3.84 in the 2024/2025 market cycle. If this prediction materializes, investors who purchase XRP with $1,000, $5,000, and $10,000 could make huge returns. 

For instance, 2,137 XRP purchased with $1,000 today could be worth $8,206 if the token reclaims its previous ATH. Similarly, the $5,000 and $10,000 investments in XRP today would respectively skyrocket to $41,041 and $82,083 if the token revisits the $3.84 price territory. 

Crypto Market Crash: Here’s the Main Reason Behind the Bitcoin 10% Drop 

With threats of the U.S. market facing a recession ahead, investors are pulling out of risky assets. Consequently, Bitcoin (BTC) and the rest of the crypto market is facing an intense sell-off. With a 10% drop in BTC today, will Bitcoin retest the $50,000 mark?

Following a massive crash in the US markets on Friday, the global market sentiments are on a downhill slope. With Asian and European markets slipping under major levels and turning bearish overnight, the crypto market liquidations are on the rise.

Today, Bitcoin is under $54K, and Ethereum is below the $2,350 mark, with the downfall in altcoins amplified. Will the sell-off wave continue for a bearish trend this week? Let’s find out.

Post-10% Drop, Bitcoin’s Support Trendline Under Pressure 

In the 1D chart, the recent negative cycle in BTC price from the $70K peak attains breakneck speed. The downfall forms multiple bearish candles, leading to a streak of four bearish days, which has resulted in an 18% drop.

Bitcoin Price Chart
Bitcoin Price Chart

Currently, Bitcoin takes support from a declining support trendline, as evidenced by the intraday tail formation. Further, it trades at $52,569 with an intraday drop of 7.73%, forming a massive bearish engulfing candle. 

The bearish trend breaks under all the crucial EMAs (50, 100, 200), and a bearish crossover in the 50D and 100D EMAs arises. Further, the daily RSI line nosedives into the oversold zone as the selling pressure grows. 

Intense Liquidations Warns Continuation in Market Crash

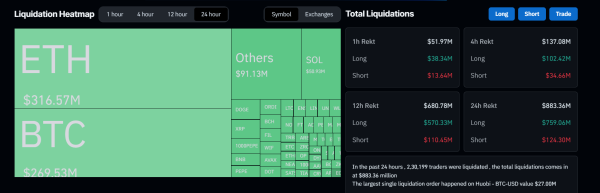
Crypto Market Liquidations

Per data from Coinglass, the broader market sell-off is rejecting to slow down as the fear grows. In the last 12 hours, almost $700M worth of positions have been liquidated, and $569M worth of bullish positions have gone REKT.

Global Market Crash: United States Starts the Avalanche

The tech-centric US index Nasdaq has crashed almost 10% in the last three weeks, with a 3.4% drop last week. This marks the worst three-week performance since September 2022. 

A couple of reasons behind the US market crash are surfacing in hindsight as the bears pick up pace. The main reasons are the lower than anticipated jobs report, increased unemployment and a slowdown in the manufacturing sector. 

Further, the U.S. Federal Reserve chose not to cut rates in the recent FOMC meeting and made no promises to cut rates in September. Lower interest rates have a symbiotic relation with Bitcoin’s performance, and the extension in current rates fuels the crypto market crash. 

Furthermore, a domino effect is seen all over the globe as the Asian markets are in a freefall. Japan’s Nikkei 225 has dropped as much as 11%, with a 15% drop in the last three weeks.

Further, it is down by almost 30% from its all-time high. Fueling the sell-off in Japanese crypto investors, the Bank of Japan announced an increase in interest rates to the highest in 16 years. 

In the Indian Markets, the NIFTY 50, an index of the top 50 stocks, is down by 3% today and almost 4.5% from its all-time high. 

Will Bitcoin Drop Under $50K?

As the selling pressure increases, the chances of the support trendline getting compromised are increasing. With the BTC price under $53K, the global market sell-off, the rising liquidations and the rising FUD, Bitcoin is likely to crash under $50K.

However, the bulls can make a comeback as the global market hits a base, and the crypto market could spearhead the recovery rally.