Home Blog Page 1328

Crypto Market Crash: Here’s the Main Reason Behind the Bitcoin 10% Drop 

With threats of the U.S. market facing a recession ahead, investors are pulling out of risky assets. Consequently, Bitcoin (BTC) and the rest of the crypto market is facing an intense sell-off. With a 10% drop in BTC today, will Bitcoin retest the $50,000 mark?

Following a massive crash in the US markets on Friday, the global market sentiments are on a downhill slope. With Asian and European markets slipping under major levels and turning bearish overnight, the crypto market liquidations are on the rise.

Today, Bitcoin is under $54K, and Ethereum is below the $2,350 mark, with the downfall in altcoins amplified. Will the sell-off wave continue for a bearish trend this week? Let’s find out.

Post-10% Drop, Bitcoin’s Support Trendline Under Pressure 

In the 1D chart, the recent negative cycle in BTC price from the $70K peak attains breakneck speed. The downfall forms multiple bearish candles, leading to a streak of four bearish days, which has resulted in an 18% drop.

Bitcoin Price Chart
Bitcoin Price Chart

Currently, Bitcoin takes support from a declining support trendline, as evidenced by the intraday tail formation. Further, it trades at $52,569 with an intraday drop of 7.73%, forming a massive bearish engulfing candle. 

The bearish trend breaks under all the crucial EMAs (50, 100, 200), and a bearish crossover in the 50D and 100D EMAs arises. Further, the daily RSI line nosedives into the oversold zone as the selling pressure grows. 

Intense Liquidations Warns Continuation in Market Crash
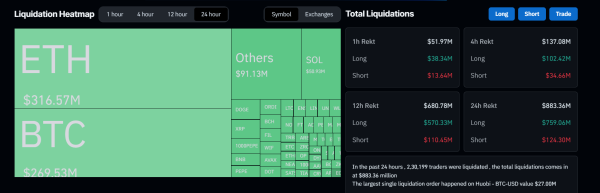
Crypto Market Liquidations

Per data from Coinglass, the broader market sell-off is rejecting to slow down as the fear grows. In the last 12 hours, almost $700M worth of positions have been liquidated, and $569M worth of bullish positions have gone REKT.

Global Market Crash: United States Starts the Avalanche

The tech-centric US index Nasdaq has crashed almost 10% in the last three weeks, with a 3.4% drop last week. This marks the worst three-week performance since September 2022. 

A couple of reasons behind the US market crash are surfacing in hindsight as the bears pick up pace. The main reasons are the lower than anticipated jobs report, increased unemployment and a slowdown in the manufacturing sector. 

Further, the U.S. Federal Reserve chose not to cut rates in the recent FOMC meeting and made no promises to cut rates in September. Lower interest rates have a symbiotic relation with Bitcoin’s performance, and the extension in current rates fuels the crypto market crash. 

Furthermore, a domino effect is seen all over the globe as the Asian markets are in a freefall. Japan’s Nikkei 225 has dropped as much as 11%, with a 15% drop in the last three weeks.

Further, it is down by almost 30% from its all-time high. Fueling the sell-off in Japanese crypto investors, the Bank of Japan announced an increase in interest rates to the highest in 16 years. 

In the Indian Markets, the NIFTY 50, an index of the top 50 stocks, is down by 3% today and almost 4.5% from its all-time high. 

Will Bitcoin Drop Under $50K?

As the selling pressure increases, the chances of the support trendline getting compromised are increasing. With the BTC price under $53K, the global market sell-off, the rising liquidations and the rising FUD, Bitcoin is likely to crash under $50K.

However, the bulls can make a comeback as the global market hits a base, and the crypto market could spearhead the recovery rally.

Shiba Inu Path to Top: Here is How High Shib Can go if It Becomes a Top 3 Crypto by Market Cap

0

Shiba Inu (SHIB) could hit unprecedented levels if it grows to become any one of the top 3 cryptocurrencies by market cap. 

Since 2022, the cryptocurrency market has featured Bitcoin (BTC), Ethereum (ETH) and USDT as the top 3 assets. Though USDT occasionally gave up its position to BNB, the stablecoin has always reclaimed the third spot. This happens during an increase in USDT supply through minting or a market drop.

SHIB’s Battle in the Top 10

Meanwhile, Shiba Inu slipped into the top 10 list in October 2021 amid its meteoric price run at the time. A historical snapshot from CoinMarketCap shows that SHIB commanded a $36.9 billion market cap on October 31, 2021, making it the ninth largest cryptocurrency, surpassing Dogecoin (DOGE), which stood at tenth.

Shiba Inu in Historical Snapshot October 31 2021
Shiba Inu in Historical Snapshot October 31, 2021 | CoinMarketCap

Shiba Inu has since collapsed below this market cap, with its valuation now around $10.1 billion. At the current market cap, SHIB is now the thirteenth largest crypto asset by valuation. The meme coin has continued to push toward reclaiming its spot among the top 10 assets. 

Notably, the last time Shiba Inu entered the top 10 list of cryptocurrencies was in May this year. This occurred on the back of an impressive rally engineered by SHIB in late May. Shiba Inu skyrocketed above $0.000028 during this period, boosting its market cap to $16.84 billion.

Shiba Inu Price as a Top 3 Asset

Despite SHIB now out of the top 10 list, some market watchers predict that the meme coin has the potential to become a top 3 crypto asset. Such a feat would require a massive price rally from SHIB. Notably, among the top 3, Bitcoin has a market cap of $1.33 trillion, while Ethereum boasts a valuation of $387.9 billion. Meanwhile, USDT’s market cap stands at $114.3 billion.

Attaining any of these market valuations would translate to an unprecedented price height for Shiba Inu. For instance, to claim USDT’s market cap of $114.3 billion and become the third-largest crypto asset, SHIB must spike to $0.0001944. This price, essentially a new ATH, represents a 1,031% increase from Shiba Inu’s current price of $0.00001718. 

Meanwhile, to become the second-largest cryptocurrency, SHIB must reach Ethereum’s valuation of $384 billion. Such a market cap would require a price of $0.0006583, representing a massive 3,731% increase for Shiba Inu. Market platform Telegaon predicted SHIB to reach the $0.0006 zone in 2030, while Changelly set a target year of 2032.

To become the largest cryptocurrency by market cap, Shiba Inu would need to claim a valuation of $1.33 trillion. Considering its supply remains stable, a $1.33 trillion valuation for SHIB would lead to a price of $0.00226. Changelly projected in April that SHIB is capable of hitting the $0.002 level between 2033 and 2040.

Here is Shiba Inu Price if Global Crypto Market Cap Hits $5T

0

Shiba Inu could increase by nearly 100% if it grows accordingly as the broader crypto market pushes toward a $5 trillion market cap.

The cryptocurrency market has come a long way since the launch of Bitcoin (BTC) in January 2009. Being the premier crypto asset, Bitcoin solely determined the entire crypto market cap for some time. However, the introduction of altcoins like Shiba Inu has helped to bolster the rise in the global crypto market cap.

SHIB’s Market Cap Dominance

Currently, the market tracking platform CoinGecko tracks up to 14,952 cryptocurrencies. These cryptocurrencies have collectively pushed the global crypto market cap to $2.549 trillion. The all-time high value of the global crypto market stands at $3.057 trillion, per CoinGecko data, attained in November 2021.

Global Crypto Market Cap
Global Crypto Market Cap | CoinGecko

Of the current figure, Shiba Inu contributes a valuation of $10.118 billion, data suggests. This market cap indicates that SHIB has a market dominance of 0.3969%. Notably, an increase in the global crypto market cap typically translates to a rise in Bitcoin and altcoins like SHIB.

Interestingly, speaking with CNBC, Ripple CEO Brad Garlinghouse noted that he expects the global crypto market cap to double by the end of the year, potentially reaching $5 trillion. Such an increase in the global crypto valuation would lead to a subsequent rise in Shiba Inu’s price.

Shiba Inu Price if Crypto Market Cap Hits $5 Trillion

An assessment from The Crypto Basic shows that SHIB might rise by a rather modest proportion if it increases accordingly. Notably, if SHIB retains its market dominance of 0.3969% when the global crypto market cap hits $5 trillion, Shiba Inu’s market cap would rise from the current $10.118 billion to $19.846 billion.

A $19.846 billion valuation translates to a price of $0.00003368 for Shiba Inu. This value is a mere 96% increase from the current SHIB price, representing a disappointing growth rate. 

It bears mentioning that SHIB has recorded a much greater increase in the past despite the global crypto market cap staying below $3 trillion. For instance, from late February to March 5, Shiba Inu spiked 370% to a yearly peak of $0.00004567. At this price, SHIB’s market cap surpassed the $21 billion mark for the first time since 2021.

Shiba Inu can replicate this run without an observable uptick in the global crypto market. To achieve this, SHIB must engineer a solo run or register a greater upsurge than the broader crypto market. This is rather achievable due to SHIB’s higher volatility. 

Here is How High XRP Price will Go if Its Market Cap Reaches $1 Trillion

0

XRP price could skyrocket by as much as 2,893% to clinch a new all-time high value if XRP’s market cap hits the $1 trillion margin.

The crypto market has witnessed exponential growth since the introduction of Bitcoin (BTC) in January 2009. This growth has been a direct result of the growth rate Bitcoin and other cryptocurrencies have continued to record over the years. 

XRP Market Cap Faces Stunted Growth

While some assets attained new heights in the previous bull market, altcoins like XRP saw stunted growth. Notably, during the 2017/2018 bull run, XRP’s market cap reached a massive $119.82 billion in January 2018. This marked XRP’s largest market cap, attained when the price reached the all-time high of $3.31.

XRP was on track to surpass this $119.82 billion valuation during the 2021 bull run. However, the highest it saw was $73.35 billion in April 2021, as its price hit resistance at $1.96. During the peak of the 2021 bull run from October to November 2021, XRP could not even exceed a $60 billion valuation.

Some market analysts attribute this underperformance to the SEC’s lawsuit against Ripple, filed in December 2020. With XRP now declared a non-security and the lawsuit on the verge of conclusion, industry commentators expect XRP’s market cap to finally clinch new heights during this bull season.

XRP Price if It Hits a $1T Market Cap

Earlier this year, Chase, host of the Bitcoin Express YouTube channel, discussed XRP’s potential to clinch Bitcoin’s $1 trillion market cap. At the time, Bitcoin boasted a market valuation of $1.02 trillion. Chase’s commentary aimed to discredit predictions that XRP price could reach $100, $589 or even $1,000.

For context, the Common Sense Crypto account has continued to insist that XRP is capable of hitting $100. Also, last March, David Gokhshtein, a former U.S. Congressional Candidate, made a case for an XRP rally to $589. Another commentator Amelie also argued for an XRP upsurge to $1,000.

Chase believes these predictions are not attainable. However, his remarks suggest the feasibility of XRP reaching a $1 trillion market cap. This could be possible if the crypto asset records an explosive growth during the ongoing bull run.

Notably, XRP has a circulating supply of 55.96 billion tokens, and an inflation rate of 200 million per month. Considering the current supply of 55.96 billion tokens, if XRP’s market cap grew to $1 trillion, its price would have jumped to $17.86. This marks a 2,893% increase from the current price of $0.5966.

Multiple crypto trading experts have predicted an XRP surge to the $17 price level. Last month, market expert TradingShot asserted that XRP is not dead, projecting a price spike above $17. Moreover, analyst EGRAG predicted earlier this month that XRP is on the verge of a run to $17.

Will AAVE Surpass $150 With This Post-Retest Reversal?

Ready with a range breakout, AAVE ignites a bull run with the potential to reach the $150 psychological milestone. Will the uptrend in AAVE survive the broader market correction phase or drop under $100?

Amidst the growingly bearish crypto market, altcoins are struggling to continue their bullish growth. With many under intense correction, AAVE starts a resilient bullish reversal after an overnight fall. 

With a bullish reversal teasing a recovery rally starting with an intraday growth today, AAVE eyes $150 this month. So, let’s take a closer look at our AAVE price analysis to find the chances of a 50% bull run.

Range Breakout for AAVE Reclaims $100

In the 1D chart, the AAVE price trend shows a bullish cycle starting from $78, accounting for a 38% surge in the last four weeks. With a higher low formation, AAVE reclaims the psychological mark of $100 and the previous peak at $108.

COINBASE:AAVEUSD Chart Image by Trojan69420

Concluding the sideways shift after the 35% drop in April, the ongoing recovery marks a consolidation range breakout. Surpassing the overhead ceiling at $110, AAVE takes a retest of the bullish break with an overnight drop of 5.45%. 

Currently, AAVE trades at a price of $112.48; the buyers are making a comeback, signalling a post-retest reversal. 

With a bullish trend in motion, the rising MACD and signal lines with positive histograms bolster the uptrend chances. Further, the daily RSI line close to the overbought boundary reflects a similar possibility. 

As per the Fibonacci retracement levels, the 50% Fibonacci breakout teases a bull run ahead to the 100% Fib level at $142. Optimistically, a push from the broader market recovery could pump the BTC price beyond $150. 

Will a Market Crash Plunge AAVE Under $100?

As per the Elliot Waves in the 4H chart, the impulse wave in AAVE completes at $116 and enters an ABC correction wave. Currently, the ABC pattern hints at a retest of the crucial $100 psychological mark. 

AAVE Price Chart
AAVE Price Chart

However, a supply pressure surge will melt down the AAVE market price under $100 to the next support level at $95 or $90. On the positive side, the trend-based Fibonacci level in the 4H chart shines a light on a potential target level of $149.79 with the 1.618 level. 

Will Cardano Hit $1 With This Trendline Breakout?

With a potential double bottom, Cardano prepares a bull cycle to challenge the overhead trendline. Will this reversal rally result in a breakout run to $1?

Maintaining a declining trend in the daily chart, Cardano has taken a massive hit over the past few months. Falling 54% since April, the ADA token is now down to $0.37 from the annual peak of $0.81 after facing the $1 psychological mark. 

The lower high formation of the bearish trend leads to a resistance trendline formation. In addition to the $0.34 support level, a declining triangle is visible that keeps Cardano entrapped. 

Cardano’s New Bull Cycle Within Triangle

Cardano shows a negative cycle from the overhead trendline in the daily chart, taking support from the baseline at $0.34. After a 13% drop this week, $ADA is up by 1.65% today and trades at $0.370.

With a $13.34 billion market cap, Cardano is the tenth biggest cryptocurrency. However, as per Coinglass, almost $2.5M worth of bullish positions were liquidated over Thursday and Friday. 

BINANCE:ADAUSD Chart Image by Trojan69420

The lower price rejection in the intraday candle teases a bullish recovery over the weekends. Furthermore, the support level has a history of providing a cushion for a bounce back. 

The bullish divergence in the daily RSI line bolsters the possibility of a bullish cycle. However, the bearish trend in the MACD and signal lines continues with a rise in negative histograms. 

Will Cardano Reach $1 in Q3 2024?

With the bullish divergence at play, Cardano’s recovery rally will likely pick up pace next week. Thus, the chances of the overhead trendline breakout rally are increasing. 

Using the Fibonacci retracement over the correction run, the 50% Fibonacci level at $0.56 is a potential target for a breakout rally. Beyond this, the bullish reversal could complete a rounding bottom reversal with a neckline at a $0.0775 peak. 

Hence, the bull run is likely in Cardano with the market recovery, but the uptrend might not reach the $1 mark this quarter. Using the same Fibonacci retracement, the 1.618 Fib level at $1.041 is a potential target this year. 

Will Shiba Inu Shock The Market With A Quick 40% Reversal?

Teasing a double bottom possibility in the 4H chart, Shiba Inu prepares for a positive cycle in a falling channel. Will a reversal rally in Shiba Inu surge 40% for a breakout run?

As the meme coins suffer an intense pullback this week, the second biggest in the segment, Shiba Inu, takes a big hit. With a 20% drop in the recent bear cycle, Shiba Inu forms six consecutive bearish candles in the 1D chart. 

However, the bearish run approaches critical support, which could reverse the trend polarity this weekend. With the chances of a double-bottom formation, the meme coin teases a new bull cycle this month.

Final Reversal Call for $SHIB Bulls 

In the Shiba Inu daily chart, the lower high formation leads to a falling channel pattern over the weeks. Tracing the recent reversal from the overhead trendline, SHIB forms 12 out of 18 bearish candles, accounting for the 25% drop. 

Shiba Inu Price Chart

However, the bulls finally get a chance for a reversal rally from the crucial support level of $0.00001453. Currently, Shiba Inu forms a dragonfly doji candle with an intraday move of 0.55% and trades at $0.00001473.

The RSI line shows a bullish divergence in the last two dips at the baseline, supporting the recovery chances. Furthermore, the MACD shows a similar divergence despite the bearish crossover in action. 

The bullish recovery breaking above the trendline could result in a trend reversal rally. As per the trend-based Fibonacci levels, Shiba Inu could hike up to the $0.000020 mark this month for a 40% surge.

What’s the Downside Risk for Shiba Inu?

In the weekly chart, the negative cycle approaches the support trendline of a massive triangle pattern. The ongoing correction drops under the 38.20% Fibonacci level at $0.00001610. 

Shiba Inu Price Chart

With a 12.50% drop this week, the downfall approaches the support trendline, increasing the downside risk. A bearish breakdown could result in a 20% price fall to the $0.000010 psychological support. 

XRP Forming Moon Pattern for Big Profit: Wealth Advisor

American wealth advisor Mickle believes XRP is forming a moon pattern amid ongoing price trends with the potential for big yields for investors.

XRP has not escaped the most recent sell-off in crypto triggered by Bitcoin’s volatility. Early today, XRP hit a fresh low of $0.5446 after having reclaimed a four-month high of $0.65 last week—a notable feat achieved during the bearish market conditions at the time. However, XRP could not defy the market-wide dump this time.

At press time, XRP had advanced slightly from its low, but it remained significantly below the $0.6 range. Meanwhile, market watchers like Mickle believe that XRP is developing a “moon shot” pattern amid the ongoing market trends.

XRP Moon Pattern

In a recent analysis, the U.S.-based wealth advisor highlighted that  XRP is currently completing a massive formation that has previously pumped its price.

Mickle referenced the ranging pattern XRP exhibited from 2013 to 2017. During this period, XRP formed a symmetrical triangle pattern, with a peak value of $0.0485 in 2013 and a subsequent low of $0.0055 in early 2017. 

XRP eventually reversed this trend and engineered a breakout rally that sent it to an all-time high close to $4.

Mickle noted that before this big move, XRP exhibited patterns suggesting an impending “doom and gloom.” Moreover, he observed that during the period, XRP traded sideways despite exponential improvements in its fundamentals. 

Accordingly, critics declared XRP dead, calling it a “crap coin” that no one would use. Then, in one of the most parabolic moves in cryptocurrency history, XRP’s price surged, instantly pricing out many investors.

Indeed, considering XRP’s low value just before the surge to $3.84, the price growth exceeded 70,000% gains.

How XRP May Rally This Time

Mickle highlighted that examining XRP’s current behavior reveals that it is visibly forming a symmetrical triangle pattern similar to its previous formation, suggesting the potential for history to repeat itself.

Mickle has described investing in XRP as similar to buying Apple’s stock in the early days, which had been up by over 5,000%. However, he expects XRP to do much better than that, suggesting a likely 100,000% return for the coin, a view other XRP community analysts agree with.

However, critics vehemently disagree with this ambitious estimation, citing XRP’s current multi-billion dollar market cap. Conservative estimates project XRP reaching around $2 to $5 if the anticipated symmetrical triangle pattern breaks to the upside.

Shiba Inu Price if SHIB is Able to Spike 150,000,000% Again

0

Shiba Inu price could surge to an ambitious double-digit figure if SHIB repeats the 150,000,000% increase recorded in its early days. 

Shiba Inu is one of the most successful cryptocurrencies in the market despite its origins as a meme coin. Launched in August 2020 by the anonymous Ryoshi, SHIB quickly gained prominence amid a surge in demand, taking it to the top 10 list of largest cryptocurrencies by market cap in late 2021.

Shiba Inu’s Success Story

On August 1, the Shiba Inu ecosystem team celebrated the fourth anniversary of SHIB’s birth. Marketing Lead Lucie spotlighted the token’s success despite its humble beginnings, stressing that it witnessed a remarkable 150,000,000% increase from its opening price to the all-time high of $0.00008616 in October 2021.

Despite Shiba Inu’s subsequent collapse from the all-time high price, at its current price of $0.00001460, the crypto asset maintains a massive 26,071,328% increase from the opening price of $0.000000000056, securing its position as one of the most successful assets. 

Interestingly, at the prevailing price, an investor who committed just $10 into a Shiba Inu investment when it launched would still be sitting on an astonishing $2.6 million profit. This reality has bolstered the interest in Shiba Inu, as market participants anticipate a repeat of the previous uptrend.

Shiba Inu Price if It Rallies 150,000,000%

The general consensus is that SHIB has the potential to surpass the previous cycle’s all-time high. However, the extent of the projected rally remains speculative. Amid the constant speculation, The Crypto Basic recently presented a hypothetical assessment of Shiba Inu’s price should it replicate the previous 150,000,000% rally recorded in 2021.

Notably, Shiba Inu currently changes hands at $0.00001460, having collapsed 14% over the past week. A 150,000,000% rally from the current price would see SHIB shed off all its leading zeros and skyrocket to a two-digit price. Specifically, such a rally could push Shiba Inu to an unattainable value of $21.9.

SHIB’s current circulating supply poses a massive roadblock to such a rally. With a circulating supply of 589 trillion tokens, a $21.9 price would trigger a market cap that even surpasses the trillion-dollar territory. For context, the largest asset, Gold, has a market cap of $16 trillion. 

For Shiba Inu to ever record such an audacious rally, its circulating supply must drastically reduce below 1 trillion tokens. This reduction is unlikely to occur due to the decentralized distribution of Shiba Inu tokens across multiple investors.

Expert Pinpoints Best Altcoins from Top 6 Crypto Narratives with Explosive Price Trajectory

Aaron Arnold, the host of the Altcoin Daily channel, recently highlighted six altcoin narratives to monitor and position oneself for a projected altcoin surge.

Despite a significant bearish shift in the crypto market sentiment on Friday, Arnold contended that the market might be on the verge of a substantial rise leading into 2025. He referenced a hint from FED Chair Jerome Powell about a potential policy rate reduction in September. He believes this could positively impact altcoins and other high-risk assets.

Although Arnold is confident in the performance of Ethereum and Solana, he stressed the importance of exploring emerging altcoins in various trends to maximize potential gains.

Five Coins in DePIN to Watch

Arnold’s first highlighted altcoin narrative is DePIN or Decentralized Physical Infrastructure Networks. 

This concept utilizes blockchain and smart contracts to automate processes, ensuring transparency and efficiency. Participants contribute valuable resources such as energy, computing power, or connectivity, and in return, they are rewarded with tokens.

Arnold highlights five leading altcoins in the DePIN space: Aethir (ATH), Filecoin (FIL), Render (RNDR), Akash Network (AKT), and IO. Notably, Render and Filecoin are established players in the crypto market, with Render boasting an impressive 190% yearly performance.

Four Tokens in RWAs

Arnold’s second altcoin narrative concerns Real-World Assets (RWAs), which involve tangible assets outside the digital realm, such as real estate, bonds, commodities, and machinery. In the context of blockchain, RWAs refer to crypto tokens representing these physical and traditional financial assets.

Arnold spotlights promising projects like Ondo Finance (ONDO). Notably, ONDO trades at $0.7783 following a remarkable 380% gain since the start of the year. Other emerging projects in the RWAs space include PRO, TRU, and TRAC.

Five Assets in Gaming Sector

The third altcoin narrative highlighted by Arnold is the crypto gaming sector, where players can trade their in-game assets to other players or even take them with them to other games.

Arnold mentions tokens making waves in the gaming sector, including Immutable (IMX). Other players include STARS, EXVG, SUPER, and ILV.

Meme Coin 

The meme coin space has been a standout performer this year. Emphatically, the meme coin narrative delivered the best returns for investors in the first quarter of the year. 

According to Arnold, top meme coins to watch include Shiba Inu (SHIB), Cardano’s meme coins SNEK, Base blockchain’s premier meme coins BRETT, and the emerging meme FOXY. 

AI in Crypto

Arnold’s fifth altcoin narrative is the AI sector, which fuses the power of artificial intelligence with the transparency of blockchain. In this category, Arnold cited Near Protocol (NEAR) and Bittensor (TAO), which are currently leading the market. Additionally, he mentions emerging AI-based crypto projects, such as CGPT and AIT, which are gaining traction.

SocialFi Tokens

The sixth and final narrative is SocialFi, also known as social finance, which combines the principles of social media with blockchain technology. According to Arnold, some notable tokens in this space include LMWR, LYX, and RTB.