Home Blog Page 1330

Binance Continues Terra Classic Burn with Fresh 1.15B LUNC Destroyed in August

The leading crypto exchange, Binance, has burned 1,149,430,203 LUNC tokens off the excessive supply of Terra Classic.

According to data from the community-based tracking service Luncmetrics, Binance burned the tokens in a single transaction on Thursday, August 1. In this transaction, 1.149 billion tokens were transferred from wallet “terra18…24sqe” to a dead address. However, this significant burn failed to impact LUNC’s market value, as the asset currently trades in the red.

Binance LUNC Burn in 2024

Prior to this latest burn, Binance had incinerated 132,316 tokens two weeks earlier. Notably, the 1.149 billion LUNC token burn on August 1 represents half of the transaction fees Binance accumulated from users trading LUNC tokens on its platform in July.

Binance had committed to destroying 50% of the trading fees it generates from LUNC transactions on a monthly basis. The effort supports for the ongoing burn campaign and revitalization efforts.

Notably, the amount burned from July trading fees is significantly lower than the quantity of LUNC the exchange incinerated at the end of June. Data from Luncmetrics showed that Binance burned 1.7 billion tokens on July 1, which is over 551 million LUNC tokens more than the amount burned on August 1.

The last substantially higher volume was recorded in April when Binance destroyed 4.17 billion LUNC tokens. The only figure that surpassed this in 2024 is the record 5.5 billion token burn on January 1, which is the second-largest Binance LUNC burn on record. 

The most significant single transaction burn ever witnessed from Binance occurred in March 2023, when the exchange destroyed 8.8 billion tokens. 

Since May 2022, Binance has eliminated 63.27 billion LUNC tokens. This figure accounts for 49.3% of the total efforts to reduce the excessive supply of Terra LUNC Classic, making Binance the largest burner of LUNC. 

Other Entities Burning Terra Classic

The closest entity to Binance, DFLUNC Protocol, has destroyed 4.51 billion tokens, accounting for 3.5% of the total. Together with other entities, including team members and exchanges such as KuCoin, MEXC, and Bybit, over 128 billion LUNC tokens have been taken out of circulation. However, Terra Classic still has over 6.7 trillion tokens in circulation.

This supply continues to pressure its market value, with LUNC hovering around $0.00007491 at press time, showing negative price growth across crucial timeframes.

MicroStrategy Founder Says Bitcoin is the Best Strategy Amid Latest 169 BTC Purchase

0

Michael Saylor, the founder and chairman of software company MicroStrategy, characterizes Bitcoin (BTC) as the best strategy following the company’s latest 169 BTC purchase.

The MicroStrategy exec made the assertion in a tweet yesterday while reflecting on the tremendous surge in the company’s stock price since its initial adoption of Bitcoin.  

MicroStrategy Stock Outperforms Bitcoin and Other Tech Giants

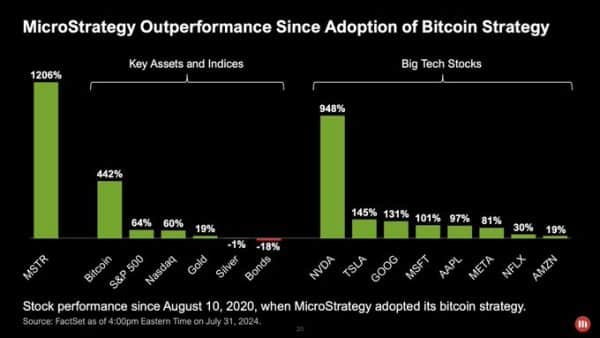
Since the company pivoted to Bitcoin on August 10, 2020, MicroStrategy’s stock price has increased by a whopping 1,206%, outperforming the shares of other tech giants like NVIDIA (NVDA). 

Microstrategy stock since Bitcoin adoption

According to the data, NVDA has witnessed a surge of 948%, while Tesla (TSLA), Google (GOOG), and Microsoft (MSFT) shares have skyrocketed 145%, 131%, and 101% in the same timeframe, respectively. 

Interestingly, MicroStrategy’s stock has also outperformed Bitcoin’s gain since August 10, 2022. Per the data, Bitcoin’s price has only increased by 442% within this period. Similarly, S&P 500, Nasdaq, and Gold recorded modest growth of 64%, 60%, and 19%, respectively. 

MicroStrategy Suffers Net Loss in Q2 2024 

Meanwhile, MicroStrategy also highlighted the outstanding performance of its shares in its report for the second quarter of 2024. The report indicated that MicroStrategy incurred a net loss of $102.6 million due to a $180.1 million impairment charge on its Bitcoin holdings. 

This figure is significantly higher than the $24.1 million impairment charge recorded in the second quarter of last year. 

Bitcoin Holdings 

It bears mentioning that MicroStrategy purchased 169 BTC worth $11.4 million in July. As of July 31, 2024, MicroStrategy holds a total of 226,500 BTC. The company acquired all these tokens at an average price of $36,821 per token, bringing the total acquisition value to approximately $8.34 billion. 

At the current exchange rate of $65,054, MicroStrategy’s 226,500 BTC are worth $14.73 billion, reflecting a 76.61% increase from their original purchase price. 

Despite its hefty Bitcoin holdings, the software company still plans to raise $2 billion to acquire more BTC. Yesterday, MicroStrategy applied with the U.S. SEC to sell its Class A common stock to raise $2 billion. The funds raised will be used for additional BTC purchases and other general corporate purposes.  

100% Win Rate Trader Makes Bold Move with 4000 Ethereum Purchase

0

An on-chain smart money trader recently purchased 4,000 ETH tokens worth $12.58 million, making a move that aligns with their past successful trading patterns.

This trader, noted for a 100% win rate, has consistently bought ETH at lower prices and sold at higher prices, accumulating a profit exceeding $38 million since November 2022. Lookonchain, a well-known crypto surveillance, called attention to this trader’s activities in a recent update.

Strategic Buy and Sell Patterns

The smart money trader’s history of ETH transactions reveals a clear strategy of capitalizing on price dips. Between November 2022 and May 2024, they bought and sold ETH seven times, each time achieving significant profits. 

Image
Chart from Lookonchain

Most Recent Transactions 

The most recent transaction saw the purchase of nearly 4,000 ETH from Binance to the address 0x75Ba13D7…c778bC62f. Five days prior to the recent ETH purchase, the same address received 2,399.9987 ETH from Binance, reaffirming the trader’s commitment to their established strategy.

Image

Cumulatively, the trader has acquired a total of 17,012 ETH for $61 million at an average price of $3,587 since May. However, the current market price of Ethereum positions the smart investor with a temporary loss of $7.6 million.

At press time, Ethereum trades at $3,150, which is 12% below the investor’s average purchase price of $3,587.

Considering this investor’s track record of success in their Ethereum trading strategies, Lookonchain ponders whether the investor would similarly net a clean sheet in their latest accumulation spree. Overall, the continued accumulation of ETH tokens since May, regardless of price fluctuations, suggests an anticipation of a market rebound.

ETH Addresses in Profit Below $3,156.80

Analysis from IntoTheBlock provides a snapshot of ETH address distributions based on the current price of $3,155. Addresses that acquired ETH between $2,674 and $3,147 are presently profitable.

Conversely, addresses that bought above $3,152 are experiencing losses, potentially contributing to selling pressure if prices do not recover. This positions the smart money trader’s recent purchase as a calculated risk, anticipating a market upswing that could turn current losses into future gains.

aETH


Finance Expert Says XRP Has Built Up Massive Pressure for Mega Price Surge

Vandell Aljarrah, finance market commentator and co-founder of Black Swan Capitalist, argues that XRP has accumulated significant pressure over the past six years that could lead to a “mega” price growth.

Aljarrah shared this sentiment in a recent post on X, highlighting four other reasons supporting a bullish future for XRP. 

Four Reasons XRP “Mega” Rally Incoming

The market pundit first emphasized that XRP has “extremely strong fundamentals,” likely referring to its market position and utility in facilitating fast and affordable payment transactions. 

Companies like Ripple use XRP as a bridge asset for cross-border fund transfers, enabling cheap and rapid transactions. A year ago, Japanese financial firm SBI Remit began using XRP for intercontinental transactions involving four Asian countries. Similarly, Malaysian payment firm Tranglo utilizes XRP for real-time payment transactions.

Furthermore, Aljarrah pointed to “extremely strong technicals” as another key factor supporting his prediction of a mega rally in XRP’s price.

This refers to the prominent symmetrical triangle pattern visible in XRP’s candlestick formations since its last all-time high. Market analysts believe that a consolidation phase lasting nearly seven years could set the stage for explosive price growth. The belief is often backed by the previous historic surge to the all-time high after a similar protracted consolidation phase. 

Thirdly, Aljarrah emphasized XRP’s perceived undervaluation, noting that its low price, resulting from being oversold, lays the groundwork for higher value.

Currently, XRP sells at $0.5695, down by over 18% over the last year. This asset has been trading below $1 for three years.

Aljarrah’s fourth point in support of a massive XRP rally is the prevalence of critics and naysayers who disseminate negative information about the asset. Ironically, the commentator believes that these individuals are actually beneficial to XRP’s prospects. 

This suggests that the spread of FUD about XRP keeps the asset in the spotlight, potentially setting it up for significant price movement. By keeping XRP on the radar of investors and traders, these critics may inadvertently contribute to a future price surge.

XRP Army Reacts

Meanwhile, community members are not sharing Aljarrah’s level of optimism. One commenter who identifies as an XRP believer stated that they had seen numerous charts and predictions in the past few years claiming that XRP was “going to the moon,” but nothing had come to fruition. 

Another commenter expressed skepticism, stating that it appears XRP is destined to move sideways forever as multiple year-long predictions have yet to materialize.

Bitcoin Bullish Sentiment Hits 17-Month High Despite Recent Price Drop

0

Despite the recent depressing performances of Bitcoin and altcoins, data from the analytic platform Santiment reveals that the market sentiment remains bullish.

Bitcoin’s price declined by over 11% this week, particularly plunging from a high of $70,000 to as low as $62,248. At press time, the premier crypto has not fully recovered, trading at $64,502.

However, this downturn has not deterred the bullish sentiment toward large-cap tokens like Bitcoin, Ethereum, XRP, and Solana. Interestingly, Santiment revealed that with the new month of August, traders’ bullish confidence in these prominent cryptocurrencies had reached new multi-year highs.

Bitcoin Bullish Sentiment Amid Price Dip

For instance, Bitcoin exhibits the highest bullish sentiment in 17 months, suggesting strong market confidence in its performance.

Santiment
Santiment chart

Notably, such strong sentiment may also indicate overbought conditions, warranting caution for potential corrections. The data implies that traders are optimistic about Bitcoin’s prospects, but the possibility of near-term corrections cannot be ignored. 

As a result, Santiment mentions that investors may wait a while for the FOMO (Fear of Missing Out) frenzy around Bitcoin and other large-cap stocks to die down before major runs.

Traders also Bullish on Ethereum and XRP

Ethereum (ETH) also maintains an optimistic sentiment, particularly following the recent launch of ETFs two weeks ago. This positive outlook suggests expectations of continued price appreciation, with the ETF launches being a significant driver.

At the same time, XRP has seen a significant 29% price surge over the last 30 days, marking the highest bullish sentiment in 14 months. This strong trader confidence and positive market momentum suggest further gains, though traders should be cautious of potential profit-taking phases.

Solana Continued Uptrend 

Furthermore, Solana (SOL) traders remain bullish after the altcoin outperformed others in July. In particular, Solana advanced from a bottom of $122.44 on July 2 to a high of $193.73 on July 29, marking an impressive 58% gain in July.

With the enduring positive sentiment in Solana, market participants anticipate a continued upward trajectory. 

In contrast, Binance Coin (BNB) currently exhibits lower bullish sentiment compared to its peers, though it has remained under the radar as an investment. This lack of enthusiasm might result in subdued price performance. However, this situation could present a potential opportunity if sentiment shifts positively in the future.

Floki Team Unveils Simon’s Cat Airdrop Details and Eligibility for Floki Holders

0

A forthcoming airdrop from Simon’s Cat, one of the most popular cat-themed memecoins to launch this year, is set to benefit Floki token holders.

This news has been highlighted by the Floki official X account and has generated significant buzz in the crypto community. Notably, Simon’s Cat will distribute a portion of its supply to both Floki holders and users trading Simon’s Cat with the Floki trading bot, enhancing the value of the Floki token.

According to the Floki team’s post on X, the snapshot for the airdrop has not yet been taken, so interested parties can still purchase Floki to qualify. Both Floki holders and stakers will receive the airdrop. 

According to the post, users should avoid any unsolicited messages or requests to connect their wallets to external sites. The airdrop tokens will be distributed automatically to qualifying users, coordinated with the Simon’s Cat team. The amount of Floki tokens held will determine the airdrop proportion, with a minimum holding of $50 worth of Floki required to qualify.

Partnership and Token Launch

The token launch is a collaborative effort involving Floki, BNB Chain, and crypto investment firm DWF Labs.  

afloki

Simon’s Cat, an animated series about a hungry house cat, has over 20 million followers across YouTube, Facebook, and Instagram. Banijay, the company holding the Simon’s Cat intellectual property, reported a revenue of $5.8 billion last year.

Community Reactions and Previous Floki Developments

The recent announcement from the Floki team has sparked a flurry of reactions on X. Some users questioned the eligibility of exchange-held Floki for the airdrop and the specifics of the token distribution process. 

This development comes shortly after Floki’s rise to the top of the play-to-earn (P2E) crypto market, surpassing competitors like Axie Infinity, The Sandbox, Decentraland, and Gala. According to CoinMarketCap, Floki has cemented its position as the leading P2E crypto asset by market cap, overtaking established players in the sector.

Here’s Shiba Inu Price If Ethereum Hits $100,000

0

Shiba Inu (SHIB) could surge to a new ATH if its correlation with Ethereum and ETH continues to hit a target of $100,000.

Following the approval of nine Ethereum exchange-traded funds (ETFs), multiple predictions have been made, suggesting that ETH’s price could spike to unprecedented levels. 

Specifically, some analysts projected the ETH could rally to $100,000 in the coming years. According to analysts from crypto trading company Changelly, ETH will hit the $100,000 target by June 2033, exactly nine years from now. 

They speculated that ETH will trade at a maximum price of $101,231 by June 2033, with an average price of $86,007 set for the same period. To hit the $100,000 target, ETH must rally 3,025% from its current price of $3,239. 

If Ethereum reaches a price target of $100,000, its market cap will hit $12.02 trillion, assuming the asset’s circulating supply of 120.22 million tokens remains stable. 

SHIB’s Price if It Follows ETH Trajectory  

Given Ethereum’s optimistic outlook, market watchers expect a similar positive impact on the broader crypto market, especially Shiba Inu (SHIB). It is worth noting that the performance of leading assets like Ethereum usually impacts the price action of the broader market, including SHIB. 

Data from blockchain analytic platform IntoTheBlock shows that SHIB has a 78% correlation with ETH over the past 30 days. This indicates that should the price of ETH experience a significant surge, Shiba Inu would also witness a comparable rise in price. 

Therefore, The Crypto Basic recently analyzed how much SHIB could be worth if ETH rallies to the projected $100,000 target set by Changelly experts. As mentioned earlier, ETH must surge 3,025% to hit the $100,000 target from its current price. If Shiba Inu witnesses a similar increase, it will spike from its current price of $0.00001692 to $0.00052875, marking a new all-time high for the dog-themed token. This would also put Shiba Inu’s market cap at $311.57 billion. 

Top Experts Set Similar Target for Shiba Inu

Interestingly, a few market analysts had predicted that Shiba Inu would rise to around $0.0005 someday. For instance, popular AI chatbot Google Bard (now Gemini) predicted that SHIB would hit the $0.0005 threshold between 2025 and 2026. However, Changelly experts projected that Shiba Inu would not reach the target until 2033. 

In the meantime, Shiba Inu is currently down 62.4% from its yearly high of $0.000045, registered on March 5, 2024. The top dog-themed token is also down 80.89% from its all-time high of $0.00008845. 

Despite the plunge, market analysts still think Shiba Inu has the potential for significant growth, with Big Mike projecting a surge to the ambitious $0.0005 threshold. 

Lawyer Reacts as Co-founder of Pro-XRP Exchange Uphold Endorses Kamala Harris

0

Pro-XRP lawyer Bill Morgan reacts to Uphold co-founder J.P. Theriot’s decision to support Kamala Harris ahead of the upcoming U.S. presidential election. 

Uphold Founder Officially Supports Kamala Harris  

Theriot took to X yesterday to back Harris, making him the first crypto exec to endorse the Democratic Party’s presidential candidate. In the lengthy X thread, Theriot contended that former U.S. President Donald Trump’s promises for the crypto sector are empty. 

Conversely, the Uphold director stated that Harris has good prospects of understanding the emerging technology, given that she is two decades younger than Trump and Joe Biden. Notably, he emphasized that his endorsement of Harris is a personal decision and does not reflect that of Uphold. 

“Uphold is a politically neutral company, and I resigned as CEO in early 2022,” Thieriot remarked. 

Difference Between Uphold XRP Support and Kamala Harris Endorsement 

Reacting, Attorney Morgan stated that crypto enthusiasts will likely turn on the crypto exchange following Thierot’s decision to support Harris. The lawyer drew a parallel between the exchange’s support for XRP and its endorsement of the Democratic Party’s presidential candidate.  

Attorney Morgan commended Uphold’s continuous support for XRP even in the heat of the lawsuit between Ripple and the SEC. However, he pointed out that this decision did not put XRP against any token on the platform. 

On the contrary, Morgan said the forthcoming presidential election requires a choice between Trump and Harris. He expressed disappointment in Thieriot’s decision to support Harris, who is currently part of an anti-crypto administration. 

The pro-XRP lawyer added that the Uphold co-founder should have delayed his endorsement until Harris revealed her potential crypto policies, which are currently unknown.

Furthermore, Morgan said Thieriot is supporting Harris without her committing anything to crypto. Nonetheless, he commended the Uphold director for boldly expressing a viewpoint that may not be popular within the crypto community. 

Crypto Stakeholders Declare Support for Trump 

It bears mentioning that former President Trump is the favorite crypto candidate. Top industry leaders, including Ripple CLO Stuart Alderoty, have donated massively to Trump’s presidential campaign. As of July 26, Trump had raised over $4 million in crypto donations.  

In return, Trump has declared support for crypto, revealing plans to sack SEC Chair Gary Gensler on his first day as president and ensure the U.S. government reserves its Bitcoin (BTC) holdings.

Meanwhile, several market watchers still believe that Trump’s promises are empty. They argue that the former president only supports crypto to gain votes from the broader industry. 

XRP Set for Major Upsurge to $3 if It Breaches This Pivotal Resistance Level

0

XRP could rally beyond the $3 mark if it can breach a significant resistance level to break out of its multi-year symmetrical triangle.

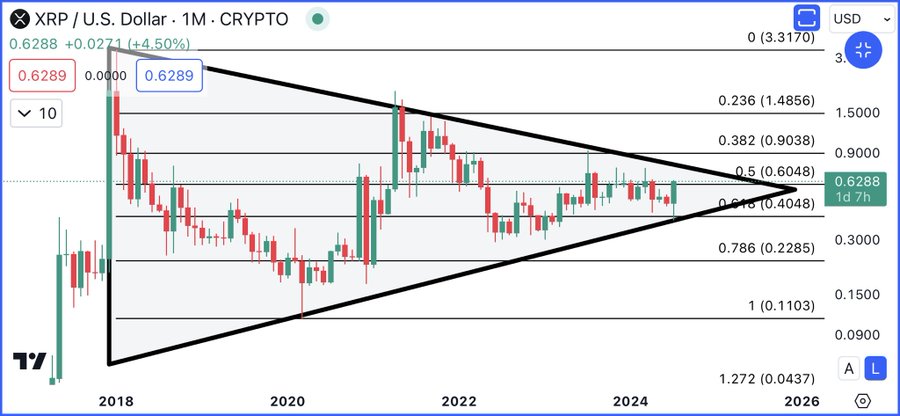
Notably, XRP has been in a prolonged consolidation phase within the symmetrical triangle pattern for over six years, as noted by market analyst Ali Martinez. This formation typically suggests an imminent significant move, with the potential for a bullish breakout if key resistance levels give way.

The Multi-Year Triangle

The symmetrical triangle formed following the drop from XRP’s all-time high of $3.3170 in January 2018. XRP experienced a sharp decline from this peak, touching a low near $0.2285 in early 2020. 

Image

However, XRP started to recover in mid-2020, pushing towards the 0.382 Fibonacci retracement level around $0.9038. This recovery faced an interruption by periods of decline, but XRP managed to reach a high of $1.96 in April 2021. However, this was not enough to breach the triangle.

At the time of Martinez’s disclosure, XRP was changing hands at $0.6288, just above the 0.5 Fibonacci retracement level of $0.6048. A sustained move above this level is crucial for a potential bullish breakout. 

The immediate resistance lies at $0.9038, the 0.382 Fibonacci level. According to Martinez, should XRP break this resistance, it could signal the start of a rally towards higher levels, potentially reaching the next major resistance at $1.4856 (0.236 Fibonacci retracement).

Beyond this, the next significant target would be the all-time high of $3.3170, representing a substantial upside from current levels. A push above the all-time high price would be instrumental for an XRP rally toward new heights.

XRP Current Price Position

Meanwhile, XRP has corrected from the initial $0.62 price level, slumping below the 0.5 Fibonacci retracement support. XRP currently trades for $0.5628, having experienced a 5.48% drop over the past 24 hours.

XRP 1D Chart
XRP 1D Chart

On the daily chart, the Ichimoku Cloud shows the current price below the cloud, suggesting a bearish trend. However, the price is close to the cloud’s upper boundary, indicating a potential for a bullish crossover if the price can break above the cloud. The Ichimoku Cloud’s leading span lines, $0.5691 and $0.5202, provide resistance and support levels.

The CCI, currently at -65.59, suggests that XRP is in a bearish phase but not yet oversold. A move above -100 would signal a potential buying opportunity, aligning with a possible price rise.

Notably, if this occurs, a decisive move above $0.9038 would mark the start of a new bullish phase. Conversely, a failure to break above the key resistance could result in continued consolidation within the symmetrical triangle, with the next support at $0.4048 providing potential downside protection. 

Bitcoin Price Analysis: Can MicroStrategy’s $2B Purchase Drive BTC to $70k?

0

Bitcoin’s price rebounded above $65,000 on August 2 after a Fed rate pause had triggered a 15% downtrend to $62,000. On-chain analysis explores how MicroStrategy’s latest $2 billion purchase could impact BTC prices as the month unfolds.

Bitcoin Reclaims $65k After MicroStrategy’s $2B Purchase News

Bitcoin price action over the last 72 hours has been subject to intense volatility amid a major clash between bearish and bullish market catalysts.

The US government triggered the first phase of the bearish trend, after it followed up news of $2 billion sell-off from seized BTC holdings, with a largely unpopular Fed Rate pause decision on July 31.

This caught highly leveraged bull traders off guard after a rollercoaster where the ETF launch and Donald Trump’s bullish comments at the Bitcoin Nashville conference had put BTC on the brink of breaching the $70,000 territory on Monday.

Bitcoin Price Action (BTC/USD) | TradingView

Within 24 hours of the US Fed Rate pause decision on July 31, Bitcoin price rapidly tumbled to 10-day low of $62,282. But shortly after, on Aug 1, public filings showed that MicroStrategy has made strategic plans to add another $2 billion BTC to its growing portfolio.

Instantly, BTC price rebounded 6% briefly reclaiming $65,500 mark before retracing toward $64,200 at the time of writing on Aug 2.

Bitcoin price vs. Microstrategy Holdings as of Aug 2 2024 | SaylorTracker
Bitcoin price vs. Microstrategy Holdings as of Aug 2, 2024 | SaylorTracker

Over the years, Microstrategy has emerged as one of the biggest investors in Bitcoin. At the time of publication, the company currently holds 226,331 BTC, valued at approximately $14.6 billion.

The latest $2 billion purchase filings comes just days after CEO and Founder Michael Saylor made an ambitious prediction that BTC price will reach $13 million per coin by 2045, during a bullish keynote speech at the Bitcoin Nashville 2024 conference.

Evidently, this news appears to have lifted the sentiment around BTC. However, it remains to be seen if bulls can sustain the momentum over the weekend.

More so, the US Fed has hinted at a possible rate cut in September. Hence, investors will be looking out for the Non-Farm Payrolls report scheduled to be released on Friday, Aug 2. Another round of dovish figures could raise expectations of the September cut, possibly driving BTC above the $70,000 level.

BTC Price Forecast: Bulls Eyeing $70k Retest

The recent price action for Bitcoin (BTC) indicates a significant correction, with the price declining by 11.42% over the past three days. This drop has brought BTC down to $64,166.93, slightly above the key support level of $64,614.29, which is represented by the Donchian Channel’s lower boundary.

The immediate resistance level to watch is $66,000, aligning with the upper boundary of the Donchian Channel. If BTC can break above this level, it could open the door for a move towards the major resistance at $70,015.86.

Bitcoin Price Forecast (BTC/USD) | TradingView

The Stochastic Momentum Index (SMI) is currently in the oversold territory, with the %K line at -27.34 and the %D line at -13.42. This indicates that the bearish momentum might be waning, and a potential bullish reversal could be on the horizon.

Historically, oversold conditions in the SMI have often preceded strong upward movements, suggesting that the current price levels could present a buying opportunity for bulls.

In conclusion, while the short-term outlook for Bitcoin shows signs of bearishness, the longer-term trend remains positive. Traders should monitor the key support level at $59,212.71 and the resistance level at $70,015.86. A successful break above $66,000 could be the first signal of a bullish reversal, paving the way for BTC to retest the $70k mark.