Home Blog Page 1337

XRP Officially Goes Live on CME Benchmarks

0

XRP officially goes live on CME, as the derivatives platform adds benchmarks tracking the asset following the initial announcement weeks ago.

Recall that The Crypto Basic confirmed on July 11 that the Chicago Mercantile Exchange (CME), one of the world’s largest derivatives platforms, had announced its intentions to list XRP benchmarks. The aim was to provide traders with transparent pricing data.

CME Officially Lists XRP Benchmarks

In the most recent development, CME has now added XRP benchmarks to its platform, per the earlier announcement. Notably, a quick look at the official CME platform confirms the listing of two XRP benchmarks: the Real-time Index for the XRP/USD pair (XRPUSD_RTI) and the Reference Rate for the XRP/USD pair (XRPUSD_RR).

XRP Benchmarks on CME

The Reference Rate (XRPUSD_RR) is a daily measure of the U.S. dollar value of XRP. CME calculates it once per day using trading data from select crypto exchanges. However, the Real-time Index (XRPUSD_RTI) provides a continuous and up-to-the-minute price of XRP against the U.S. dollar, updated constantly.

CME calculates the rates using a methodology that typically involves taking an average of the trading prices of XRP on select cryptocurrency exchanges including Bitstamp and Coinbase over a specific time period. This helps to reduce the impact of short-term price volatility and outliers.

Notably, the rate can pass as a reference in financial contracts, derivatives, and other financial instruments related to XRP. CME typically provides these rates in collaboration with Crypto Facilities (CF), a UK-based cryptocurrency trading platform. 

XRP Under the Payment Sub-Category

Interestingly, having listed XRP, CME places the cryptocurrency under the “Payment and Store of Value” sub-category. This move has caught the attention of XRP community members, who have persistently argued that XRP is a payment utility token. 

XRP on CME
XRP on CME

Notably, the latest development comes one year after Judge Analisa Torres declared XRP a non-security in the SEC vs. Ripple lawsuit. Before now, XRP had witnessed intense legal pressure, being under scrutiny as a security or not. This resulted in multiple platforms either delisting it or failing to recognize it to avoid legal issues with the SEC. 

One of the major drivers of cryptocurrency adoption is visibility. Notably, part of this visibility involves an easy-to-access public sphere providing real-time rates for the cryptocurrency in question. 

CME provides such publicity through its benchmarks. However, it was not until recently that the platform expressed interest in including XRP despite the token being around for over a decade.
Ethereum Whale Resurfaces After 9 Years, Moves 1,111 ETH Worth $3.7M

0

An Ethereum ICO participant has emerged from nearly a decade of inactivity. 

Lookonchain, an on-chain smart money tracker, revealed on X that this long-dormant participant recently transferred 1,111 ETH, worth approximately $3.7 million, to a new wallet. This significant movement marks a notable on-chain movement, given the participant’s prolonged dormancy.

The Ethereum account in question, identified as 0xE727E67E…B02B5bFC6, received 2,000 ETH at the Genesis block over 9 years ago. 

Screenshot 2024 07 30 at 171307

This initial allocation occurred during the Ethereum ICO, where the participant invested in ETH at approximately $0.31 per coin. The initial investment, worth around $620 at the time, has now surged in value to millions.

Recent Transactions and Movement

The dormant account became active again with several notable outflow transactions. Specifically, the account transferred 1,000 ETH, 100 ETH, 10 ETH, 1 ETH, and another 1 ETH to the address 0x7C21775C…2E9dCaE28 within minutes. Additionally, it moved 1 ETH to 0x2aa31476…f5aaCE9B. 

Moreover, in the latest series of transactions, the address further transferred 737.995 ETH, 50 ETH, and 100 ETH, totaling 887.995 ETH. These recent activities highlight a significant movement of funds, stirring interest and speculation in the crypto community.

Why Are Whales Reactivating?

It is also evident that apart from 0xE727E67E…B02B5bFC6, other previously dormant Ethereum whales are reawakening with significant transfers.

In May, another dormant Ethereum whale made headlines when it staked 4,032 ETH, valued at $7.4 million, after over two years of inactivity. This whale initially acquired 60,000 ETH during the Genesis block of Ethereum’s mainnet in 2015. 

At the time, the activity could have been tied to Ethereum’s upgrade, known as “Shanghai,” which enhanced the network’s scalability and performance. This whale was probably intending to capitalize on the price rally that occurred post-upgrade.

SEC No Longer Interested in Classifying Solana and Cardano as Securities in Binance Case

0

The U.S. SEC is no longer seeking a court verdict to classify ten crypto assets, including Solana and Cardano, as securities in the Binance lawsuit. 

According to a court filing today, the securities agency wants to make certain amendments to its complaint in response to the court’s minute order on July 9, 2024. 

The amendment involves modifying the complaint with respect to the “Third Party Crypto Asset Securities,” as outlined in its response to Binance’s motion to dismiss. 

Notably, the SEC stated that the proposed amendment eliminates the need for the court to rule on the adequacy of the allegations relating to the tokens right now. This suggests that the regulatory agency is no longer seeking a court ruling to classify third-party tokens as securities. 

Parties Proposed Joint Schedule for Amendment 

Consequently, the SEC and Binance proposed a briefing schedule relating to the agency’s amendment motion. 

The regulator seeks to officially file its amendment motion within 30 days after the court enters the scheduling order. Binance will then file its response to the motion 30 days later. The parties also proposed that the SEC file its reply no later than 21 days thereafter. 

SEC and Binance proposed scheduling order for amended motion

SEC Labels Cardano, Solana, and Other Tokens Securities 

Recall that the SEC charged Binance with violating federal securities laws in June 2023. In its lawsuit, the government agency labeled several tokens listed on Binance as securities. 

They included Cardano (ADA), Solana (SOL), The Sandbox (SAND), Polygon (MATIC), and Axie Infinity (AXS). Other tokens labeled as securities are Binance USD (BUSD), Binance Coin (BNB), Decentraland (MANA), Coti (COTI), and Cosmos (ATOM). However, 

The aforementioned tokens are part of a more extensive list of crypto assets the SEC has classified as securities. As of June 2023, the list of crypto assets with the securities tag spiked to 68, including Mirror Protocol mAssets. 

U.S. Politicians Vie for Crypto Support 

interestingly, earlier this month, the SEC dropped its investigation into Paxos over the firm’s possible securities laws violations through the issuance of BUSD. The move suggested that the agency does not see BUSD as an unregistered security.

Meanwhile, the latest development comes as U.S. politicians, especially presidential candidates, attempt to gain the support of the crypto industry. Former U.S. President Donald Trump of the Republican Party has recently vied for the industry’s support.

During the recently concluded Bitcoin Conference, Trump promised to sack SEC Chair Gary Gensler on his first day as president. Several crypto enthusiasts see Gensler as one individual stifling the industry’s growth. 

With Trump being the preferred candidate among crypto enthusiasts, the Democratic Party has been making moves to woo this category of voters in the upcoming election. 

In a July 26 letter, members of the House of Representatives from the Democratic Party urged the party to adopt a forward-thinking approach to blockchain and crypto. 

Responding to the letter, advisers to Democratic presidential candidate Kamala Harris called on crypto companies to mend the strained relationship between the industry and the party. 

A few days later, the SEC has now announced that it is no longer interested in classifying Cardano and Solana as securities. It remains to be seen whether this request is part of the Democratic Party’s initiative to woo crypto voters. 

Expert Sees Bitcoin Entering Banana Zone after Defeating $68,007 Resistance

0

Amid the ongoing consolidation following a three-week high, Bitcoin has continued to garner positive sentiment among analysts. 

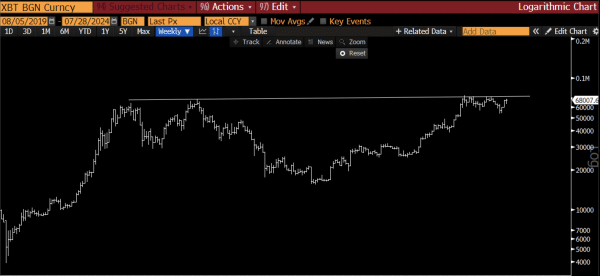
In a recent analysis, Pal’s chart highlights a classic cup and handle formation, showing that a successful breakout above his specified resistance could propel Bitcoin into newer highs.

Per the chart, this pattern began with a significant rise from 2019 to late 2021, forming the “cup” with a rounded bottom during the decline and recovery up to 2023.

Screenshot 2024 07 30 at 114205

Following this, a smaller consolidation, or the “handle,” has formed from early 2024 to the present. The resistance level, marked at approximately $68,007.6, corresponds to the previous peak reached in late 2021. This has led Pal to speculate that a successful breakout above this resistance could propel Bitcoin into what he refers to as the “Banana Zone,” indicating a significant upward movement.

Stronger Support Than Resistance

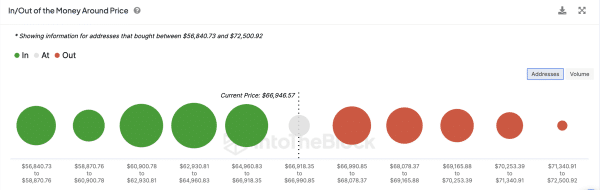
Further analysis by IntoTheBlock supports this positive outlook, confirming that the outlook is a shared sentiment. Data indicates that addresses holding Bitcoin between $56,840.73 and $66,918.35 are currently “In the Money,” suggesting strong support levels. Notably, these holders are likely to continue holding rather than selling at current levels as they anticipate further gains toward the ATH, which is less than 10% away.

Screenshot 2024 07 30 at 105242
Source, IntoTheBlock

Conversely, addresses that bought Bitcoin between $66,990.85 and $72,500 are “Out of the Money,” representing potential resistance as these holders might sell once they break even. Notably, the large green bubbles around the current price point suggest robust support, with the red bubbles indicating weaker resistance.

Robust Inflows Boost Bitcoin’s Growth Potential

Further bolstering Bitcoin’s potential for growth are significant inflows and positive market sentiment. CoinShares reports inflows of $519 million for Bitcoin-based investment products in the past week, raising its month-to-date inflows to $3.6 billion.

This surge is linked to comments positioning BTC as a potential reserve asset. It has also been linked to expectations for a Fed rate cut in September. On the flip side, Ethereum experienced outflows of $284.9 million last week.

Additionally, previous Santiment analysis shows an increase in weighted sentiment, recently reaching the highest level of bullish commentary since March 2023. This spike in positive sentiment reflects growing confidence among traders, who now foresee further gains and new peak levels. 

Trading at $66,967, Bitcoin is only 9% away from its peak value.

Bitcoin Whale Accumulates 4,500 BTC from Binance Amid Large Withdrawals

0

Bitcoin whales are actively accumulating, with a particular whale address recently withdrawing 4,500 BTC from Binance.

As Bitcoin experiences a retracement from its recent weekly highs, whale activity has surged, indicating potential future bullish trends.

According to whale tracking platform Lookonchain, a significant whale, identified as “12QVsf,” has withdrawn a substantial amount of Bitcoin from major exchanges, likely accumulating amid an anticipation of higher prices ahead.

Withdrawals from Binance

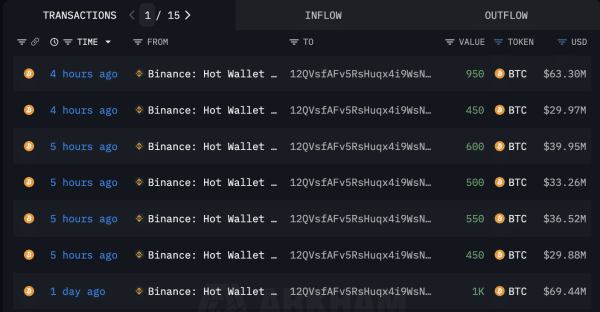
Lookonchain reported that Whale “12QVsf ” withdrew a total of 4,500 BTC, valued at approximately $302 million, from Binance within the last 22 hours. The withdrawals were conducted at an average entry price of $67,182 per BTC, as confirmed by The Data Nerd, an on-chain sleuth.

Screenshot 2024 07 30 at 135516
Binance outflows | Akharm Intelligence

The transactions included several large withdrawals, such as 950 BTC, 450 BTC, and 600 BTC, along with additional withdrawals of 500 BTC, 550 BTC, and 450 BTC. The earliest recorded withdrawal was a staggering 1,000 BTC.

Further data from Arkham Intelligence reveals that whale “12QVsf” currently holds 4,500 BTC with an unrealized loss of around $12.12 million. 

Additionally, Lookonchain identified three wallets, potentially linked to the same whale, that withdrew a combined total of 1,400 BTC from Bitfinex. This follows a previous withdrawal of 2,510 BTC from Bitfinex on June 20.

Bitfinex Sees Major BTC Outflows

The recent withdrawals from Bitfinex were carried out by three distinct wallets, each showing notable activity. Wallet 1 withdrew 700 BTC today and had previously withdrawn 649.9 BTC a month ago.

Wallet 2 withdrew 600 BTC today and had a prior withdrawal of 999.9 BTC. Wallet 3, on the other hand, withdrew 100 BTC today after having withdrawn 859.9 BTC a month prior. 

The total value of today’s withdrawals amounted to $94.09 million, while the withdrawals on June 20 totaled $163.22 million.

This consistent pattern of large withdrawals suggests a deliberate accumulation strategy by these wallets, likely influenced by market conditions and future price expectations.

Looking at Whale Activity Indicators

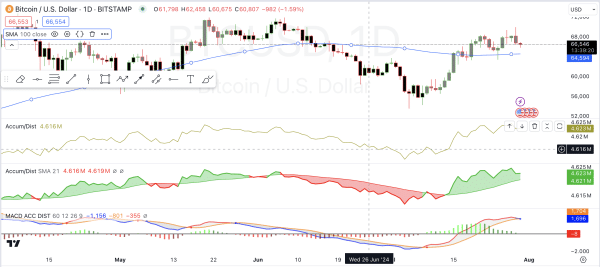
Confirming from the technical front, TradingView’s Accumulation/Distribution (Acc/Dist) line, which measures the cumulative flow of money into and out of Bitcoin, shows a consistent upward trend, despite the price volatility.

The 21-period SMA of the Acc/Dist line further confirms this upward trend, suggesting a sustained period of accumulation.

Screenshot 2024 07 30 at 132039
Bitcoin Accumulation

The MACD indicator also supports this accumulation trend, with positive histogram bars and a bullish crossover of the MACD lines indicating growing bullish momentum. This aligns with the observed whale activity and accumulation patterns.

Expert Highlights Shiba Inu and 9 Altcoins Poised for 100x Surge

0

Ava Monaro highlights ten altcoins, including Shiba Inu (SHIB), poised to experience significant gains of up to 100x following the approval of Ethereum ETFs.

The recent approval of multiple Ethereum spot exchange-traded funds (ETFs) has bolstered investors’ confidence about an imminent rally for the broader market capable of impacting altcoins, including Shiba Inu (SHIB). 

Ethereum ETFs Record Over $2.2B in Net Inflows 

For context, the Ethereum ETFs officially commenced trading last week after the SEC approved the S-1 applications for these funds. Interestingly, the funds recorded over $1 billion in volume on the first trading day. 

Moreover, eight of the nine approved funds, except Grayscale Ethereum Trust ETF (ETHE), have witnessed inflows. 

According to CoinShares data, these eight exchange-traded funds have generated over $2.2 billion in net inflows. Following the massive inflows, market watchers speculate that this could positively impact ETH’s price. Given Ethereum’s influence on the broader market, an increase in ETH’s price could trigger a similar rise in the values of other altcoins. 

Top 10 Altcoins Poised for 100x Surge 

Consequently, popular crypto enthusiast Ava Monaro highlighted the top 10 altcoins that could surge between 1,000% (10x) and 10,000% (100x) following the approval of spot Ethereum ETFs.  

They include Shiba Inu (SHIB), Byte (BYTE), Ethereum Name Service (ENS), Render (RNDR), Baby DogeCoin (BabyDoge), Turbo (TURBO), Pepe (PEPE), Bonk (BONK), Toncoin (TON), and Ondo (ONDO). 

Notably, Monaro’s tweet suggests that the massive inflow into Ethereum ETFs would lead to substantial price increases for these altcoins. 

Shiba Inu Potential Surge to $0.0001 – $0.001 Territories 

For instance, Shiba Inu is currently trading at $0.00001673, but a 10x surge would take the asset’s price to $0.00018403. Interestingly, if it witnesses a 10,000% surge from its current price, Shiba Inu would hit a target of $0.00168973. 

Multiple experts have projected that SHIB would trade within the ranges of $0.0001 to $0.001 in a bull market. In particular, experts from Changelly speculate that SHIB could reach the $0.0001 threshold by December 2027, approximately three years from now. Similarly, they projected that SHIB would surge to the $0.001 territory no earlier than 2040. 

While these predictions reflect analysts’ confidence in SHIB, it is imperative to note that there is no guarantee that Shiba Inu will achieve the feat within the projected timelines. 

In the meantime, SHIB is down 2.24% over the past 24 hours, with its price pegged at $0.00001673 per token. The token has also witnessed a similar decline of 2.4% in the weekly charts. 

Will Toncoin (TON) Breakdown Rally Crack Under $5?

Toncoin (TON) is completing a retest phase to ease a bullish revival during a broader market pullback and preparing for action. The intraday jump and lower price rejections tease a flag breakout for a 40% hike. 

Ranked amongst the top 10 cryptocurrencies, Toncoin has a market cap of $16.74 Billion. However, the ongoing correction phase in $TON has caused Toncoin to slip in position in the market.

Despite trading at discounted levels from its 52W high or all-time high, the TON trend reversal is attracting the attention of smart investors in the market. Will the Toncoin token revival result in a massive surge to outperform XRP this year?

Freefall in Toncoin Warns an Intense Correction

Failing to sustain the uptrend motion of higher low formation, Toncoin breaks under a long-coming support trendline. $TON registers a 12% decline this month with a day left, as it undermines the 20% growth last month.

Toncoin Price Chart
Toncoin Price Chart

As the higher price rejection in the daily candles becomes significant and consecutive, the downside risk increases for Toncoin. The ongoing correction rally starts with the double top formation at the $8 mark. 

Generating a new resistance trendline, the support trendline breakdown drops $TON to $6.66. Further, due to the lack of any significant body formation in the last five daily candles, Toncoin warns of a huge supply inflow. 

Supporting the bearish course of action, the constant rejection from $7 hints at a downfall. Further, the 9% rise in trading volume under such conditions adds extra risk. 

Last Hope for Bullish Revival Before $5

Although the bearish sentiments are high, the underlying demand provides some under-noticed bullish signals. Like the Stochastic RSI lines and the daily RSI line witness an uptick close to the oversold boundary, with the Stoch RSI lines merged.

Further, the trend-based Fibonacci level over the early 2024 bull run provides a support level at $6.10 (23.60% Fib level).

Considering the broader market makes a comeback, a bullish continuation could reclaim the $8 and hit a new ATH at $10. However, a bearish candle in the coming days can put the $6.10 support at risk and lead to a downfall to $5. 

XRP Likely to Surge 60,000% as Monthly Bollinger Bands at Tightest Ever: Chartered Market Technician

Tony Severino, a researcher and chartered market technician, suggests XRP could be on the verge of a violet 60,000% as experienced six years ago.

This sentiment is based on his observation that XRP’s monthly Bollinger Bands are currently the tightest they have ever been. Severino noted that the monthly squeeze is even tighter than in 2017, just before XRP went on to rally by over 60,000%.

XRP Bollinger Bands chart
XRP Bollinger Bands | Chart from Tony Severino

XRP When Bollinger Bands Previously Tightened 

Notably, in February 2017, when a significantly tight squeeze in the XRP Bollinger Bands was last seen, the asset traded with two leading zeros at around $0.0055.

This previous squeeze led to a significant market surge. It resulted in XRP reaching its all-time high of $3.84 by January 4, 2018. This rally represented a staggering 69,718% increase from $0.0055 within a year.

As the Bollinger Bands are exhibiting a similar pattern now, technical analysts like Severino anticipate another violent XRP rally.

These observations come at a time when XRP is underperforming in the bull market. Although XRP’s trajectory improved significantly this month following a 65% advancement, it still lags behind among top-ranking tokens. 

In particular, data from market tracker CoinCodex indicates that 90 crypto assets among the leading 100 outperform XRP in terms of yearly performance. In other words, XRP is ahead of only nine crypto assets among billion-dollar cap tokens.

XRP underperofming top 90 tokens
XRP underperforming top 90 tokens | CoinCodex

Will Bollinger Bands Take XRP to $420?

Meanwhile, market observers are confident in an unexpected turnaround for XRP based on suggestions from various technical indicators.

Notably, the currently tightened Bollinger Bands observed in XRP suggest low market volatility, usually seen during consolidation periods when price movements are minimal. Severino is among the increasing number of market analysts highlighting that the XRP Bollinger Bands are at their tightest point in history. 

XRP is trading at $0.5992, following a 2% decline over the past day. In the hypothetical scenario where XRP repeats a 700X surge, as seen in the last observation, the asset would attain a price of $420.

However, market participants increasingly disbelieve in this prospect. Some, even among XRP enthusiasts, have argued that charts have been irrelevant in predicting XRP’s trajectory for years and will continue to be so.

Others believe triple-digit value is purely speculative and unrealistic for a $33 billion crypto like XRP.

XRP Holds the Line at $0.60 as SEC Schedules New Closed-door Meeting

0

Despite the massive decline witnessed across the broader crypto market, XRP has continued to hold the line and has remained at the $0.6 price territory. 

The seventh-biggest crypto by market cap is currently down 1.34% in the past 24 hours. Conversely, other top crypto assets have recorded massive declines within this timeframe. For instance, Bitcoin (BTC), Solana (SOL), Binance Coin (BNB), and Dogecoin (DOGE) are down 3.78%, 5.04%, 3.29%, and 3.51%, respectively. 

Notably, there are speculations that the upcoming SEC closed-door meeting contributed positively to XRP’s recent performance. 

XRPUSDT 2024 07 30 08 59 34

SEC Schedules New Closed-Door Meeting 

For context, the U.S. SEC has scheduled another closed-door Sunshine Act meeting for August 1, 2024, at 2 PM (ET). 

As usual, the meeting will be held at the commission’s headquarters in Washington, DC. However, top officials who cannot physically attend can do so remotely. 

According to the SEC, the meeting will focus on four topics, including the settlement of injunctive actions and administrative proceedings. Additionally, the securities regulator will also deliberate on resolving litigation claims and other enforcement proceedings. 

New Rumor About SEC v. Ripple Case Settlement Resurfaces 

Expectedly, the upcoming SEC closed-door meeting has triggered speculations of a potential settlement of the Ripple lawsuit. Several XRP community members speculated that the securities agency might comment about settling its legal dispute with Ripple, potentially bringing the lawsuit to an abrupt end. 

This is not the first time that the community has made this speculation. The mere mention of an SEC closed-door meeting usually fuels rumors of an imminent settlement in the Ripple lawsuit. 

Nonetheless, these meetings have ended in futility, with no agreement on a settlement reached. For instance, the community hoped a Ripple settlement would happen during the SEC’s closed-door meeting on July 25. However, things did not go as expected, leading to the collapse of XRP’s price. 

There is no guarantee that the SEC would agree to settle with Ripple during its upcoming closed-door meeting. The crypto payments company has continuously expressed its willingness to settle with the SEC on the condition that XRP is declared a non-security. Such a declaration would foster widespread institutional adoption of the token, especially in the United States. 

Despite Ripple’s commitment, the commission is unwilling to settle the case. Instead, it has relentlessly pursued its legal action against Ripple for over three years. Moreover, the SEC has already signaled its intention to appeal the court’s summary judgment, which earned it a partial defeat. 

In the meantime, XRP is holding the line around the $0.6 price level as the parties await the court’s final judgment, which is expected later this year. 

Is the Stellar (XLM) 23.60% Fibonacci Retest the Best Buy?

Stellar (XLM) is completing a retest phase to ease a bullish revival during a broader market pullback. The intraday jump and lower price rejections tease a flag breakout for a 40% hike.

With a market cap of almost $3 Billion, Stellar, a key rival to XRP, shows a recovering price trend amid market pullback. Putting an end to a massive correction spree over the past few months, the Bulls are back for Stellar for a second coming in 2024.

Despite trading at discounted levels compared to its 52W high or the all-time high, the XLM trend reversal is turning the eyes of smart investors in the market. Will the Stellar token revival result in a massive surge to outperform Ripple this year?

Stellar’s Channel Breakout Forms Another Bullish Pattern

After the annual peak formation at $0.15, Stellar quickly lost its dominance at key levels, resulting in a downtrend. Pushing $XLM down to $0.083, the price action formed a falling channel over the months.

Stellar Price Chart
Stellar Price Chart

As the bulls regain consciousness, the $XLM price surpasses the overhead trendline for a breakout run. Coupled with the Fibonacci retracement over the correction phase, the recovery run hits the 50% Fib level at $0.115, a 35% jump, before a pullback. 

The ongoing pullback tests the 23.60% Fib level at $0.097 while buyers remain dominant at the $0.10 psychological mark. Furthermore, the breakout run, in addition to the ongoing pullback, forms a bullish flag pattern.

With an intraday gain of 1.11%, the market anticipates a reversal rally to prolong the uptrend movement. Hence, the short-term resistance trendline breakout will provide a buying opportunity for sideline traders.

Starting with the technical indicators, the RSI line shows an uptick from the halfway line, reflecting a boost in buying pressure. Supporting the bullish viewpoint, the positive crossover in the Stochastic RSI lines in the oversold zone teases an uptrend continuation. 

With Bulls Returning to Stellar, Will $XLM Hit $0.15?

Forming a bullish flag pattern upon a channel break suggests a high likelihood of an uptrend continuation for Stellar. Further, the intraday growth supports the revival after the 23.60% Fib level retest. 

Hence, Stellar is likely headed to a new 52W high this year as the broader market recovers. According to the Fibonacci levels, the bull run for $XLM could challenge the 78.60% and 100% Fib levels at $0.1377 and $0.1576. Further, in the altcoin season, the 1.618 Fib level at $0.23 could be within Stellar’s grasp.