Home Blog Page 1338

Elon Musk’s AI Predicts XRP is Set for a 234% Bullish Run to Multi-Year Highs

0

Elon Musk’s AI Grok predicts XRP price rise to multi-year highs, projecting a possible 234% increase from the current price level.

As the cryptocurrency market buzzes with predictions of a more robust bull run, XRP finds itself at the center of attention. Zach Humphries recently sought insights from Musk’s xAI-developed Grok about XRP’s price prospects. He directly asked if XRP would see a price increase this year. This comes amidst increasing interest in the capabilities of xAI in various sectors, including stock market predictions. For a deeper look into xAI’s potential beyond cryptocurrencies, check out this analysis on whether xAI stock is a long-term play or a short-term gamble.

AI and XRP
Image Source: https://x.com/Z_Humphries/status/1818041094522933546

Grok responded positively, indicating a likely price rise for XRP within the year. It cited predictions from many experts and analysts, forecasting a bullish trend for XRP in 2024. Some predictions suggest a price target between $2 and $5, representing a significant increase from its current value. Despite this optimism, Grok emphasized the volatile and unpredictable nature of crypto markets, noting that certainty is never guaranteed. 

Notably, XRP would need to rise by approximately 234.22% to reach $2 from its current price. Currently, XRP is trading at $0.5984 with a trading volume surge of over 20% in the past day, amounting to $1,154,047,024.

Screenshot 2024 07 30 at 102203
XRP Price | CoinMarketCap

Analysts Highlight XRP’s Bullish Patterns

Interestingly, a recent analysis from Coin Signal aligns with Grok’s optimistic outlook. Per his analysis, XRP’s monthly candlestick pattern reveals the formation of two symmetrical triangles over the past decade.

The first triangle, which formed between 2014 and early 2017, resulted in a massive 70,000% surge to an all-time high. A second symmetrical triangle, formed since XRP’s 2018 high of $3.84, suggests another potential high. Coin Signal sees realistic targets for XRP between $2 and $4 in the current bull cycle.

Similarly, Captain Faibik’s analysis showed that XRP bulls are nearing a critical trendline resistance on the weekly chart. This resistance, part of a symmetrical triangle pattern, presents a significant hurdle. Faibik emphasized that a successful breakout could lead to a substantial price increase, with targets around $2.50.

Screenshot 2024 07 30 at 101243

Previous Chatbot Predictions on XRP’s Future

Meanwhile, Grok’s prediction is not the first bullish XRP price projection from an AI chatbot. On July 8, The Crypto Basic reported ChatGPT’s predictions for XRP prices, contingent on Ripple’s potential victory against the SEC.

The ongoing lawsuit has significantly influenced XRP’s price, with speculations suggesting that a favorable outcome for Ripple could lead to substantial price gains. ChatGPT outlined conservative estimates of XRP soaring between $3 and $5 if Ripple wins the case.

Google Bard, another AI chatbot, offered a cautious perspective, acknowledging the difficulties in predicting cryptocurrency prices. Bard identified several factors that could boost XRP’s price, including the resolution of the SEC lawsuit, increased adoption, and positive market sentiment. However, it also highlighted potential obstacles, such as competition from other assets and regulatory pressures.

How 1,000 XRP Could Provide Huge Returns and Turn into $100,000: Crypto Educator Explains

Edo Farina, the CEO of Alpha Lions Academy, elaborates on how a 1000 XRP portfolio of below $600 could transform into $100,000.

In a recent analysis, Farina argued that XRP can make investors extremely wealthy in the future as the asset is presently at an accessible level. He illustrated this view with the prospect of a 1,000 XRP investment.

Notably, with XRP trading at $0.598 at press time, a portfolio of 1,000 tokens is worth approximately $600. Farina highlighted that XRP cracking its all-time high of $3.84 will elevate the $600 investment to $3,840. This gives an investor a nearly six-fold return on investment.

Interestingly, the crypto educator argues that a 6X return is too conservative for XRP’s potential. “We’re not looking for a 6X—this is crypto, not real estate,” Farina said, urging for a longer-term outlook.

Why Hold XRP for the Future

In his view, people need to buy and hold XRP because of the transformation currently underway in the global financial landscape. Farina cited a recent announcement from Russia concerning an alternative financial system similar to SWIFT that would bring a new economic reality for the BRICS nations. 

He added that SWIFT and the U.S. currency have been instrumentalized by Western countries. As a result, Russia is seeking an alternative system to SWIFT.

Regarding how XRP fits into the context, Farina claimed the Russian government prefers the Ripple blockchain over other blockchains. He claimed this was reported in a 2020 paper supposedly addressing cross-border payments. However, he failed to provide the source, if any.

Based on the speculative view that Russia may have “successfully tested” the XRP Ledger, Farina expressed that there is some kind of green light for XRP to “take over the new global financial system.”

Moreover, Farina speculated every major BRICS nation is working closely with Ripple, so XRP may be at the center of impact. 

It is worth noting that while Ripple has confirmed working with 30 governments concerning CBDC initiatives, it is unconfirmed if any of the BRICS nations are among them.

Meanwhile, Farina argued that the BRICS would adopt XRP regardless of Ripple’s American affiliations, as the XRP’s native blockchain, the XRP Ledger, is a fully decentralized ecosystem. 

$600 XRP Investment to Become $100K

Based on this hope, the crypto educator anticipates the 1,000 XRP of $600 to transform into a life-changing return of up to $100,000, particularly in the hypothetical scenario where XRP’s network captures 1% of SWIFT’s cross-border payments.

He believes if SWIFT either disappears or integrates XRPL, 1% of its volume would catapult XRP to way above $100. Accordingly, the initial $600 investment would expand by 16,566%.

ADA Set for Major Surge to $9.5 Amid Accumulation Phase, Says Bitcoin Analyst

0

Cardano (ADA) is showing signs of entering a new bullish phase, according to a recent analysis, with price targets projecting a 2,257% increase.

ADA has continued to follow the direction of the broader market, recently trading within a range of $0.408 to $0.430. Amid the prevailing market uncertainty, SpartaBTC, a renowned Bitcoin analyst, recently presented an analysis on TradingView that predicts a substantial price increase for Cardano. 

Cardano Previous Accumulation Phase

In his analysis, SpartaBTC highlighted key historical price movements for ADA. He noted that Cardano experienced a significant accumulation phase from November 2018 to June 2020. During this period, ADA’s price consolidated between $0.027 and $0.117. 

Cardano Weekly Chart
Cardano Weekly Chart | SpartaBTC

The average accumulation price was around $0.0440. This phase laid the groundwork for a massive rally. In June 2020, ADA broke out of this accumulation zone, surging to $0.38 by January 2021. This increase marked a 763% rise from the average accumulation price.

Following this initial rally, ADA faced a brief consolidation before continuing its upward trajectory. By August 2021, Cardano reached its all-time high of $3.1, representing a 6,744% increase from the average accumulation price. However, after hitting this peak, ADA’s price plummeted by over 91%, dropping to a low of $0.23 in June 2023.

Latest Accumulation Phase

SpartaBTC’s analysis suggests that Cardano entered another accumulation phase, similar to the one from November 2018 to June 2020. This latest accumulation phase lasted from October 2022 to November 2023. During this time, ADA’s price remained relatively stable, setting the stage for the next potential breakout.

In March 2024, Cardano attempted to rally, reaching $0.81. However, it faced rejection at this level, leading to a correction. Despite this setback, SpartaBTC identifies a bullish pattern known as a falling wedge. Another analyst also spotted the formation of this wedge pattern.

This pattern indicates that the downtrend is losing momentum and often precedes a significant price increase. Based on this formation, SpartaBTC has set an initial price target of $1.96, which would represent a 650% surge from the current levels.

Cardano Targets $9.5

However, the most ambitious target is $9.5. This projection represents a 2,257% increase from Cardano’s current price of approximately $0.403. Notably, in the short-term, ADA is looking to end a losing streak that began on July 28. The token has risen by a meager 0.25% this morning.

Meanwhile, SpartaBTC provided a daily chart analysis confirming Cardano’s bullish prospects for the short term. The chart highlights the falling wedge pattern, with SpartaBTC identifying an immediate target of $0.8918. This target marks a 97.66% increase from the July 18 resistance level at $0.4489.

Cardano Daily Chart
Cardano Daily Chart | SpartaBTC

Dogecoin Facing Rejection Warns a Bear Cycle to $0.10

Dogecoin chances of a breakout and trend reversal are under threat as the bears dominate the falling wedge. Will this bearish turn of events drop $DOGE to $0.10? 

With a major rejection in Bitcoin from the $70K mark, the broader market sentiment is at risk. Amidst the growing supply, the meme coins are at a crossroads, with the top names like Dogecoin and Shiba Inu remaining under long-term patterns. 

Dogecoin retracing the step-backs from a crucial resistance warns of an intense correction if the market slides. So, will the Dogecoin token price drop below the $0.10 psychological mark, or is $DOGE ready for a moonshot to $1?

Another Pullback Within Rounding Bottom for Dogecoin 

In the Dogecoin daily log chart, bullish attempts to recover face constant high price rejection, leading to a resistance trendline. Holding the meme coin above the $0.10 psychological mark, a descending support trendline generates a falling wedge.

Dogecoin Price Chart

Dogecoin’s recent struggle and a looming correction arise near the overhead trendline, teasing a bear cycle. Furthermore, the consecutive bearish candles with long wicks bolster the bear cycle possibility.

Currently, the meme coin trades at $0.12885, forming a Doji candle with a minor 0.38% gain. Thus, the immense supply near the trendline is likely to push the $DOGE price to the $0.10 psychological cushion pad.

The bullish crossover in the VI lines visible bolsters the bull cycle. Meanwhile, the daily RSI line holds above the halfway point. Notably, these positions confirm that the daily momentum indicators support a bullish viewpoint.

Smaller Timeframe Reveals the Bull Cycle Weakness 

In the 4H chart, the ongoing Dogecoin bull cycle facing opposition at the overhead trendline reveals a triangle pattern formation. With a long-coming support trendline of the bull cycle, the minor correction completes the pattern. 

Dogecoin Price Chart

Currently, buyers struggle to sustain Dogecoin prices and keep the trendline intact. Further, as the $DOGE trend approaches the bottleneck portion, the trend will likely get a clearer path. 

A bullish breakout could pump the altcoin to the R3 pivot point at $0.16 for a 28% jump this week. However, a downfall under the trendline will likely continue to $0.10, with minor reversal chances at the $0.11919 pivot support. 

The stochastic RSI line shows a bull cycle ready to start, as the KD lines give a positive crossover in the oversold zone. Hence, the underlying demand preserves the hope of a bullish revival.

What Are Dogecoin Breakout Targets?

With double-edged price action in two different timeframes, Dogecoin is approaching a highly volatile crossroads. Consequently, the meme coin is likely to witness sharp moves this week. 

As per the Fibonacci levels in the daily chart, the wedge breakout could hit the 50% Fibonacci level at $0.1626. However, a fracture in the 4H support trendline will lead to a bearish trend.

Shiba Inu Launches Shiba Eternity Web3 Version, Reveals How Players Can Gain Exclusive Access to Beta Testing

0

Shiba Inu marketing lead Lucie provides fresh details about the Web3 version of the Shiba Eternity game, revealing the expected launch date and how to gain exclusive access. 

Lucie, citing comments from Shiba Games’ lead Angel, said the closed beta testing of Shiba Eternity’s Web3 version will commence this week. According to Lucie, the upcoming launch of Shiba Eternity is poised to redefine the collectible card game genre of Shiba Inu’s Layer-2 blockchain Shibarium.

Here’s How to Gain Exclusive Access to Beta Testing

It is worth mentioning that the closed beta testing of Shiba Eternity will be initially accessible to LEASH holders. According to Lucie, players are expected to stake their LEASH tokens on the Shiba Inu ecosystem DEX, ShibaSwap, to gain exclusive access to the closed beta testing.


Furthermore, after the initial release of Shiba Eternity to players who have their LEASH tokens staked, the team plans to grant access to those who hold certain non-fungible tokens, such as SHEboshi, Shiba Eternity Lore NFTs, or Shiboshi. 

This requires players to hold at least one of these NFTs. Interestingly, players without NFTs who wish to participate in the closed beta can rent the asset from other users. 

Team Confirms Launch 

Furthermore, Shiba Eternity’s official X handle, which recently became active after a year of silence, also hinted at the imminent launch of the game’s Web3 version. 

It emphasized that the game is moving into the Web3 space, potentially incorporating decentralized features. The X handle encouraged players to stake their LEASH tokens to access the game.  

It bears mentioning that the closed beta is the first step towards the official launch of Shiba Eternity’s Web3 version. After a successful closed beta, the Shiba Games team will grant the public access to the testing. Upon the conclusion of the beta testing, Shiba Eternity’s Web3 version will officially launch on the Shibarium mainnet. 

New Features 

The upcoming Shiba Eternity Web3 version will introduce new features and improvements to the mobile version, which will be launched in October 2022. The latest version will enable players to own in-game assets. 

Since the game will deploy on Shibarium, all transactions will be conducted using Bone ShibaSwap (BONE), which will, in turn, support the burning of SHIB tokens. 

Other exciting features expected to be introduced in the Web3 version include ranked tournaments, strategic gameplay, and NFT minting. 

XRP Glitch: XRP price Jumps 228% on MEXC

0

The XRP price records a massive 228% jump to hit the $2 level on the MEXC crypto exchange in what appears to be an apparent price glitch.

XRP largely traded within the $0.60 across global exchanges yesterday. This position followed a mild 0.92% increase witnessed by the altcoin on July 28, which allowed it to reclaim the $0.60 territory. 

XRP Price Hits $2 on MEXC

However, amid the consolidation at $0.60, XRP observed a price glitch on the MEXC Global exchange. Community figure XRP Captain first called the public’s attention to the anomalous price behavior. An investigation by The Crypto Basic confirmed that the glitch occurred yesterday at exactly 07:21 UTC.

During this period, XRP price immediately shot up from the normal trading level of $0.6087 to a high of $2. This marked a 228% increase within one minute. However, the $2 price was not sustainable, with XRP eventually collapsing to lower grounds. 

XRP Price Glitch on MEXC

Interestingly, XRP price continued to trade above the normal trading level for another three minutes. After the drop from $2, XRP on MEXC continued to fluctuate between $0.61 and $0.63. Meanwhile, the global trading price across other crypto exchanges remained stable around the $0.60 region.

The anomaly persisted until 07:25 UTC, when the price returned to the normal range. Our investigation indicated that this price glitch only occurred on the spot market, with the perpetual futures market unaffected. As a result, the sudden price jump did not impact short positions on the XRP perpetual market on MEXC.

Recall that a similar price glitch occurred on the Bitrue exchange last April, when XRP crashed to $0.0001. However, because the Bitrue incident impacted the perpetual futures market, traders witnessed mass liquidations of their long positions.

What Happened?

The cause of the MEXC incident remains unknown at the reporting time. Some XRP community figures have pointed to low liquidity as the culprit. However, CoinMarketCap data confirms that the MEXC XRP/USDT pair boasts $12.3 million in 24-hour volume with a liquidity score of 537. The pair also has a +2% liquidity depth of $675K, indicating sufficient liquidity.

So far, MEXC has not made a press release on the matter. Also, their media team has not responded to our request for a statement as of press time. This report will be updated in light of any update to reflect their response.

XRP has been at the forefront of price glitches in recent times, with the community often attributing the anomalies to something “deeper.” One such glitch occurred on the Gemini crypto exchange, when XRP skyrocketed 7,836% to $50 last August. This event was due to a low liquidity, as Gemini had just listed XRP.

XRP Monthly Chart Shows Bullish Trends with Targets Set at $2 to $4

A notable analyst observes that XRP is bullish on the monthly time frame, suggesting realistic price targets of $2 to $4 for this cycle.

XRP has dropped below the $0.60 mark, falling by 2% in the last 24 hours to trade at $0.5961. As a result, XRP now shows a negative trend in its weekly performance. However, XRP continues to boast an impressive gain of over 26% in its 30-day trajectory.

Accordingly, prominent analyst Coin Signal has expressed optimism about XRP’s future based on its monthly candlestick pattern. In a recent post on X, the analyst highlighted the bullish nature of XRP’s monthly chart and set a realistic target of up to $4 for its continued upward trend.

Details of the Analysis

The analysis examined XRP’s 30-day pattern over the past decade and identified the formation of two symmetrical triangles. The first triangle formed between 2014 and early 2017, culminating in a massive 70,000% surge to an all-time high after the trend reversed at the triangle’s tip.

A second symmetrical triangle has emerged since XRP’s 2018 all-time high of $3.84. According to Coin Signal, this formation suggests that XRP is poised to reach a new all-time high once the trend reverses.

XRP Realistic Targets at $2 to $4

Based on this optimism, the analyst argued that realistic targets for XRP in this current bull cycle are for XRP to attain between $2 and $4. 

Notably, for XRP to attain the lower range of the target, it needs to surge by 235%. While this is an impressive gain, it significantly falls short of XRP’s ATH of $3.84. 

Meanwhile, XRP needs to rally more massively by 571% to attain the upper boundary of $4, which would mark a fresh history for the asset.

It is worth noting that the analyst anticipates XRP retesting a low of $0.53, which he considers a favorable buying point before the rally toward $2 and $4. 

Other Analysts See $305 Target as Realistic

Interestingly, while Coin Signal considers up to $4 realistic for XRP in this cycle, other market watchers disagree. They believe more ambitious targets are attainable when similarly observing the asset on a monthly timeframe.

One such analyst is Heikin Ashi. In an update earlier this month, Ashi argued that XRP’s monthly candle suggests a potential 71,000% price surge to $305 in this bull market. Other analysts have proposed similar price points based on various technical parameters.

However, conservative analysts think these price targets are unrealistic and unattainable for an asset with a market cap of over $25 billion.

Bitcoin At Crossroad With High Liquidations: Will $BTC Top $71K?

Faced with rejection at $70K, Bitcoin is down to $68,100 within hours. Is this the end of Bitcoin’s recovery rally, or will the bull run continue to end the week above $73K?

Within hours of hitting the $70K milestone after a month-long correction phase, the price of a single Bitcoin is back to $67,800. The intraday pullback drops the three weeks returns to 24% and forms a high rejection candle. 

As the bullish positions are losing their strength, Bitcoin and altcoins are at shaky grounds. So, will the BTC price trend suffer a huge correction this week or a strong end this week shake out the bears?

Another Pullback Within Rounding Bottom For Bitcoin 

In the 4H chart, the BTC price trend shows a quick reversal in the last three weeks from the low point of $54,400 to hitting the $70K ceiling. However, the 2% pullback from $70,000 and the overhead trendline in a 4-hour candle breaks the $68,000 support. 

BITSTAMP:BTCUSD Chart Image by Trojan69420

Furthermore, a rising wedge pattern is visible with two rising trendlines. Currently, Bitcoin trades at $67,844 and warns of a bearish continuation as a second red candle undergoes formation.

The RSI line shows a double top reversal from the overbought boundary, supporting the bearish scenario. Meanwhile, the dynamic support of the 20 EMA in the 4H chart fails; the 50 EMA is next in line.

Derivatives Hold A Bullish Viewpoint 

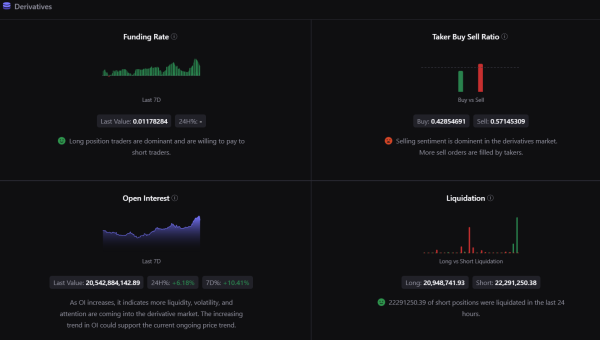
As per Cryptoquant, Bitcoin’s open interest hit the $20.54B mark, a 6.18% surge in the last 24 hours. However, with the recent shift in dynamics and the quick fall from $70K, the Taker Buy-Sell Ratio is bearish, with a 0.57 sell side.

Bitcoin Derivative
Bitcoin Derivative

Regarding liquidations, as per Cryptoglass, $26.74M worth of long positions in Bitcoin were liquidated in the last four hours. Meanwhile, the crypto market has witnessed a loss of $53.23M worth of long liquidations. 

Will Bitcoin Surpass $70K This Week?

A rounding bottom reversal forming in the 4H chart marks a potential roadmap in the Bitcoin price trend. Currently, the recent correction remains a minor drop within it. However, the intraday drop of 1.04% and a potential drop ahead warns of a further correction. 

Beyond the rounding bottom, the support trendline of the rising wedge is the next reversal spot for Bitcoin. Hence, with a dominant bull run in motion and a strong trendline in action, the bulls are expected to regain control.

As per the Fibonacci levels, the uptrend could hit the $71,665 peak by the end of this week. 

Majority of Bitcoin Holders in Profit as BTC Rallies Near ATH of $73,737, Breakthrough Imminent?

0

Bitcoin nears its all-time high of $73,737, with 93% of holders in profit; minimal resistance and bullish sentiment confirm the potential for further gains.

In a recent post on X, analytic platform IntoTheBlock highlighted that almost all Bitcoin holders are now profitable, indicating a favorable market sentiment and minimal on-chain resistance.

This emerged as Bitcoin briefly reclaimed the $70K threshold a few hours ago before settling at around $68K. At this price, 93% of Bitcoin holders are in profit, with only 2% at a loss, while 5% are neither in loss nor profit.

The image accompanying the update from IntoTheBlock highlighted the distribution of investors that bought BTC between $59,016 and $72,500. The large green clusters show a significant number of BTC addresses in profit within the range of $59,015 to $69,455.

Screenshot 2024 07 29 at 173531
Bitcoin holders in profit and loss | IntoTheBlock

This profitability suggests that most investors bought at lower price points, contributing to the overall positive market sentiment.

Meanwhile, the smaller red clusters suggest current losses for those who bought Bitcoin between $69,528 and $72,500. Given the small size of these clusters, they indicate minimal on-chain resistance above the current price.

This lack of significant sell pressure suggests the potential for continued price growth. If BTC breaks through the current resistance levels, it could pave the way for a retest of its all-time high and potentially new highs. Notably, Bitcoin is only 6.53% shy of its all-time high of $73,737.

Market Sentiment Gains Boost with Bitcoin

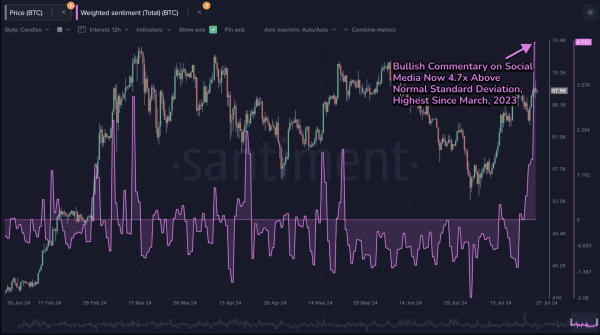
Market sentiment is another critical factor supporting the potential breakthrough. For instance, Santiment’s analysis shows that Bitcoin’s 20% price rally over the past three weeks has significantly boosted trader sentiment. 

Screenshot 2024 07 29 at 180023

According to Santiment, there is a notable spike in weighted sentiment, which is now nearly five times above the normal standard deviation. This marks the highest level of bullish commentary since March 2023. This surge in positive sentiment indicates growing confidence among traders, who now expect further gains and new all-time highs.

Technical Indicators Confirm Room for BTC Growth

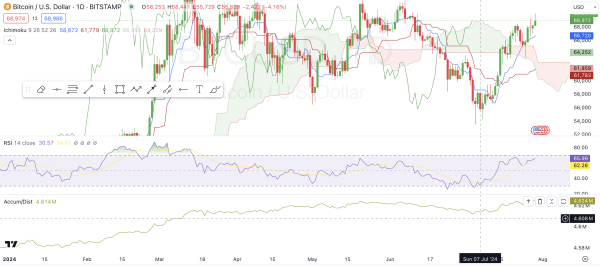
Technical indicators also point to bullish signals. Data from TradingView shows that as BTC trades around $69,000, it has broken above the Ichimoku Cloud, a strong bullish sign.

Screenshot 2024 07 29 at 170548

The Relative Strength Index (RSI) at 65.99 is in the bullish zone but not yet overbought, indicating room for further growth. On the other hand, the accumulation/distribution line shows steady accumulation, reflecting strong buying interest among investors.

Dormant Bitcoin Whale Nets 541,265% Profit

Amid these developments, a recent report by The Crypto Basic reveals that several dormant Bitcoin whales have awakened. One Bitcoin wallet, which held 37 BTC, was reactivated after being dormant for 11.8 years.

Back in 2012, these 37 BTC tokens were valued at just $476. Today, this portfolio is worth $2,576,901, thanks to Bitcoin’s surge to $70,000. This reactivation represents a return on investment of over 541,265%.

During this report, Bitcoin is up 0.8% by the day and 2.45% by the week, pushing its price to $68,378.

Bitcoin Investments Surge with $519M Inflows, While Ethereum Sees $284.9M Outflows

0

Digital asset investment products experienced relatively modest inflows of $245 million last week, reflecting a mixed performance across various digital assets. 

This reportedly occurred despite trading volumes rising to $14.8 billion, the highest since May, driven by recent Ethereum ETF launches. 

Price appreciation elevated total assets under management (AuM) to $99.1 billion, with year-to-date (YTD) inflows reaching a record $20.5 billion.

Bitcoin Leads Inflows, Ethereum Faces Outflows

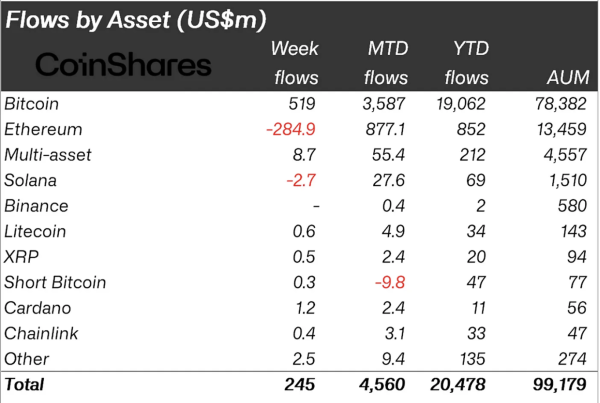
Notably, according to CoinShares’ report, Bitcoin led the way with robust inflows of $519 million, bringing its month-to-date (MTD) inflows to $3.6 billion and YTD inflows to a record $19 billion. This surge is attributed to US electioneering comments positioning Bitcoin as a potential strategic reserve asset and heightened expectations for a Federal Reserve rate cut in September 2024.

Screenshot 2024 07 29 at 153755

Conversely, Ethereum experienced significant outflows of $284.9 million last week. Despite this, Ethereum’s MTD inflows stand at $877.1 million, indicating broader positive sentiment. 

Multi-asset funds saw moderate inflows of $8.7 million, while Solana recorded a minor outflow of $2.7 million. Other assets such as Litecoin, XRP, Cardano, Chainlink, and Short Bitcoin witnessed small inflows ranging from $0.3 million to $2.5 million. Notably, “Short Bitcoin” saw a significant YTD inflow of $47 million despite recent outflows.

Diversified Providers Attracted Inflows

Furthermore, the launch of US spot-based Ethereum ETFs sparked substantial market activity, marking the largest inflows since December 2020. 

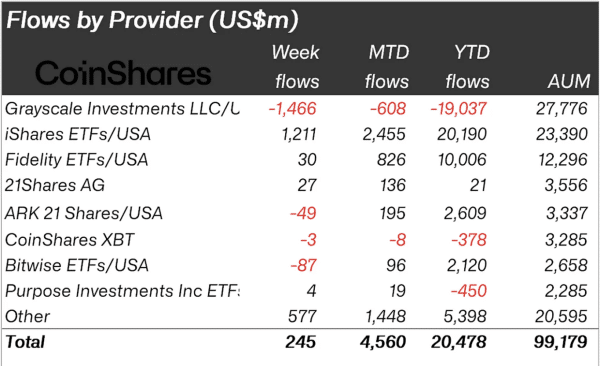
Specifically, Grayscale Investments LLC/U faced substantial weekly and YTD outflows, with the latter reaching $19 billion, reflecting a shift in investor sentiment. iShares ETFs/USA emerged as a dominant player, reporting the highest weekly inflow of $1.2 billion and a YTD inflow of $20 billion. Fidelity ETFs/USA also showed strong inflows across all time frames, with weekly inflows of $30 million.

Screenshot 2024 07 29 at 153841

Meanwhile, 21Shares AG and ARK 21 Shares/USA recorded moderate inflows, with YTD inflows of $21 million and $2.6 billion, respectively. Bitwise ETFs/USA reported positive YTD inflows of $2.1 billion, suggesting moderate investor interest. CoinShares XBT and Purpose Investments Inc ETFs experienced outflows, with YTD outflows of $378 million and $450 million, respectively.

US Dominated in All Regional Metrics

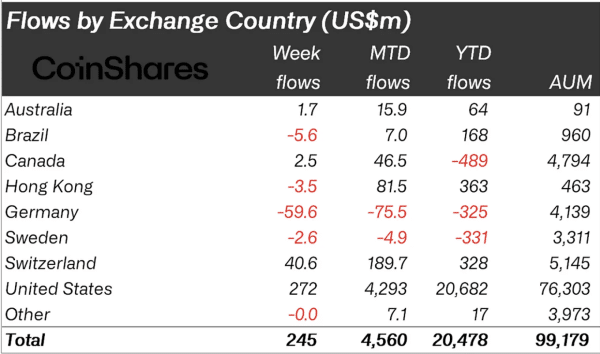
Regionally, the United States dominated in all metrics, with the highest weekly inflow of $272 million, MTD inflows of $4.3 billion, and YTD inflows of $20.7 billion. The United States also held the largest AuM at $76 billion. Germany faced significant outflows across all periods, with a weekly outflow of $59.6 million, MTD outflow of $75.5 million, and YTD outflow of $325 million.

Screenshot 2024 07 29 at 153907

Canada, despite a notable YTD outflow of $489 million, showed positive weekly and MTD inflows of $2.5 million and $46.5 million, respectively. Switzerland reported strong inflows, particularly MTD inflows of $189.7 million, reflecting positive investor sentiment.

Australia, Brazil, and Hong Kong generally experienced positive inflows, with YTD inflows of $64 million, $168 million, and $363 million, respectively. Sweden faced outflows across most periods, with a weekly outflow of $2.6 million, MTD outflow of $4.9 million, and YTD outflow of $331 million. Other regions contributed moderate inflows, with YTD inflows of $17 million, enhancing overall market diversity.