Home Blog Page 1374

Analysts Predict Bitcoin Price Recovery Following Sell-Off Fears

0

Bitcoin analysts observe key support levels and potential rebound despite bearish sentiment.

Amid the recent turmoil caused by selling activities, signs of stability and potential recovery are emerging. Notably, Rekt Capital and Ali Martinez have provided insights into Bitcoin’s current market dynamics, both long and short term.

Rekt Capital recently highlighted Bitcoin’s initial signs of stability following a significant crash. He noted that Bitcoin is gradually approaching the downtrend marked by a light blue trend line. This trend line, showing lower highs and lower lows, represents a critical resistance level. The red-shaded area around the $72,500 level also indicates a major resistance zone.


Rekt Capital also observed a bullish divergence in the RSI (Relative Strength Index). This divergence, where the price makes lower lows while the RSI makes higher lows, suggests weakening selling momentum. If this bullish divergence takes its course, Bitcoin could challenge and potentially break through the downtrend, signaling a reversal.

Reclaiming Support Levels Amid Fake Breakdowns

In a separate analysis, Rekt Capital pointed out Bitcoin’s ability to reclaim a crucial support level. The horizontal line around $56,758 on the chart, previously breached during a fake breakdown, was reclaimed. This fake breakdown saw the price briefly dip below this level before quickly recovering, indicating strong buying interest.


Additionally, Rekt Capital identified two significant resistance levels at $61,000 and $71,000. Bitcoin’s recent price movements, particularly its ability to stay above the purple support level, suggest a positive market sentiment. However, to confirm a bullish outlook, Bitcoin must break through these immediate resistance levels.

Short-Term Analysis by Ali Martinez

Meanwhile, Ali Martinez provided a short-term analysis, noting that Bitcoin is trading within a well-defined parallel channel. This channel, marked by two black lines on his chart, indicates the upper and lower boundaries. Currently, Bitcoin is near the channel’s lower boundary, around $57,200 to $57,400, which acts as support.


Martinez also highlighted the TD Sequential indicator, which is flashing a buy signal. This indicator suggests the current downtrend might be nearing exhaustion, and a rebound could be imminent. The potential rebound target is around $58,300, closer to the mid-range of the channel.

Market Sentiment and External Influences

The broader market sentiment around Bitcoin has been notably bearish, influenced by expected selling pressure from Mt. Gox creditors and the German government. However, Santiment, a market intelligence firm, predicts a likely rebound, potentially catching the market off-guard.

Despite fears of a sharp sell-off due to Mt. Gox repayments, analysts like CryptoQuant’s Ki Young Ju suggest that the movement of 47,000 BTC may not impact the market as expected. He outlined three scenarios, including internal transfers for security, that may explain the recent on-chain movements.


Circle Launches First MiCA Compliant Euro Stablecoin EURC on Base

Circle, the second-largest stablecoin issuer, has launched the EURC stablecoin on the Base blockchain, one of the first stablecoins to meet the MiCA regulation.

The firm announced the new move a few hours ago via an official statement on its website and X handle. Circle expressed delight about introducing the first euro-backed digital coin to the Base platform. 

This move enables developers and businesses to create faster and more affordable commerce solutions for global users. 

Euro Stablecoin Live on Base

Circle stressed the significance of integrating the third-largest fiat currency with Base, noting that it presents a substantial opportunity for expansion in the digital asset economy.

With this introduction, EURC joins Circle’s flagship stablecoin, USDC, which boasts over $3 billion in circulation on Base. This significant capitalization makes USDC the largest stablecoin on the network. 

Notably, USDC became natively available on the Base blockchain on Sept. 5, 2023, eliminating the need for a bridged asset.

In the latest announcement, Circle takes pride in disclosing that EURC and USDC are pioneering global stablecoins on Base to meet the stringent requirements of the European Markets in Crypto Assets (MiCA) regulation.

Circle highlighted several key benefits of USDC and EURC, including their full reserve backing, regulated status, and 1:1 redeemability for dollars and euros.

Additionally, these stablecoins facilitate seamless institutional on- and off-ramps through Circle Mint for eligible businesses. They also offer easy integration into new and existing applications and retail access to Coinbase’s global on- and off-ramp network.

Regarding their use cases on the Base network, Circle outlined several promising functionalities. These include the ability to facilitate near-instant cross-border payments and marketplace payouts at a significantly lower cost than traditional systems.

Furthermore, the stablecoins provide round-the-clock access to the decentralized finance (DeFi) ecosystem. Additionally, users can leverage EURC and USDC as a store of value in euros and dollars for savings and foreign exchange purposes, thereby hedging against inflation risks associated with local currencies.

Developers Called to Experiment EURC on Base

Meanwhile, Circle invites crypto developers to start exploring fund flows in their applications by obtaining free testnet EURC or USDC on Base Sepolia through its Testnet Faucet. This enables them to experiment and innovate without incurring costs.

Australian Securities Exchange Approves DigitalX’s Spot Bitcoin ETF

0

Australia’s ASX approves the DigitalX spot Bitcoin ETF, opening the door for institutional investment, as BTXX commences trading on Friday.

A statement by the ASX-listed digital asset fund manager reveals that DigitalX’s Bitcoin ETF will trade under the BTXX ticker. The ASX approved the Bitcoin ETF issuance in a partnership where KR Asset Management (KAM) assumes the responsibility entity’s role.  DigitalX will leverage KAM’s experience managing ASX-listed ETFs, financial services licenses, and compliance systems.

DigitalX is tapping 3iQ, a Canadian digital assets investment firm behind the initial crypto ETFs in Toronto. 3iQ will undertake the distribution role for the ETF in the international market. 

A press release by DigitalX chief executive Lisa Wade affirms that the Bitcoin ETF approval is a watershed moment for the Australian crypto investment space. 

Wade hails DigitalX’s Bitcoin ETF as facilitating Australians’ investment in BTC in a secure yet affordable manner without directly managing digital wallets. The executive adds that the DigitalX Bitcoin ETF offers ASX clients direct access to BTC through a liquid and regulated fund structure. 

Australia’s Bitcoin ETF Wave

DigitalX assures that it will lend its expertise in managing digital assets to Australians seeking cost-effective and secure access to Bitcoin. DigitalX chair Toby Hicks echoed the sentiment in celebrating a decade of ASX listing and DigitalX input in developing digital asset investments for Australians.

DigitalX’s BTXX launch comes weeks after the ASX approved VanEck’s spot Bitcoin ETF (VBTC). VanEck is among the ten US-approved Bitcoin ETF issuers, and Farside Investors data shows that the cumulative net inflow has surpassed $15 billion since January’s inception. 

DigitalX follows the footsteps of Monochrome Bitcoin ETF (IBTC), listed earlier in June on the Cboe Australia exchange – ASX’s smaller rival. Unlike the years of constant denials and delays in the US, Australia welcomes the third Bitcoin ETF in a month. 

Ethereum Records $17.9B in Spot Volume Despite 3% Drop

Ethereum (ETH) continues to command robust trading volume despite a recent 3% drop over the last 24 hours and the current bearish pressure.

The current market condition has not been especially favorable to Ethereum, the second-largest cryptocurrency. As one of the leading crypto assets, ETH has been at the forefront of the ongoing selloffs. Consequently, the token has dropped 10.33% this month, struggling to retain the $3,000 threshold.

This month’s price collapse follows an 8.62% close to June, which saw Ethereum give up the $3,700 and $3,500 psychological territories. Ethereum’s downturn is a product of its price correlation with Bitcoin (BTC), which has dropped 8.61% in July. IntoTheBlock data shows Ethereum has a 93% correlation with Bitcoin over the last month.

Ethereum Sees Increased Volume

Interestingly, despite the ongoing drop, market interest in Ethereum has not declined. Market data sourced by CoinMarketCap indicates that Ethereum’s 24-hour trading volume has not dropped below $10 billion this month. The lowest figure ETH has witnessed is $10.85 billion, recorded on July 7 during a 4.43% price dump.

Ethereum Historical Performance
Ethereum Historical Performance | CoinMarketCap

The latest data shows that Ethereum sees a $17.927 billion volume over the last 24 hours despite a 3.09% drop. This makes it the third-largest asset by 24-hour volume, only behind Bitcoin and USDT. Two of Binance’s Ethereum trading pairs command 14.54% of the global volume, boasting a combined $2.605 billion. 

Ethereum 24H Volume CoinMarketCap
Ethereum 24H Volume | CoinMarketCap

Further, IntoTheBlock confirms that large Ethereum transactions have been on the high side, with a 7-day peak of $8.62 billion on July 5. The increase in trade volume reflects sustained interest in Ethereum.

ETH Large Transactions IntoTheBlock
ETH Large Transactions | IntoTheBlock

However, data on volume alone cannot provide insights into investor behavior in terms of bullish or bearish sentiments. 

A Trend of Excess Whale Demand

Typically, increased trading volume during a steep market collapse is a sign of growing selling pressure. However, Ethereum’s price has recorded some stability in recent times, hedging off subsequent declines. This confirms that the rise in trade volume is not necessarily a direct result of increased selloffs.

Data shows that bulls have bought over 6.065 million ETH ($18.62 million) in July. In contrast, bears have sold 5.815 million ETH worth $17.9 million within the same timeframe. This indicates that the Ethereum market has seen an excess demand of 250K ETH from large whales this month.

Ethereum could leverage this increased demand for a recovery move when the broader market recovers. However, to reach greater heights, it must first conquer the resistance at $3,079, aligned with Fibonacci 23.6%. A breach of this level would help ETH reclaim the $3,200 level, with the next roadblock at $3,251.

ETH Daily Chart
ETH Daily Chart

“Shiba Inu Is Still a Puppy,” Says Shytoshi Kusama 

0

Shytoshi Kusama, the pseudonymous lead developer of the Shiba Inu ecosystem, characterizes SHIB as a puppy, suggesting that the token still has more room for growth.  

The Shiba Inu lead made this known while recounting his experience in Kyoto, Japan. 

Kusama’s Encounter with a Geisha 

Kusama said he encountered a Maiko, an apprentice of a Geisha, during his recent trip to Kyoto. Following the Maiko’s stunning performance, the Shiba Inu leader said he engaged the entertainer in a conversation. 

During the exchange, the Maiko revealed that her Geisha apprenticeship is a multi-year journey requiring patience, discipline, and mastery. The Maiko revealed that she had been learning the skill for only a year, with more years left before becoming a Geisha. 

Despite being early in her Geisha apprenticeship journey, Kusama said the Maiko has already attained celebrity status.  

SHIB Is Still a Puppy 

The Shiba Inu lead said his encounter with the Maiko stirred a reflection on SHIB’s journey and success, characterizing the token as a puppy. This analogy indicates that Shiba Inu is in its early stages and poised to achieve significant milestones in the future. 

He suggested that Shiba Inu has already achieved tremendous success, placing it among the top 10 crypto contenders. Despite this, Shiba Inu, a “token-turned-ecosystem,” has yet to reach its full potential. 

Furthermore, the lead developer attributed Shiba Inu’s successes to its decentralized nature, adding that the token has been able to achieve significant growth despite spending little to no funds on marketing. 

Shiba Inu Global Tour 

However, Kusama contended that people still struggle to understand the token’s history and ethos. Consequently, he announced plans to embark on a global tour alongside the Shiba Inu ecosystem team, engaging with prominent figures such as deal makers, celebrities, industry leaders, and companies seeking to transition to Web3 from Web2.  

“We’ve already made many strides in this direction over the past year, alongside the advancement of a robust Shib-themed technology stack that I believe will prove to the ShibArmy and to the world that we are here to stay,” the Shiba Inu lead developer remarked. 

The tour, which began last week in Kyoto, would see the team visit three other countries, including India, Canada, and Thailand. 

Bitcoin Rebound Could Catch Traders Off Guard as Bearish Sentiment Peaks on Social Media

0

Bitcoin sentiment plunges, showing a dominant bearish narrative this week, with Santiment predicting a likely rebound to catch the crowd off guard. 

The fear of a sharp Bitcoin sell-off fuels the bearish narratives that Santiment, a market intelligence firm, believes would increase the chances of BTC price rebound, potentially catching the majority off-guard. 

The recent analysis shows that traders expect the sales by Mt. Gox creditors and the German government to drag BTC into an early bearish period. Investors fear that with the long-awaited repayments from Mt. Gox underway, the resulting sell-off chaos could yield downward pressure, plunging prices lower. 

Santiment shows that this week, the Bitcoin Weighted Sentiment dropped to its lowest level in a year, representing a peak probability for price regain.

Bearish Bitcoin Sentiment

With Mt. Gox set to distribute $9 billion in Bitcoin (BTC) and Bitcoin Cash (BCH) to creditors, the Bitcoin crowd is showing increased FUD this week. Santiment revealed that traders portray the most bearish narratives on social platforms such as BitcoinTalk, 4Chan, Telegram, and Reddit.

However, the disclosure stressed that a period of high FUD levels increases the chances of a price rebound, catching the majority of BTC traders off guard. Santiment predicts a sudden uptrend in Bitcoin price will surprise most traders inclined to the bearish narrative. 

The bearish pressure follows Bitcoin’s retracement to the $53K range last week, sparking a bloodbath within the crypto scene. Bitcoin traders’ fear aligns with the prediction by finance analyst Jacob King that on-chain movements show 99% of beneficiaries of Mt.Gox repayments will sell. 

Such an incident adds to the BTC market-wide dump by the German government that fuels the bearish momentum sweeping the crypto space since June.

Historically, Bitcoin and altcoins tend to show moves opposite to the majority’s expectation.  As the crowd’s expectation gets stronger toward a further downtrend, the higher the probability of a contrary move emerges. 

Possible Bitcoin Recovery

Despite the slight gains in BTC price, market data shows Bitcoin is 17% down in the past 30 days. 

Crypto trader and influencer RookieXBT hints at a bullish return when Germany exhausts three-quarters of seized coins. RookieXBT highlights that a distribution from the defunct FTX exchanges in fiat will prompt bankruptcy victims to acquire crypto. 

Insight into the options market through Laevitas.ch shows optimism about price surge, which is evident in a -7% delta skew as put options become affordable relative to the call options. A contrary observation where the skew metric surges above 7% would signal imminent fear of corrections. 

The analysis by Santiment shows BTC traders already convinced by the widespread pessimism could lose sight of sudden price regain. Per Laevitas.ch data, the present -2% skew within the Bitcoin options portrays a healthy sentiment notable as the BTC price hovers around its lowest levels in four months.

Major XRP Price Surge Predicted: Analyst Eyes $1.88, $5.85, and $18.22 Milestones

0

XRP analyst Dark Defender highlights key Fibonacci retracement support level for XRP, pointing to several price targets, which include lofty two-digit figures.

In his latest analysis, Dark Defender identified crucial technical signals on the weekly chart, pointing towards potential significant price movements. According to his analysis, XRP has reached the latest Fibonacci support level of $0.3917 within the context of the 5 Elliott Waves. 

Notably, the analyst projects future targets at $1.88, $5.85, and $18.22. However, he emphasized the importance of maintaining a price above the $0.3917 support level to avoid structural changes.

Critical Support and Potential Reversal Signals

According to him, the $0.3917 support is the most crucial key Fibonacci level. Any breach below this level could disrupt the bullish structure. Furthermore, the RSI indicator on the chart shows that XRP is in an oversold condition, signaling a potential reversal. 

The Ichimoku Cloud, included in the analysis, highlights support and resistance levels along with momentum and trend direction. The price action seems to be interacting with the cloud, which could indicate potential support or resistance areas.

24-Hour Indicators Show Mixed Market Activity

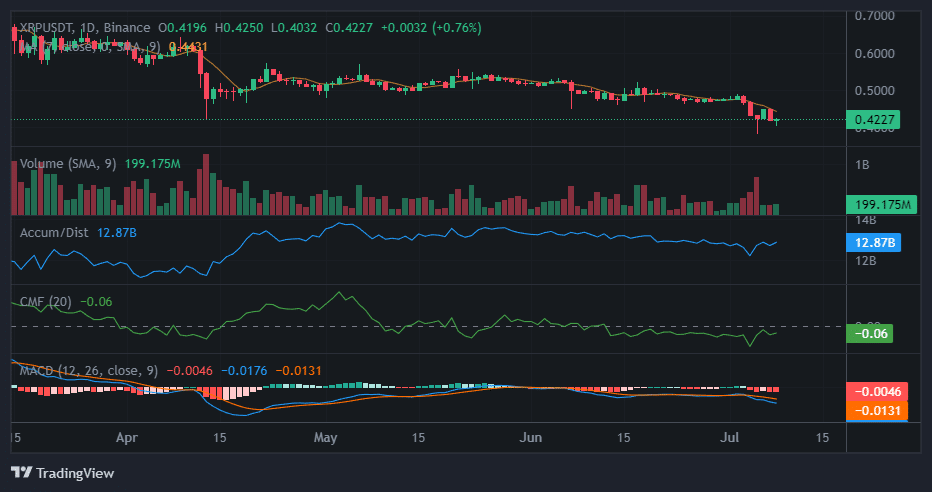
Meanwhile, XRP’s Volume (SMA, 9) remains stable but occasionally spikes, indicating higher trading activity periods. The recent volume increases suggest buying interest. In addition, the Accumulation/Distribution line at 12.87 billion trends upwards, indicating more accumulation than distribution, which points to potential buying pressure.

XRP Daily Chart
XRP Daily Chart

However, the Chaikin Money Flow (CMF, 20) at -0.06 suggests slight selling pressure. The Moving Average Convergence Divergence (MACD) with a MACD line at -0.0046 and a signal line at -0.0131 shows bearish momentum. Yet, the narrowing gap between these lines hints at a potential bullish crossover if the trend continues.

Imminent XRP Surge Amid Doji Formation

This analysis coincides with The Block Bull’s prediction of a 6,000% surge in XRP over the coming weeks, driven by a doji candle formation on the XRP/BTC weekly chart. 

This prediction emerges during a period of consolidation observed on the XRP/BTC chart, where the ratio plummeted by 77.7%, from a high of 0.00002970 last July to a low of 0.00000662 in June. This decline was attributed to Bitcoin’s higher highs while XRP’s growth remained stunted.

The XRP/BTC ratio’s current downtrend has paused, leading to a consolidation phase. Within this phase, a dragonfly Doji candlestick was formed during the weekly timeframe. The previous weekly candle saw the XRP/BTC pair open at 0.00000758 and close at 0.00000751, creating the Doji.

Here Are Shiba Inu Addresses Making Money as SHIB Trades at $0.0000165

0

Despite Shiba Inu’s devastating collapse over the past few months, nearly half of all blockchain addresses holding SHIB are currently in profit.  

Shiba Inu (SHIB) investors are feeling the heat of the market downturn as the token continues its bearish performance. 

SHIB has plunged to the $0.000016 level despite showing signs of recovery over the weekend. At the current exchange rate of $0.0000165, SHIB has registered a decline of 1.15% in 24 hours, 3.48% in seven days, and 28.71% in the past month. 

Addresses Making Money at Current Price 

Contrary to expectations amid the recent downturn, many Shiba Inu addresses are still profitable, surpassing those holding the asset at a loss.

Data from IntoTheBlock (ITB) shows that 49% of all 1,396,038 (1.39 million) Shiba Inu addresses are currently in profit or making money at the current price. 

Most of these addresses bought SHIB at an average price of $0.000010. Specifically, 369,240 addresses acquired 155.87 trillion SHIB at this level. The 155.87 trillion SHIB tokens are worth $2.57 billion at press time. 

Similarly, another 215,610 addresses scooped 68.25 trillion SHIB ($1.12 billion) at an average price of $0.000007. 

Conversely, 48% of addresses currently holding SHIB are “out of the money” or at a loss, with the token priced at $0.0000165. At this price, only 4% of all Shiba Inu addresses are currently at break even at the current price, suggesting that they are neither making money nor losing. 

Shiba Inu’s profitability ratio has declined heavily from the figure recorded in April, which put the number of addresses in profit at 63%. At the time, SHIB was priced at $0.00002652 per token. 

SHIB Holdings By Time Held 

Furthermore, ITB’s data also provided insights into the duration at which investors have been holding on to SHIB. According to the data, 77% of all Shiba Inu addresses are categorized as ‘holders,’ given that they have been holding SHIB for over a year. 

In addition, 21% of all addresses are tagged as “cruisers” for holding SHIB between 1 and 12 months, while 2% are holding for less than 30 days. 

This VeChain Wave Could Propel VET Price to Between $1.5 and $1.8

0

VeChain (VET) could see its price surge to astronomical levels as it prepared to slip into bullish waves amid the imminent end of a corrective Wave 2.

The ongoing fluctuations in the crypto market has also imapcted VeChain (VET), but it remains on a bullish trajectory. The asset stands out with its resilient performance and optimistic future projections. Analyst Egrag recently shared an analysis on X, highlighting a potential bullish wave for VET. 

According to his wave analysis, VET is nearing the end of corrective wave 2 and is poised to enter wave 3, typically the strongest and most explosive phase. This wave is projected to push VET’s price significantly higher, potentially reaching between $1.5 and $1.8.

Egrag’s analysis indicates that VET is completing wave 2 of a 5-wave Elliott Wave sequence. The anticipated wave 3 is expected to propel VET upwards, with projected targets of $1.5 to $1.8. 

The chart identifies key support and resistance levels crucial for maintaining this bullish outlook. Notably, VET is holding above a significant support zone at $0.03, marked in white on the chart. This zone is vital for sustaining the bullish structure and advancing towards the targets.

Descending Channel and Trendline Breakout

Elsewhere, another analyst, World of Charts, highlighted a descending channel formation in VET’s daily timeframe. Since February, VET has been trading within this descending channel, characterized by lower highs and lower lows. 

Currently, VET is near the lower boundary of the channel, indicating a potential bounce. A recent trendline breakout in the lower time frame suggests that the downtrend might be losing momentum, signaling an imminent reversal. The analyst believes this breakout could lead to a significant price increase, potentially doubling VET’s value to around $0.06, 160% up from current levels.

Promising Movements for VeChain

Interestingly, a previous analysis by Egrag suggested VET’s price would rise to $1.6, driven by the formation of a triple bottom pattern and the application of the Cloning Technique.

Egrag explained how the Cloning Technique, applied to a previous significant rally, signals promising movements for VET. He highlighted this with an accompanying chart showing the potential for substantial price increases.

As of the latest data, VeChain’s price stands at $0.025206, with a 24-hour trading volume of $54,732,925, marking a 3.59% increase in the last 24 hours.

Shiba Inu Set for Rise to $0.00015 as SHIB Holds Above Key Resistance: Analyst

Javon Marks, a prominent market analyst, predicts an imminent price pump for Shiba Inu, as it holds above a key resistance level despite the recent crash.

Marks expressed this opinion in an updated analysis on Shiba Inu. Notably, data from an accompanying chart confirms that SHIB traded below a resisting trendline for 448 days after it dropped from the all-time high of $0.00008845 in October 2021. 

SHIB Holds Above Resisting Trendline

However, Shiba Inu broke above the downtrend resistance when it spiked to a high of $0.00001575 in January 2023. Since then, SHIB has traded above the resisting trendline.

Marks had emphasized that this trend confirms Shiba Inu’s imminent price pump to substantial levels. 

However, with the latest market turbulence triggering a 40% collapse since June, sentiments have turned bearish. Despite the price crash and the bearish sentiments, Marks remains confident.

In his latest analysis, he stressed that SHIB remains above the resisting trendline. According to him, this indicates that the projected uptrend is still possible. The analyst sets two targets for Shiba Inu on the back of the anticipated recovery.

The first target rests on the $0.000081 level, a goal he has continued to advocate for. Marks noted that the $0.000081 level, which would demand a 405% increase in SHIB’s price, has not changed. He previously set this target in mid-June and has maintained conviction that it will materialize.

Shiba Inu Targets $0.0001553

Marks places the second target at $0.0001553, essentially indicating a new all-time high price for Shiba Inu. SHIB currently trades for $0.00001595, with a pump to the $0.0001553 target requiring an 873% increase. 

However, the token must break above its immediate resistance levels before eyeing these lofty targets. Shiba Inu continues to battle the bears at $0.000016, with the first major resistance stationed at $0.00001667. A breach of this roadblock could give SHIB a free ride toward the 38.2% Fibonacci retracement level ($0.00001912).

Shiba Inu Daily Chart

Nonetheless, bulls need to decisively close above the 20-day SMA ($0.00001697) before a push toward $0.00001912 could ensue. Interestingly, market analyst Santana suggested that, while SHIB could spike above the current territory, it would witness one final slump before staging this recovery.

CryptoQuant data indicates that SHIB’s RSI is at 46, while its Stochastic RSI flashes 55. These figures suggest that SHIB is neither overbought nor oversold, indicating potential consolidation. The recent stop in price declines and slight rise before consolidation suggests a possible shift in momentum. However, this remains uncertain.

Shiba Inu RSI and Stoch
Shiba Inu RSI and Stoch | CryptoQuant