Home Blog Page 1425

PEPE Meme Coin Hits $41 Billion 30-Day Volume, Surpassing XRP, Shiba Inu 

Data shows that the PEPE meme coin has attracted more significant interest in the past few days than more prominent assets like XRP and Shiba Inu. 

This heightened interest is particularly observable in the cumulative trading volume PEPE garnered in the last 30 days.

PEPE Beats XRP, Shiba Inu in 30-Day Volume

According to CoinMarketCap, PEPE achieved a staggering 30-day trading volume exceeding $41 billion. During this time, market participants traded 2.86 quadrillion PEPE tokens.

However, XRP, the seventh most valuable crypto, recorded a trading volume of $34.2 billion during the same period. This falls short of PEPE’s volume by $6.8 billion.

In the past day, despite XRP registering positive gains while PEPE traded in the red, the meme coin still managed to secure a higher 24-hour trading volume than XRP.

Furthermore, PEPE’s volume over the last month has also outperformed that of other major cryptocurrencies besides XRP. Specifically, it has eclipsed Dogecoin’s 30-day trading volume by $16 billion. Similarly, Shiba Inu posted a 30-day trading volume 50% less than that of PEPE.
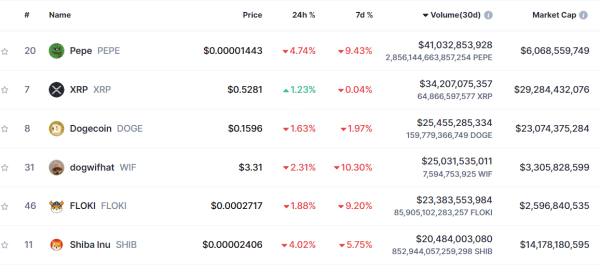
Pepe and other tokens 30 day trading volume
Pepe 30-day trading volume | CoinMarketCap

Earlier in the day, it was observed that PEPE’s 30-day volume stood at least $400 million greater than that of Solana (SOL), although Solana later surpassed the meme coin. This milestone was highlighted by X pseudonymous X user KingChad.

PEPE Sets New ATH

Significantly, PEPE’s appeal surged over the past month due to its remarkable price rally. Before the Bitcoin-led mini bull run a fortnight ago, PEPE had already experienced substantial growth. It soared by 51.5% from $0.000007629 to $0.00001156, effectively eliminating a zero from its price within a week, before experiencing a brief retracement.

Subsequently, when Bitcoin sparked renewed enthusiasm in the crypto market by reaching a high of $71,946 on May 21, PEPE embarked on another dramatic rise. This momentum propelled PEPE to a new all-time high of $0.00001718 on May 27. 

During this time, PEPE even knocked out Polygon (MATIC) to rank as the 18th biggest crypto project with a market cap exceeding $7 billion. However, MATIC has reclaimed its position, given PEPE’s value of $0.00001441 at press time.


Top Exchange Shares New Update About This Shiba Inu Trading Campaign 

0

Crypto enthusiasts stand a chance of winning up to 1 ETH or $100 in ETH when they trade at least $5 worth of Shiba Inu (SHIB) on Crypto.com. 

Crypto.com has called the public’s attention to its ongoing campaign, which involves the trading of Shiba Inu and other Ethereum-based meme coins. 

Details of the Campaign 

According to a recent post, Crypto.com reminded its followers that the Ethereum Meme Campaign, which commenced on May 30, will end tomorrow, June 5, at 06:59 (UTC). 

Notably, the total prize pool for the event is $10,000 worth of ETH. Per the announcement, Crypto.com users can win up to 1 ETH ($3,761) or $100 in ETH when they trade a minimum of $5 worth of SHIB or six other Ethereum-based meme coins. 

The other selected meme coins include Dogelon Mars (ELON), Floki (FLOKI), Gekko HQ (GEKKO), Milady Meme Coin (LADYS), Mog Coin (MOG), and Pepe (PEPE). 

Notably, the campaign is divided into two distinct categories. 

First Event 

For the first category, Crypto.com will select 100 users who successfully trade the aforementioned Ethereum-based meme coins during the campaign. The winners will be determined by their cumulative trading volume of the selected meme coins.  

Crypto.com said the selected winners in this category will be rewarded with $100 worth of ETH each. 

Second Event 

In the second phase, Crypto.com users must trade at least $5 worth of the selected Ethereum-based meme coins to stand a chance of winning up to 1 ETH. Notably, the exchange will select three eligible participants via a lucky draw. Users selected under the Tier 1, 2, and 3 categories will receive 1 ETH, 0.5 ETH, and 0.1 ETH, respectively. 

SEC’s Approval of Ethereum ETF 

Crypto.com’s Meme Campaign comes weeks after the U.S. SEC approved exchange applications to list spot-based Ethereum ETFs. While the Ethereum ETFs have not started trading in the U.S, the SEC’s approval caused the price of ETH to surge to nearly $4,000.   

The rally also extended to Ethereum-based meme coins, like Shiba Inu, as the asset surged over 16% on May 29 to enter the list of top 10 cryptocurrencies by market cap. 

At press time, Shiba Inu ranked as the 11th-largest cryptocurrency, with a market cap of $14.15 billion. The dog-themed token was trading at $0.00002403, marking a 24-hour decline of 4.93%. 

Shiba Inu in Market: Analyzing SHIB Price Relationship with Bitcoin and Ethereum

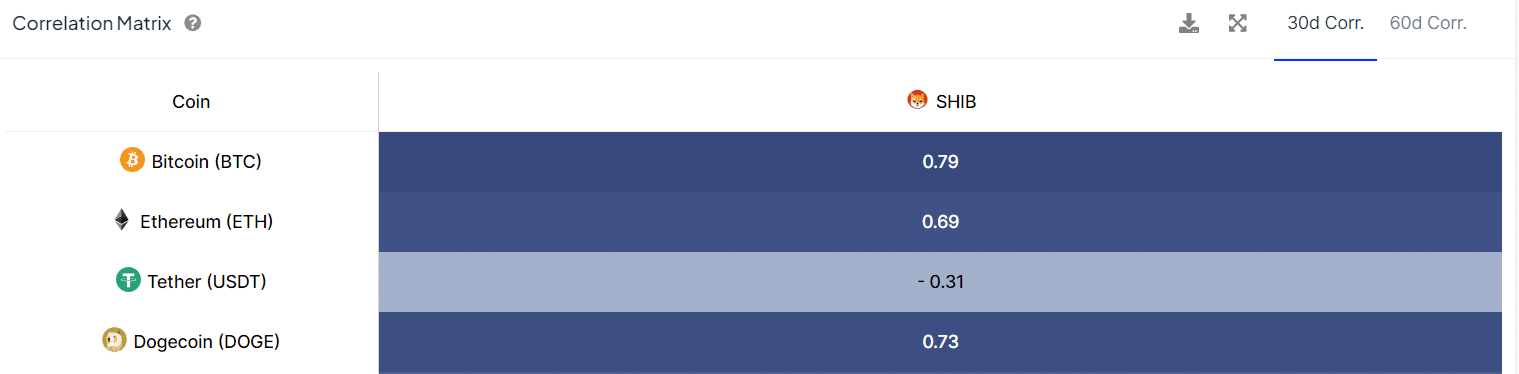
Data shows that the Shiba Inu price has closely followed Bitcoin price movements more than any other asset, with SHIB and BTC boasting the highest price correlation matrix over the last 30 days.

Shiba Inu (SHIB) has been a beneficiary and victim of broader market trends depending on their direction. When the market records an uptrend, Shiba Inu typically records price upswings. However, during a market downtrend, SHIB witnesses substantial declines. 

Shiba Inu Trails Bitcoin

This pattern has prevailed throughout this year, with a notable impact in late April. Bitcoin dropped 15% from a $66,000 high on April 23 to a $56,000 floor price on May 1. This value represented Bitcoin’s lowest price in three months. 

Interestingly, Shiba Inu followed a similar trail, having collapsed from $0.00002689 on April 23 to a low of $0.00002057 on May 1. This marked a 23.5% drop within the same period that Bitcoin recorded similar downward pressure. The price drop witnessed by Shiba Inu and Bitcoin is a product of their strong correlation.

Shiba Inu Price Correlation with BTC

Market data sourced by IntoTheBlock shows that Shiba Inu boasts a 79% correlation with Bitcoin in the last 30 days. This indicates that Shiba Inu’s price movements have had a strong positive correlation with Bitcoin’s price movements. In contrast, Cardano (ADA) only has a 62% correlation with Bitcoin within this period.

Shiba Inu Price Correlation with Bitcoin IntoTheBlock 124259
Shiba Inu Price Correlation with Bitcoin | IntoTheBlock

While this trend can be positive for Shiba Inu, it also paints a concerning picture. For instance, if Bitcoin faces turbulence due to market headwinds, SHIB is not likely to buck the overall market trend. This is observed in recent price action, where Shiba Inu has now dropped alongside BTC.

Bitcoin faced major resistance at the $70,000 level yesterday, resulting in a drop toward $68,000. This drop has impacted Shiba Inu’s price, compounding the existing bearish pressure it already faces. SHIB has recorded six consecutive losing days since May 30, down 6.17% this month. 

The Crypto Basic confirmed earlier that Shiba Inu has a history of recording losses in June. Notably, Bitcoin has not recorded as much loss as Shiba Inu during the ongoing downturn due to its greater resilience. SHIB typically features higher volatility. As a result, during market declines, it faces steeper drops.

However, this also means that Shiba Inu witnesses higher price surges during an uptrend. For instance, SHIB spiked 370% between late February and early March to $0.000045. Meanwhile, Bitcoin only saw a 33% increase within this timeframe.

Shiba Inu Price Poised for Follow BTC’s Upsurge

SHIB’s high correlation with BTC is a generally positive sign, especially with Bitcoin poised to reach greater heights. As a result, analysts who have projected lofty BTC prices for this market cycle also believe Shiba Inu would record greater rallies. Market pundit Armando Pantoja expects SHIB to hit $0.001 when BTC reaches $100,000 to $250,000.

Meanwhile, Shiba Inu only has a 69% price correlation with Ethereum (ETH) and a 73% correlation with Dogecoin (DOGE). SHIB currently trades for $0.00002383, with its Accumulation/Distribution metric indicating a sharp drop in investor holdings, having collapsed from 28 trillion SHIB on May 28 to the current figure of 12.6 trillion.

Solana Price Forecast: SOL Eyes $180 Retest as Bulls Make $150M Move

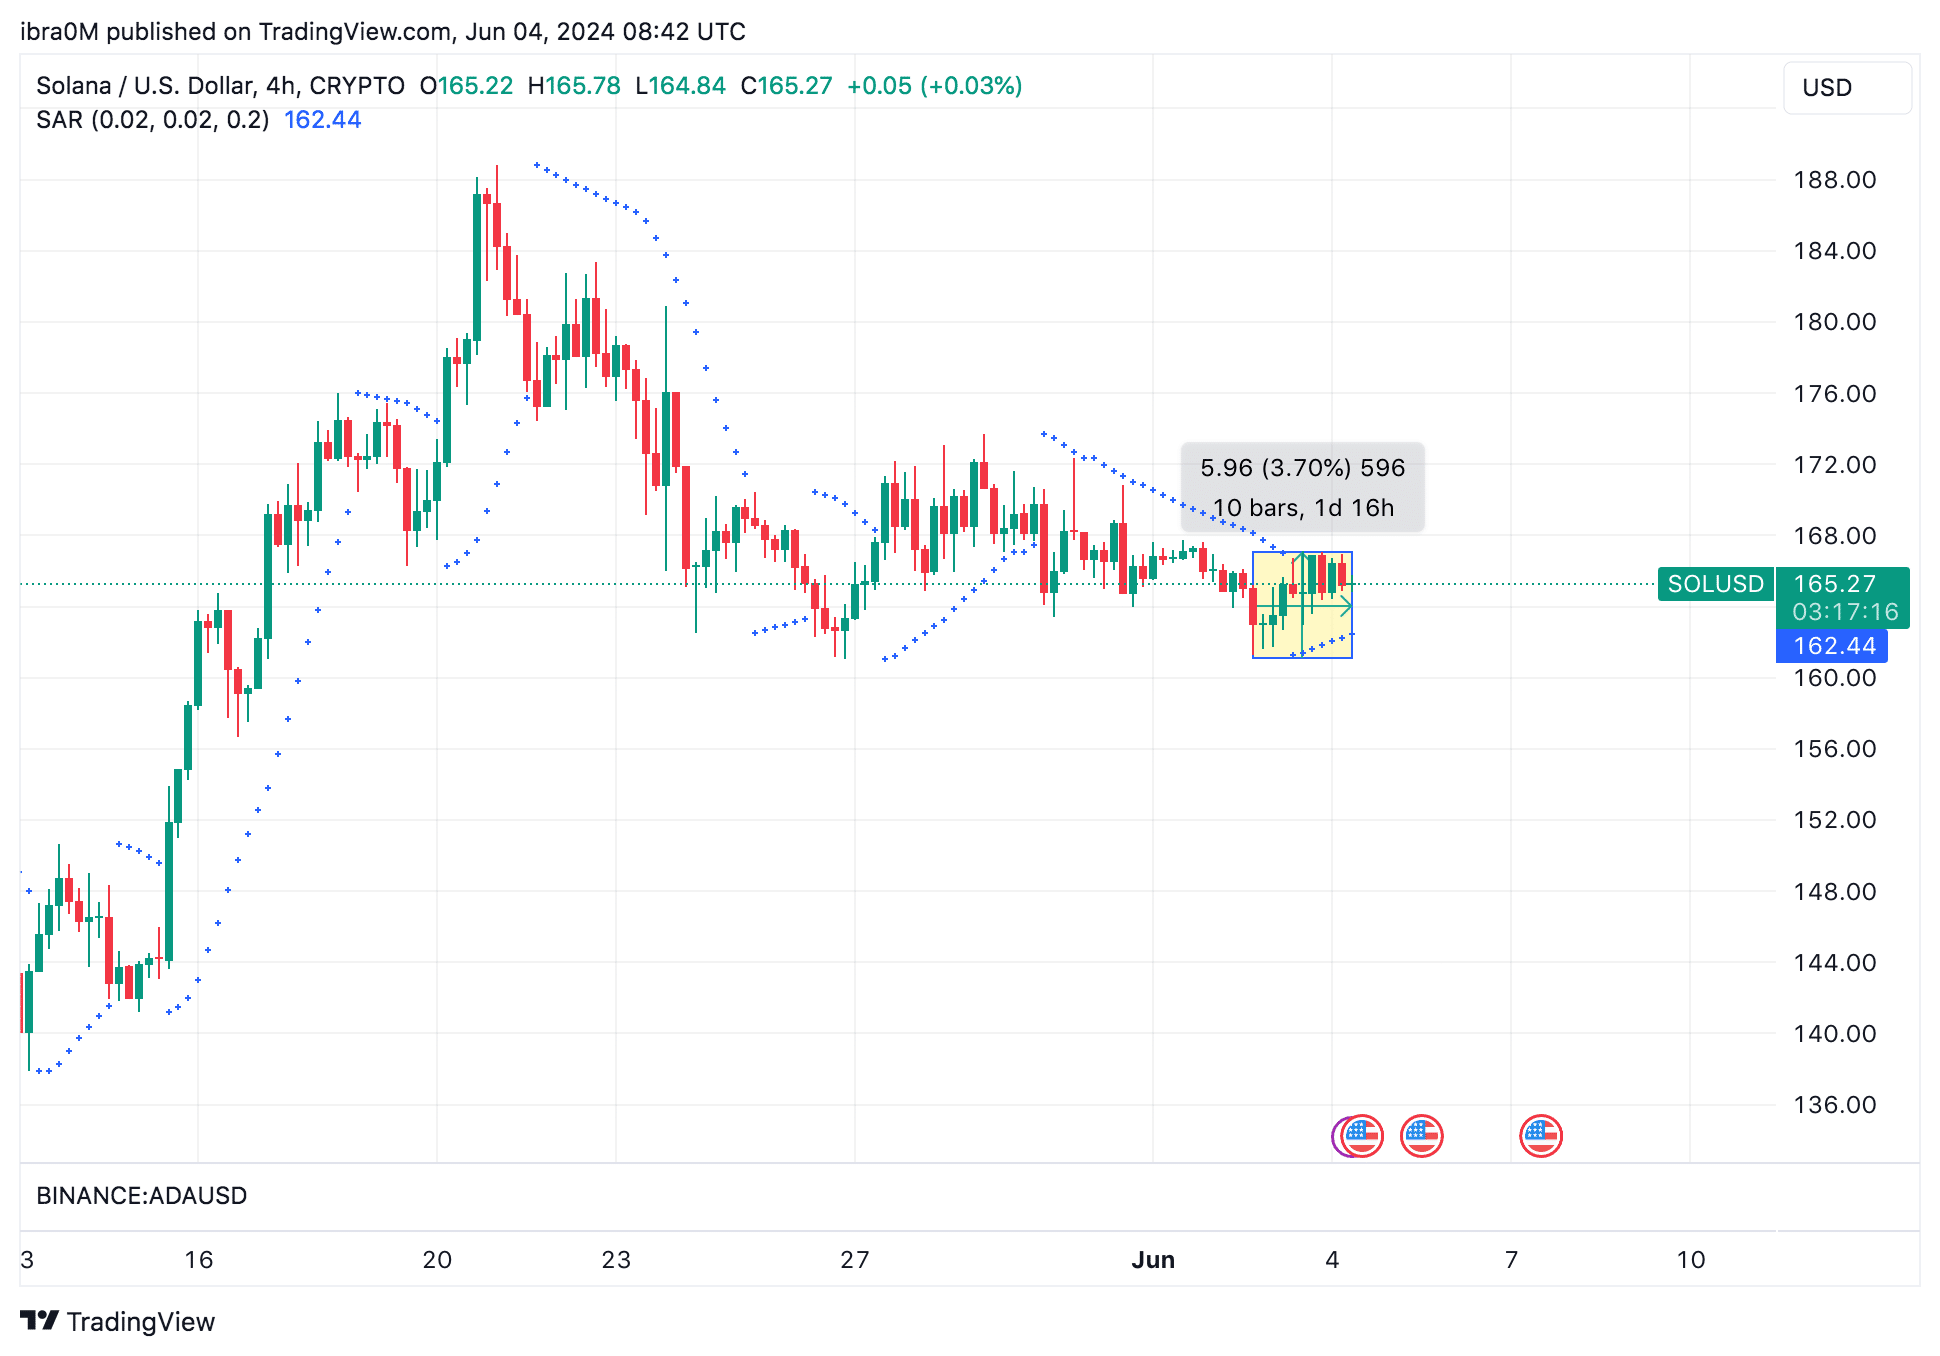
Solana’s price broke above $165 on June 4, 2024, and has been up 4% in the last 3 days; however, mounting LONG positions suggest more upside could follow. 

Solana Price Reverse Last Week’s Losses

In the last week of May, Solana’s price struggled for traction as the spot ETH ETF’s approval on May 23 attracted investor attention and capital towards Ethereum DeFi and spot markets. However, as the euphoria surrounding the landmark approval cools off, demand for Solana has taken a positive turn since the start of June.


Solana (SOL) Price Action | TradingView

Looking at TradingView’s daily price chart, SOL price has increased from $161 on June 1, to establish a steady support base above the $165 mark at the time of writing on June 4.

This sustained 4% surge over the last 72-hours suggests bullish momentun is now returning to the SOL markets, following the ETF approval euphoria, that saw invest divert capital towards the Ethereum ecosystem.

Traders Deploy $150M Leverage as Bullish Momentum Returns

Another key indicator of the growing bullish sentiment across Solana markets is the unusually high leverage LONG positions mounted by speculative traders this week.

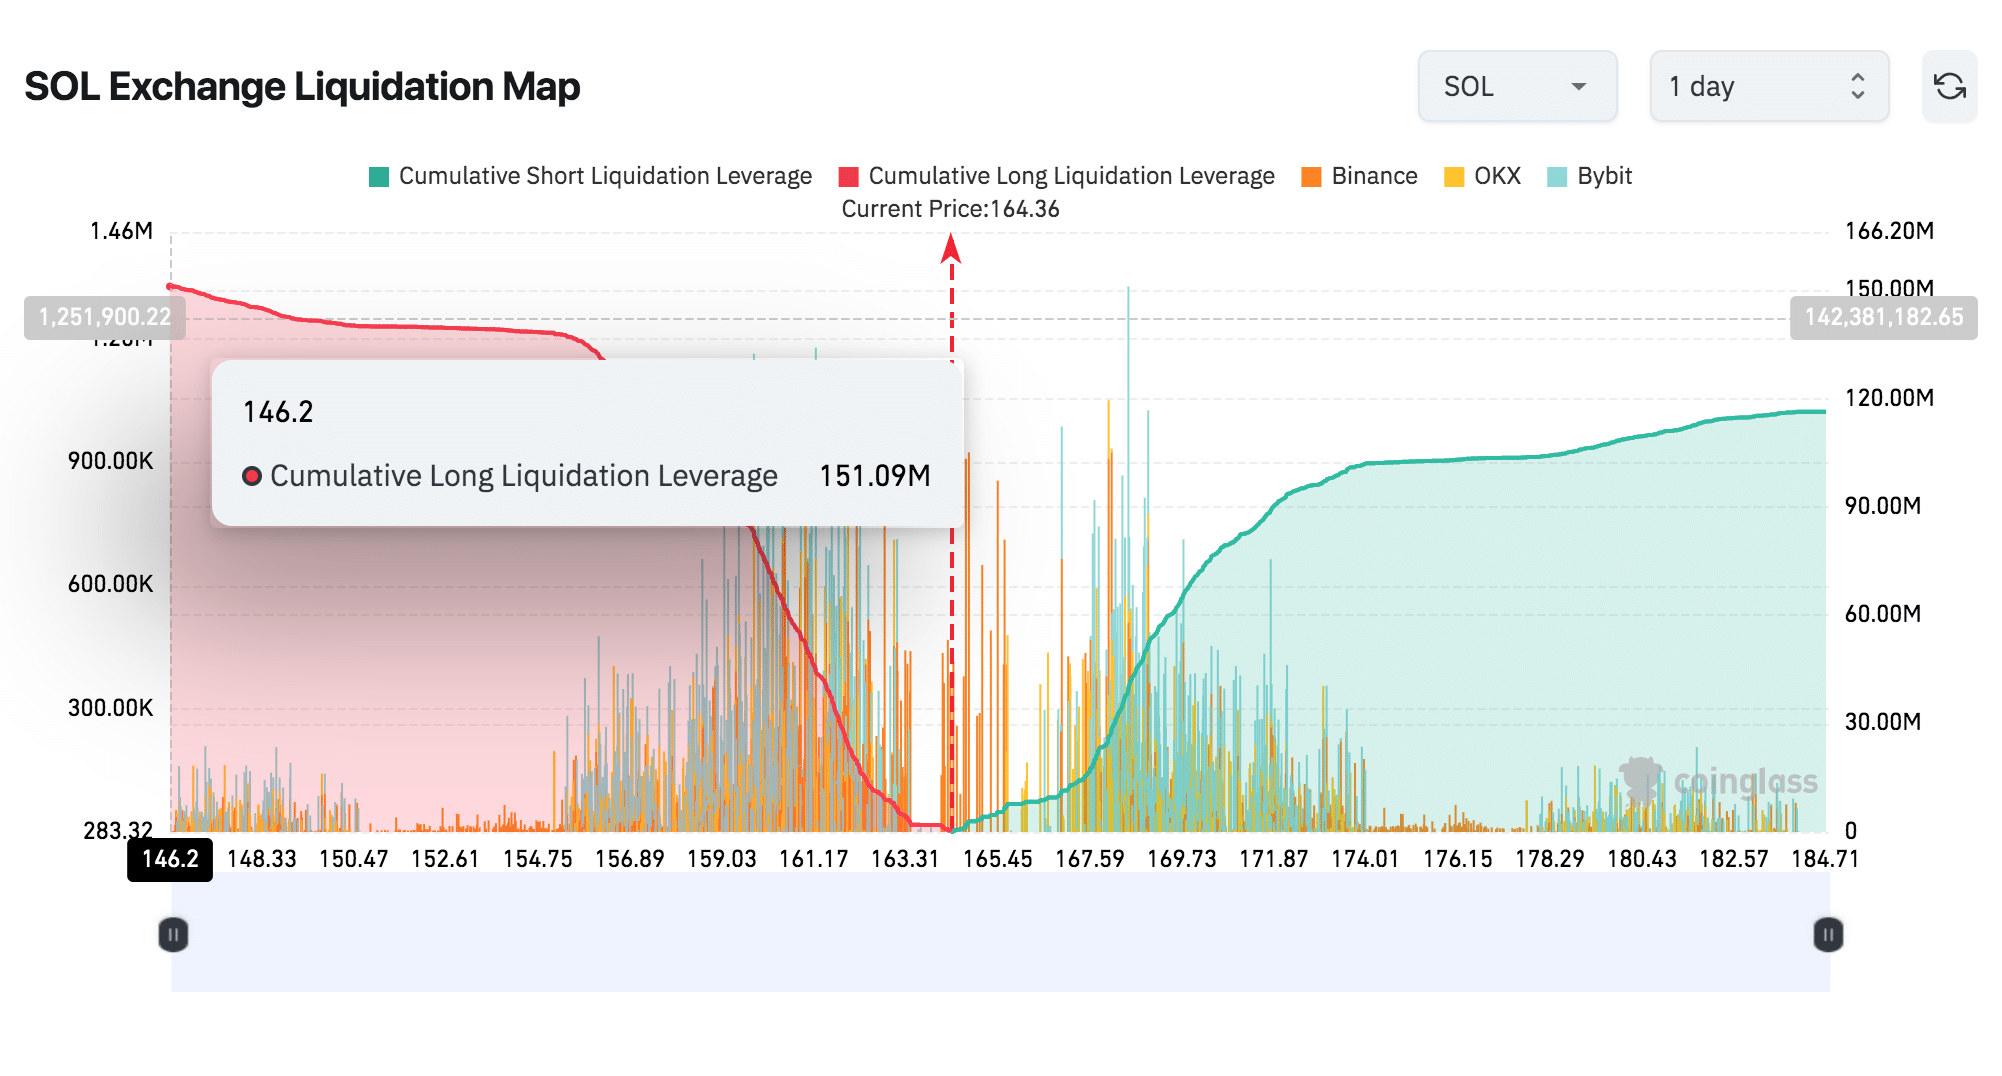
Coinglass’ Liquidation map data tracks the amount of leverage contracts currently listed for a specific asset across recognized derivatives trading platforms. It provides clear insights into changes in investor sentiment for the assets’ short-term price prospects.

Solana price vs. SOL Leverage SHORT/LONG Contracts | Coinglass

Solana futures markets attracted an influx of LONG positions this week, far outpacing the volume of active SHORT contracts. As seen above, bull traders have deployed $151.09 million leverage on LONG positions with the 20% boundaries of the current prices.

Meanwhile, the total volume of SHORT contracts stands at $110 million. This $41 million shortfall means that bull traders have taken on more aggressive positions, with growing confidence that spot prices will rise further and yield amplified profits in the days ahead.

Essentially, the chart shows that bulls now have more skin in the game and are more likely to make additional spot purchases to earn quick profits on their high-risk leverage positions.

With Solana’s price currently trading for $165, another major breakout towards $180 could be on the cards if this scenario plays out.

However, if markets enter another downtrend, SOL price will likely find formidable short-term support around the $155 level. Considering that over 90% of the $150 million leverage contracts are listed between $164 – $154, hence, Solana could attract significant demand within this channel, as bulls look to avoid major liquidations.

XRP Price Consolidates Inside Symmetrical Triangle Near $0.52; Where Will The Breakout Happen?

XRP Price remains lackluster, and trades are in a very limited range, confirming a lack of interest among investors.

Despite the whales buying $299 million worth of coins in a single day, the price failed to convert into a bullish price action. As of writing, XRP/USD is exchanging hands at $0.52, marginally up at $0.07% for the day.

In the latest development, Ripple is also reported to sell 400 million XRP tokens this month. The move is to align the XRP’s holding, market operations, and price volatility.

xrp
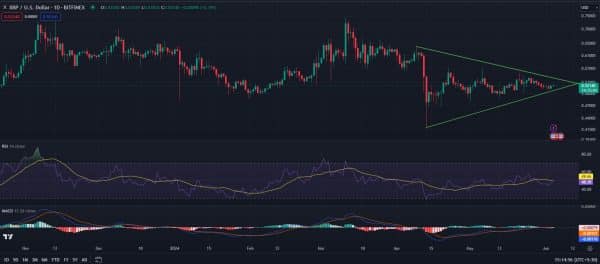
XRP Daily Chart

Technically speaking, XRP/USD is trading inside a short-term consolidation. Where the downside is capped near $0.48 and the upside seems limited near $0.54. Currently, the price is struggling near the critical trading area of $0.52. This is a key psychological zone, which acts as a resistance zone now reversing from the role of the support area. After making the high of $0.74, the price depreciated nearly 46% in April.

Since April, the XRP price has been struggling to gain any meaningful traction. The formation of the “ Symmetrical Triangle,” a neutral technical formation, indicates waning traders’ interest. Inside the triangle formation, the lows have been slanting higher since April 13, and the highs are decreasing in a tight range. 

Technical indicators:

RSI (14): The momentum oscillator Relative Strength Index (RSI) reads 48. This also confirms the ongoing tussle between bulls and bears. Any shift in the momentum could result in the upside breakout of the price pattern.

MACD:  MACD (Moving Average Convergence Divergence), another oscillator held near the central line. This again shows a lack of directional conviction among traders.

Support and Resistance

If the bulls win the battle then the first resistance shall meet at $0.56, moving further toward $0.61. 

On the other hand, the support of the XRP price is lying around the bearish trendline of the symmetrical triangle at $0.50. A break below this level will open the gates for $0.46.

In the end, it should be advisable for the traders to wait for the confirmation or the breakout of the price pattern before taking any directional bets.

Germany’s Largest Bank to Enhance Crypto Banking with Bitpanda Partnership 

0

Bitpanda integrates Deutsche Bank for real-time payments, with Deutsche Bank enabling Bitpanda users to access local IBANs.

Austria-based crypto trading platform Bitpanda is set to start cooperation with Germany’s largest bank, Deutsche Bank, to allow users to make instant payments. Bitpanda announced this partnership in a press release today, with plans to widen its cryptocurrency service offerings within Europe.

Real-Time Payment Integration

Founded in 2014, Bitpanda claims to have over 4 million customers and offers products such as precious metals, cryptocurrency, and fractional stocks. In Germany, Deutsche Bank will facilitate the instant deposit and withdrawal of all fiat currencies on the Bitpanda platform.

This integration involves offering Bitpanda clients local International Bank Account Numbers (IBAN) options to enable them to make secure purchases. The collaboration aims to provide seamless USDT purchases and instant deposits and withdrawals for German Bitpanda users.

This is the latest partnership from Bitpanda aimed at bolstering crypto adoption. Two months back, the platform entered a partnership with LBBW, the biggest federal bank in Germany, to render custody services to institutions. Last month, Bitpanda also extended its collaboration with Raiffeisenlandesbank to 55 new banking institutions.

Deutsche Bank Exercises Caution in Crypto Partnerships

In a statement about the partnership, Ole Matthiessen, the worldwide head of cash management at Deutsche Bank, noted that the Bank is very cautious when selecting companies in the crypto space with which to cooperate. 

He said the bank only partners with a few select partners with a track record of complying with local regulations.

The crypto industry has had issues establishing stable banking relationships where clients can deposit and withdraw funds easily. This has been made worse by the closures of many banking subsidiary companies that branded themselves as crypto-friendly, including, Signature Bank, Silvergate and Silicon Valley Bank in 2023. 

These conditions impacted many crypto firms by the emergence of a shortage of banking services that should fill the existing market need for proper banking offerings. However, with proper regulations, 

Cardano Price Forecast: ADA Trading Volume Hits $300M, What Happens Next?

0

Cardano price rebounded above the $0.45 territory on June 4, after weeks for bear dominance, recent market trends suggest that ADA bottom is in and bulls could gain foothold in the days ahead. 

Cardano price Reverses Downward Trajectory in June

In May 2024, Cardano emerged one of the worst-performing assets in the top 20 market rankings, closing the month with a -12% decline between May 21 and May 31. The ADA price struggles was attributed to negative impact of the Ethereum ETF approvals on rival layer-1 networks.

However, with the ETF’s official launch still hanging in the balance, investor euphoria has cooled off significantly since the turn of the month.

Cardano Price Action (ADA/USD) | TradingView

The falling ADA prices appear to have attracted savvy investors looking to enter the fray at a discount. Since, Cardano price dipped below the $0.44 of May 31, there has been a significant uptick in demand for ADA.

As seen in the chart above, ADA’s price has now surged 4.4% within the first four days of June, adding over $500 million to its market cap in the process.

Cardano Trading Volume Hits $300M after Weeks in Decline

After four consecutive green candles, bulls have evidently now gained a foothold in the Cardano markets. However, a closer look at ADA trading volumes during this uptrend period leaves clues of a much larger price breakout ahead.

Santiment chart below presents the dollar value of all trades involving ADA on a given day.

Cardano price vs. ADA Trading Volume | Santiment

As Cardano struggled to find the demand in the last week of May 2024, the trading activity dwindled, driving the 24-hour volume to a 30-day low of $166 million on June 1. However, the downward trajectory has flipped since then, as the bulls began June 2024 on a strong foot.

At the time of writing on June 4, Cardano trading volume has surged above $300.63 millionas depicted by the blue trendline in the chart above. This reflects an increase of $132 million in new demand over the last 4 days.

When trading volume increases significantly after a major price trend reversal, it suggests strong market interest and participation.

This often indicates that the new trend may have substantial support and could continue as the increased volume confirms the momentum behind the price movement. Traders and investors view the rise in volume as a sign of conviction in the new trend, potentially leading to further price increases.

Cardano Price Forecast: Imminent Breakout above $0.50?

Cardano’s price has surged 4% in the last four days, with trading volume increasing by over $130 million. With the growing bullish moment across the ADA markets in June 2024,  a short-term ADA price breakout above $0.50 could be on the cards.

However, IntoTheBlock’s GIOM data identifies the $0.48 territory as the major resistance level to beat in the near term.

Cardano (ADA) Price Forecast | IntoTheBlock

As seen above, 231,450 addresses had acquired 2.91 billion ADA at an average price of $0.48. Considering they had been holding at a loss for weeks, many of those holders could opt to book early profits.

In this scenario, if ADA price can manage to scale that major sell-wall at $0.48, they gain momentum and extend the rally above the $0.50 milestone.

But conversely, if the bulls succumb to another correction phase, the $0.44 cluster could offer significant short-term support.

Pepe Meme Coin Secures Listing on Leading Crypto Lender Nexo

0

Nexo, a leading crypto exchange and lending platform, has announced the addition of the meme-inspired Pepe (PEPE) token to its offerings.

Nexo, a crypto exchange and lending platform, has added the meme-inspired Pepe (PEPE) to its offerings. Inspired by the popular internet meme character, Pepe the Frog, PEPE has been dubbed as “the most memeable memecoin in existence.” 

Investment Opportunities and Features

Nexo provides multiple features for users interested in Pepe. As indicated on the official website, users can purchase Pepe quickly and securely using credit/debit cards or instant bank transfers, starting with just a $1 investment. 

Nexo also offers up to 0.5% cashback on Pepe purchases and guarantees no hidden fees, claiming competitive market prices compared to the top 10 crypto exchanges globally. The platform supports instant SEPA (Single Euro Payments Area) and FPS (Faster Payments Service) transfers for Pepe transactions.

During this press, Pepe’s current price on Nexo is $0.00001, showing a 6.79% decline over the last 24 hours. Despite this, Pepe has a market capitalization of around $5.94 billion and is ranked 23rd by market cap. The 24-hour trading volume for Pepe exceeds. $798 million. With its all-time high price at $0.00002, PEPE is down 17.64% from its peak. 

Utilizing Pepe on Nexo

Nexo offers a variety of options for users to leverage their Pepe holdings. On Nexo, users can seamlessly exchange any supported asset for PEPE with no fees and at a fixed execution price. The platform also facilitates borrowing funds starting at 2.9% APR without the need to sell one’s PEPE holdings, through their Instant Crypto Credit Lines feature. 

Additionally, users can spend the value of their Pepe while earning up to 2% back in crypto rewards. The Nexo Booster functionality allows customers to leverage their Pepe holdings to acquire up to three times more of other desired cryptos. Furthermore, Nexo enables free and instantaneous PEPE transfers between users with Nexo accounts.

Market Position of Pepe

Despite a recent global market correction, Pepe has defied expectations and secured a spot among the top 20 cryptocurrencies by market capitalization, per recent reports by The Crypto Basic. 

According to data from CoinMarketCap, PEPE has seen a remarkable 825% increase in value over the past year. Introduced in April 2023, the frog-inspired token swiftly gained traction, reaching a $1 billion market cap within a few weeks of its launch. 

Currently, PEPE maintains a strong presence in the meme coin market, boasting a valuation of $5.8 billion. This growth trajectory has positioned PEPE as one of the most successful and noteworthy meme coin debuts in 2023, outperforming several rivals in the same niche.

Market Expert Predicts Terra Classic to Make a 63% Leap to $0.0002143

0

Analyst Javon Marks believes that the Terra Classic bullish breakthrough may be in its early stages, projecting a further 63% gain to potentially hit $0.00021439.

Terra Classic’s price has soared to new post-breakout highs, sparking considerable interest among investors and analysts with its impressive performance. According to crypto analyst Javon Marks, this breakout could indicate a potential upward surge of another 63%, targeting a price of $0.00021439.

Such a rise would represent a remarkable pace, suggesting that the current rally might only be in its early stages.

LUNC/USDT Price Movements

A detailed examination of the LUNC/USDT pair shows a descending trendline with multiple touches, indicating resistance. This resistance has been evident since early March when the price reached a high of approximately $0.00025000 zone.

Throughout this period, the trendline applied considerable pressure on the LUNC market, pushing the price to a low of roughly $0.00007000. Despite the prevailing downward trend, LUNC eventually broke above the descending trendline, indicating a potential bullish reversal.

Consequently, Javon Marks has monitored this breakout, indicating that it could merely mark the beginning of a much larger upward movement.

LUNC/USDT to $0.00021439

Marks has repeatedly referenced the price goal of $0.00021439 in several assessments, identifying it as a crucial level to monitor in the coming weeks. He is confident that the LUNC bullish breakout is targeting this level and will occur in the near future.

Furthermore, in another analysis by The Crypto Basic, the same analyst, Marks, noted that LUNC might shatter his initial $0.00058046 objective to hit the second target of $0.00098584, noting the recent advance to its all-time high.

According to the analysis, following this, Terra Classic is anticipated to reach a high of $0.001391. This marks a 1,134% increase from its present price of $0.0001172. Meanwhile, in a different report published by The Crypto Basic, experts in the industry forecast that the Terra Classic token will surpass $0.000200 in the coming months.

Ripple May Dump Record 400 Million XRP This June: Here’s Why

Prominent crypto payment firm Ripple may be set to offload as much as 400 million XRP this June, negating past trends.

This inference is drawn from Ripple’s atypical XRP transaction activities observed during the unlocking of 1 billion XRP for the month. Before the scheduled unlock, Ripple engaged in significant XRP shuffling between various wallets on June 1.

Ripple Shifted 1B XRP Before Official Escrow Unlock

Blockchain records indicate that at 21:30 UTC on June 1, Ripple moved 200 million XRP, worth approximately $104.1 million, from the “Ripple 24” wallet to its main operational wallet, “Ripple 1.”

Four minutes later, the same source wallet dispatched another 300 million XRP worth $156 million to the “Ripple 13” wallet.

Within a few minutes after the second transaction, Ripple sent 500 million XRP from “Ripple 25” to the “Ripple 12” wallet. Essentially, Ripple shuffled 1 billion XRP across various wallets between 21:30 and 21:40 UTC on June 1. 

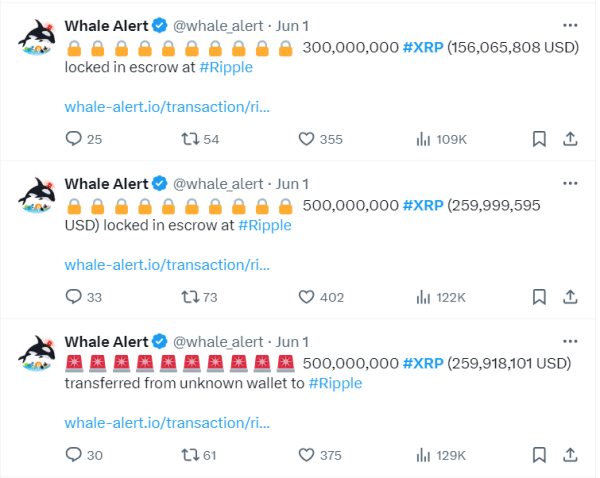
Notably,  at this time, Ripple’s escrow execution for June was yet to occur. Meanwhile, Ripple proceeded to lock the 500 million XRP received in “Ripple 12” in escrow. Likewise, the 300 million XRP received in “Ripple 13” was subsequently locked in escrow. 

These escrow transactions took place between 21:40 and 21:45 UTC. The transaction monitoring service Whale Alert continuously tracked and reported these movements from Ripple.

Ripple escrow lock June
Ripple June escrow locks

400M XRP Now in Ripple Spendable Wallet

Interestingly, shortly after locking 800 million XRP in escrow, Ripple again moved 200 million XRP. This time, the transfer came from the dormant wallet “Ripple 35” to its spendable wallet, “Ripple 1.” Cumulatively, the “Ripple 1” wallet has received 400 million inflows.

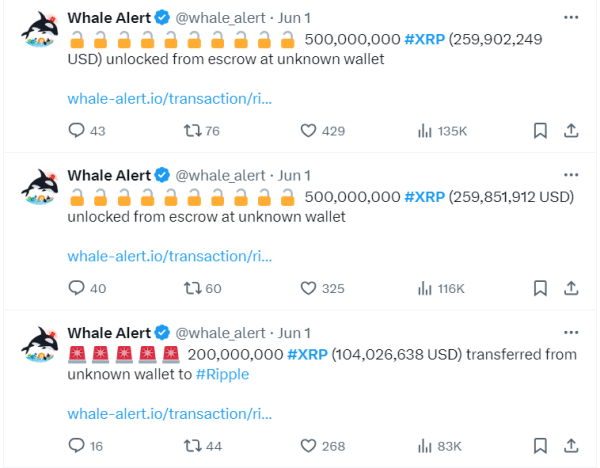
Following these transactions, Ripple proceeded with the unlocking of 1 billion XRP in two separate transactions of 500 million each, one originating from “Ripple 24” and the other from “Ripple 25.” These escrow unlocks, occurring between 21:55 and 21:58 UTC, replenished the 800 million XRP Ripple earlier sent to escrow.

Ripple escrow unlock June
Ripple June escrow unlock

Essentially, Ripple set aside 200 million XRP from the June unlock event. This is consistent with the trend observed for previous months.

Meanwhile, the 200 million reserved from June’s escrow rests in the “Ripple 1” wallet. Recall that this operational wallet received 200 million XRP from an infrequently used wallet, Ripple 35.

Ripple Likely Dumping 400M Soon

Notably, after the May escrow unlock, Ripple dispatched 200 million XRP from Ripple 1 to an anonymous wallet with the initials “rP4X2hTa” in two separate transactions: one of 50 million XRP and another of 150 million XRP on May 13 and May 20, respectively. These transactions ultimately depleted the wallet following the sale.

Given that the Ripple 1 spendable wallet now holds 400 million XRP, this implies that Ripple might liquidate the entire amount of XRP again in the coming weeks.