Home Blog Page 1436

BlackRock Flips Grayscale as Largest Bitcoin ETF with $19B+ in AUM

The BlackRock iShares Bitcoin Trust (IBIT) briefly flipped the Grayscale Bitcoin Trust (GBTC) as the largest BTC ETF following the latest round of inflows.

On-chain intelligence resource Arkham Intelligence first called attention to this feat in a recent post on X, following reports of the capital flows recorded by the spot Bitcoin ETF market yesterday. Notably,  the entire BTC ETF market in the U.S. saw inflows worth $45 million on May 28, marking its 11th consecutive day of positive netflows.

IBIT Sees Inflows; GBTC Records Outflows 

Meanwhile, according to market data sourced by The Block, BlackRock’s IBIT saw the largest capital inflow valued at $102.5 million, while Fidelity’s Wise Origin Bitcoin Fund (FBTC) witnessed the second-largest inflow worth $34.3 million. 

In contrast, GBTC recorded massive outflows totaling $105.2 million worth of BTC, as withdrawals from the funds resumed. Recall that the sustained outflows from GBTC since its conversion to an ETF came to a halt on May 13, when it saw zero flows. The ETF then witnessed four consecutive days of inflows from May 15 to 20.

These inflows soon got exhausted, with the trend of outflows resuming from May 22. Meanwhile, during this period, BlackRock’s IBIT recorded zero outflows, with its most recent capital outflow coming up as far back as May 7. According to Arkham, IBIT has seen an influx of $656.7 million worth of BTC over the last week, while GBTC has seen $29.9 million in capital exit. 

IBIT Flips GBTC as Largest BTC ETF

This contrast in inflows and outflows across both funds eventually resulted in IBIT holding 284.5K BTC worth $19.4 billion, making it the largest Bitcoin ETF globally, as it flipped GBTC to assume this position. IBIT has seen $830 million in inflows this month, while GBTC has recorded outflows worth $451.6 million.

Citing this data, Arkham emphasized that IBIT flipping GBTC to assume the dominant position was more due to the large amount of inflows it has commanded in recent times than the outflows from GBTC. Interestingly, as other ETFs record their individual inflows, BTC ETFs in the U.S. now hold 2.67% of BTC’s circulating supply, totaling 562,000 BTC or $38.2 billion.

Eric Balchunas, a renowned ETF analyst from Bloomberg, confirmed IBIT’s feat, stressing that the fund is on its way to make history as the fastest ETF to reach $20 billion in AUM. This record is held by the JPMorgan Equity Premium Income ETF (JEPI), which crossed $20 billion in 985 days. IBIT has only traded for 137 days, including non-business days.

Top Analyst Outlines Two Scenarios Where XRP May Surge 182% to $1.5

Prominent crypto analyst EGRAG states how XRP may soar by 182% in the next few weeks to reclaim the $1.5 price.

The analysis comes amid the resurgence of bullish momentum in the crypto scene, despite XRP trailing at the reporting time. Specifically, XRP trades at $0.531 with barely any positive gain over the past day and week.

Meanwhile, EGRAG emphasized his conviction in XRP cracking price thresholds not seen in the last few months. In the update, the analyst dissected the symmetrical triangle formations on XRP’s historical chart, focusing on the triangle formed by the most recent price actions. 

Notably, this triangle’s apex corresponds to XRP’s July 2023 peak of $0.93, while its base coincides with the dip to the $0.4 range. Based on the formation, he outlined two scenarios that may play out soon upon a breakout from the downtrend. This first case accounts for his most optimistic short-term projection.

Case 1: XRP to $1.5 in Weeks

Specifically, EGRAG predicts “a measured move” that drives XRP to break out targets between $1.2 and $1.5. With XRP around $0.531, this analysis suggests an upcoming 182% price upswing.

Meanwhile, the analyst noted that XRP’s rally back into the $0.7 to $0.75 channel will ultimately confirm the $1.5 breakout target. In parallel, EGRAG voiced conviction that this projected breakout will surface in the next few weeks. 

Yet, the analyst acknowledged that a retest of the breakout level is possible, suggesting XRP might experience a dip or face additional resistance before the anticipated surge. Regardless,  he maintained that a significant rally for XRP is forthcoming, reaffirming his double-digit price target.

Case 2: XRP to $0.68

Regarding the second scenario that could play out from the symmetrical triangle formation, EGRAG considered the bottom prices XRP has established in the last ten months. According to him, XRP has been resilient, “holding strong like a boss” when observed.

In this scenario, the analyst pinpointed $0.577 as the critical resistance level for XRP to overcome. While the $0.5 mark serves as crucial support, he issued $0.6799 as the breakout point.

Notably, EGRAG’s latest update aligns with his ongoing analysis of XRP under what he terms the ‘genuine wake-up line.’

While he sets an optimistic $1.5 target based on the recent symmetrical triangle, his analysis of the more extensive triangle formation suggests an even more ambitious XRP price range of $5.89 to $7.5.

Market Analyst Predicts Solana Spike to $1,600 Amid Bullish Breakout

0

Solana (SOL) shows a strong bullish momentum, breaking out from its second ascending triangle, with analysts like Trader Tardigrade predicting a rise to $1,600.

Solana has demonstrated heightened bullish momentum in recent trading activity, breaking out from its second ascending triangle pattern since the latest market low. This technical breakout suggests an imminent continuation of the upward trend, with market analysts like Trader Tardigrade predicting a potential rise to the $1,600 mark.

Solana Analysis and Implications

According to an accompanying chart, Solana’s first ascending triangle pattern formed between May and August 2021, culminating in a breakout in August and leading to a sharp price incline. 

Solana’s price surged dramatically following this breakout, peaking in November 2021. After reaching its peak, the price began to decline, entering a corrective phase until early 2022. 

This decline formed the second ascending triangle pattern from May to August 2022. Like the first pattern, this second triangle indicated intense buying pressure, leading to another breakout. 

Now, in the current market scenario, Solana is following a similar pattern. In this cycle, the first ascending triangle came up at the start of 2023, with a breakout occuring toward the end of the year. A breakout from this first triangle resulted in a surge before an observable retracement.

Meanwhile, the second ascending triangle of this cycle started in April this year amid the current market uncertainties. Data from the analyst’s chart shows that Solana recently broke out this ascending triangle, with projections of another price uptrend. 

A $1,600 Price Target

This breakout has reignited optimism among traders and investors, with the price rallying sharply from its recent low. Historical performance following similar breakouts suggests strong potential for further upward movement. Consequently, market analyst Tardigrade forecasts that Solana could exceed the $1,000 mark and hit $1,600 by year-end.

Meanwhile, prominent figures in the finance scene suggest that Solana could be the next crypto asset to secure a spot exchange-traded fund (ETF) following Ethereum. 

However, The Crypto Basic cites Bloomberg ETF analyst James Seyffart, who contends that the earliest a Solana spot ETF could come up is 2026. Despite this, Seyffart notes that the recently passed pro-crypto bill could potentially expedite this timeline.

Shiba Inu Lead Reacts to SHIB Market Projections and Buying Strategy

Shiba Inu lead developer Shytoshi Kusama reacts to a SHIB buying strategy revealed by one of the earliest adopters of Bitcoin.

Davinci Jeremie, a Bitcoin proponent, remains bullish on Shiba Inu, as his advocacy for the canine-themed cryptocurrency persists amid current market realities. Known for his prominent YouTube video in May 2013 where he urged his followers to buy at least $1 worth of Bitcoin, Jeremie recently shifted his focus to Shiba Inu, making similar pleas.

The Crypto Basic has called attention to some of the remarks in which he urged investors to procure some Shiba Inu tokens. Davinci promoted Shiba Inu on multiple occasions in January, August, and October of last year. This year, he also called the public’s attention to SHIB in January, urging investors to “buy Shiba Inu.”

Bitcoin OG Reveals SHIB Buying Strategy 

Interestingly, Davinci’s latest call to action takes a different shape, with the early Bitcoin adopter now discussing a buying strategy that market participants could leverage to enter the Shiba Inu market. In a recent video, he emphasized that SHIB had already pumped and yielded some profit but appeared to be going down.

In this remark, Davinci referenced Shiba Inu’s remarkable price upswing from February to March this year. SHIB spiked from $0.00000967 on Feb. 26 to a local top of $0.00004567 on March 5, marking a 372% increase in a week. With this upsurge, $10,000 in SHIB surged to a worth of $47,228, bringing in a profit of over $37,000.

Davinci referenced this massive profit ratio but confirmed that Shiba Inu has now begun shedding off the gains picked up in the earlier rally. Interestingly, the internet personality presented a chart that suggests that Shiba Inu is trading within a descending parallel channel amid the ongoing correction.

According to Davinci, a breakout from this channel would lead to another impressive price spike. He noted that such a breakout could occur when Shiba Inu conquers the $0.000025 or $0.00003 price territory. His initial target for when this occurs is the $0.00006 zone, a level market analyst SHIB Knight has also called attention to.

The chart from Davinci Jeremie suggests a buying strategy below the $0.000025 and $0.00003 price territories. Shiba Inu, the lead developer, responded to the recent disclosure with a Dragonball meme, showing support.

Shiba Inu Breaks $0.000025

Notably, Shiba Inu has already broken above the $0.000025 price threshold. This breach came on the back of the recent uptrend which has seen it spike 17% in three days. SHIB is currently facing a correction after hitting $0.00002945 today in an attempt to record a breakout above $0.00003.

At the current price of $0.00002753, Shiba Inu is still below the pivotal $0.00003 level. As a result, market participants looking to enter the market still have an opportunity to amass more tokens at the attractive entry level. However, this should not serve as investment advice, as SHIB might not record as much rally as projected. 

Here Are Key Factors Behind Today’s Surge in Shiba Inu Price

0

Several factors are driving today’s 11% surge in the price of Shiba Inu, including the anticipated SHIB ETF and a heightened increase in trading activity.

Shiba Inu is enjoying a remarkable year, with its value reaching levels similar to those seen in early April. Over the last 24 hours, it has surged by 11%, contributing to an overall increase of 7% over the past week. As of press time, SHIB is trading at $0.00002881.

Admittedly, there are numerous factors contributing to today’s surge in SHIB’s value. A key event catching the eye of the crypto community involves whales executing substantial trades in the meme coin market, specifically targeting Shiba Inu (SHIB) and Pepe (PEPE).

PEPE Funds Flow into SHIB

For instance, Lookonchain previously called attention to an anonymous whale shifting investments from the frog-themed PEPE token to Shiba Inu. Initially holding 1.97 trillion PEPE tokens valued at over $6.07 million, the investor deposited them into Binance and realized a profit of $3.49 million. 

Subsequently, the whale acquired approximately $75.9 billion SHIB for $893 million, transferring these assets to an undisclosed wallet. This significant shift from PEPE to SHIB highlights the investor’s confidence, a trend that some market watchers speculate might resumed, contributing to the recent SHIB upsurge.

SHIB ETF Speculation

Amidst these market movements, discussions around the potential for a Shiba Inu-themed exchange-traded fund (ETF) have gained traction. Following the U.S. SEC approval of Ethereum spot ETFs, Shiba Inu lead developer, Shytoshi Kusama, queried the community about the feasibility of a SHIB ETF.

Although financial institutions have not presented formal proposals, the community’s enthusiasm remains high. Furthermore, an ongoing petition advocating for a SHIB ETF by Grayscale has nearly reached its goal of 10,000 signatures, demonstrating strong community support for the initiative.

Transaction Volume Spike

Shiba Inu’s market activity has also been characterized by notable fluctuations in transaction volumes. As reported by The Crypto Basic, CryptoQuant’s data indicates a significant trading surge in SHIB, with over 5.354 trillion coins valued at more than $132 million exchanged yesterday. 

This represents a 169% increase in trading volume compared to the day before. According to the report, this surge in trading volume is primarily attributed to significant whale transactions. On the other hand, IntoTheBlock reported a relatively low number of transactions on May 27, totaling only 6,390.

The report further indicates a substantial rise in large-scale transactions, with 2,605 transactions ranging between $1k and $10M occurring yesterday, compared to 1,595 transactions on the prior day. Transactions involving at least $100k worth of Shiba Inu totaled approximately $91.04 million on May 27, underscoring the increased participation of large investors in the market.

Here Are 3 Factors That Could Drive Shiba Inu Above $0.00004 

0

Following Shiba Inu emergence as the 10th biggest crypto by market cap, we have highlighted three factors that could potentially push SHIB’s price to $0.00004. 

The spotlight is currently on Shiba Inu (SHIB) after it flipped Cardano (ADA) to become the 10th largest crypto by market cap. According to data from CoinMarketCap, the price of SHIB has surged 17.18% over the past 24 hours to hit $0.00002913. 

Shiba Inu’s Potential Surge to $0.00004 

Following SHIB’s latest rally, discussions about Shiba Inu’s potential surge to the $0.00004 price level have resurfaced. The last time Shiba Inu breached the $0.00004 level was on March 5. Since then, Shiba Inu has plummeted heavily, plunging below $0.00002 in April, but managing to recover the price level shortly after. 

With SHIB’s latest rally, investors are optimistic that the doggy-themed token could reclaim the $0.00004 level in the coming days or weeks. Hitting the $0.00004 target requires Shiba Inu to rally 37.31% from its current price of $0.00002913.

3 Factors That Could Take SHIB to $0.00004 

As a result, we have highlighted three factors that could take Shiba Inu to the $0.00004 price level. 

Burn Rate 

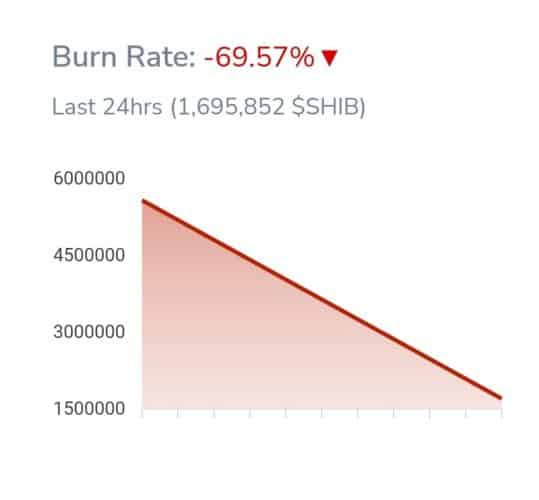
At the top of the list is Shiba Inu’s burn rate. Shiba Inu enthusiasts have been committed to reducing SHIB’s hefty supply via burns. Data from Shibburn shows that the burn rate plummeted by 69.57% over the past 24 hours to 1,695,852 (1.69 million) SHIB. 

Shiba Inu burn rate
Shiba Inu burn rate


Although the burn rate is negative, the unending effort to reduce SHIB’s hefty supply could positively impact the token’s price toward $0.00004 in the coming days.  

Trading Volume  

The second factor on the list is Shiba Inu’s trading volume. For SHIB to reclaim the $0.00004 level, the canine-themed token must maintain an elevated trading volume. 

Shiba Inu’s trading volume was up 115.4% over the past 24 hours to $2.19 billion. A surge in the trading volume implies that investors’ enthusiasm for SHIB is strong. This usually leads to increased buying or selling pressure, depending on the prevailing sentiment. 

As Shiba Inu’s trading volume continues to soar, the metric could be instrumental in driving SHIB’s growth to the projected $0.00004 mark in earnest.  

Whales Activities 

Lastly, Shiba Inu whale activities could help bring SHIB’s price to $0.00004. Shiba Inu whales have been inactive recently and have only initiated a few transactions over the past weeks. 

According to data from IntoTheBlock, Shiba Inu’s large transaction count soared to around 11,120 on March 4 and plunged to 767 on May 13. This represents a massive decline of 93.1% in less than three months. 

As of May 27, Shiba Inu whales had only traded $29.93 million worth of SHIB, a stark contrast to the doggy-themed token Dogecoin, which saw whales trade $1.16 billion worth of DOGE in the same timeframe.

In addition to these three catalysts, factors such as Shibarium, exciting partnerships, and projects within the Shiba Inu ecosystem could also boost SHIB’s price to $0.00004 in the coming weeks.  

Technical Expert Says Downside to XRP is Now Extremely Limited

A technical analyst has asserted that intending investors now have “extremely” limited risk when entering the XRP market.

The market expert, known by the alias “Cryptoes” on X, voiced this sentiment in a recent commentary. The view emerged amid the altcoin market resuming the second-led bull frenzy after a brief setback triggered by Mt Gox’s $9 billion Bitcoin movement. 

“Great time to be in XRP”

While XRP’s bulls are yet to join the trend, Cryptoes suggested that now is an opportune moment to buy XRP. According to the analyst, the downside risk to investing in XRP is significantly minimal. Notably, at press time, XRP trades at $0.53.

Here’s Why

The technical analyst based his perspective on XRP’s resilience around the $0.5 price channel, which is now seen as a “rock solid support.”

Notably, XRP has barely breached the $0.5 mark in the past 30 days. The asset has mostly fluctuated within this range, with a brief dip to $0.48 on May 1 being the only exception.

Considering XRP has held well for an extended period, the analyst believes the odds are presently in favor of investors.

Furthermore, XRP’s potential upswing is supported by the consistent recognition of a prolonged consolidation phase in its price. Various analysts have observed that XRP has been in an accumulation phase for approximately six years—since it dropped from its all-time high of $3.84.

The pattern that XRP has formed over this period is identified as a symmetrical triangle, which renowned market observers interpret as a bullish signal. These analysts have suggested various targets XRP investors can anticipate upon a breakout from the downtrend pattern.

For instance, analyst Javon Marks predicts as much as a 37,635% surge in XRP to $200. The audacious $200 target is inspired by XRP’s 75,000% rally post-2014 consolidation.

Moreover, beyond XRP’s technicals, the anticipation of an upswing for XRP is reinforced by the current bull market trend. Every major altcoin is expected to experience its own rally, setting new all-time highs.

Besides, XRP has not seen substantial movement since the start of the bull market seven months ago. Some market observers interpret this as a setup for explosive growth, which is typical for XRP.

However, some retail investors view the current lack of commendable movement as a negative indicator.

Shiba Inu Enters Top 10, Flips Cardano With Big Rally

0

Shiba Inu (SHIB) has resumed its bullish momentum as it enters the list of the top 10 cryptocurrencies by market capitalization, displacing Cardano (ADA).

This comes after Shiba Inu’s price surged 16.4% over the past 24 hours to eventually hit the $0.000028 territory.

Shiba Inu Flips Cardano to Become Top 10 Biggest Crypto by Market Cap  

Following Shiba Inu’s tremendous price increase, SHIB secured the 10th position in the global crypto ranking by market cap, as its total valuation hit the $16 billion mark. Interestingly, Shiba Inu flipped Cardano (ADA) to become the 10th-biggest crypto by market cap.

Cardano, which held the 10th position over the past few days, has now slipped to 11th place with a market cap of $16.50 billion. However, Shiba Inu currently boasts a market cap of $16.84 billion. 

Reacting to the development, Shiba Inu ecosystem marketing lead, Lucie, called the public’s attention to the latest feat in an X post. 

Similarly, prominent Japan-based Shiba Inu community member Kuro also commented on the development, noting that SHIB is back in the top 10 spot. 

Previous Surge to Top 10 Ranking 

For context, the last time SHIB entered the top 10 spot was on March 4, 2024. At the time, Shiba Inu surged 177% in one week, hitting the $0.000027 territory. 

Notably, Shiba Inu outpaced Avalanche (AVAX) to secure the top 10 spot. After hitting the $0.000027 level, Shiba Inu continued the rally that eventually took its price above $0.000045 on March 5. 

However, the rally was short-lived as Shiba Inu’s price dipped amid intense selling pressure. Consequently, SHIB plunged below $0.00002 in April. 

Can SHIB Surge to $0.00004?

It remains to be seen whether Shiba Inu could replicate its March performance and potentially surge above $0.00004. Prior to its resurgence to the top 10th position, prominent market analysts predicted that SHIB could witness a tremendous rally that might take its price above the $0.00004 mark.

As reported earlier, popular crypto chartist Clifton projected that Shiba Inu could surge to $0.00004048 following the emergence of a bullish pennant pattern on the asset’s daily chart.

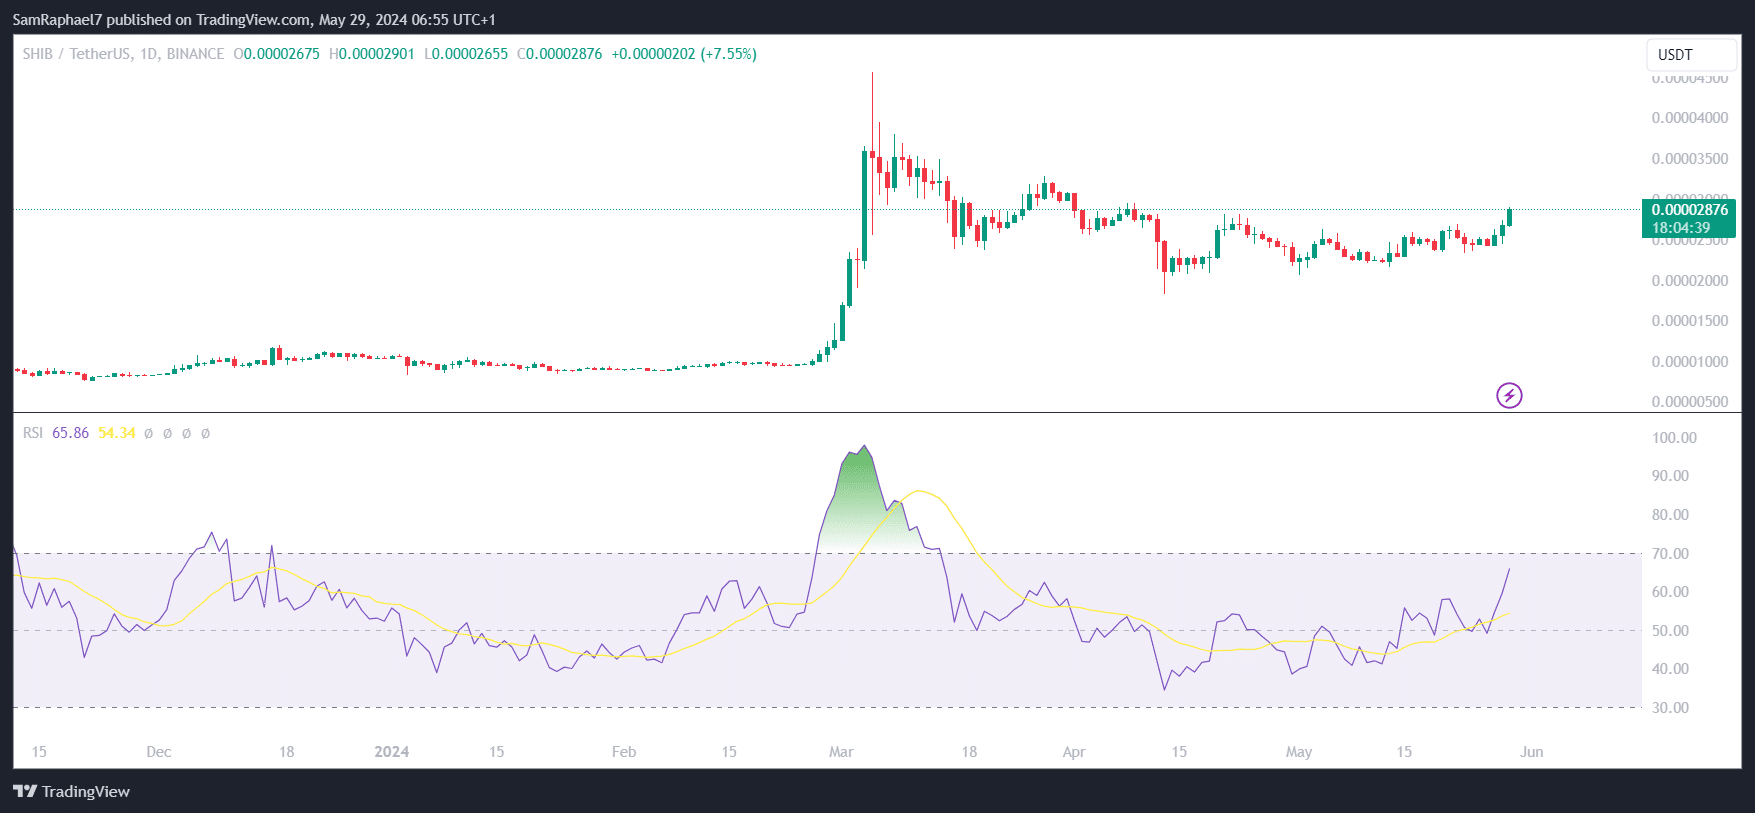
In the meantime, SHIB changes hands at $0.00002876, up 16.4% over the past 24 hours. Shiba Inu’s 24-hour trading volume has spiked 98% to a whopping $2.01 billion. 

Analyst Predicts Shiba Inu to $0.00006 as SHIB Breaks Major Resistance After 17% Spike

SHIB Knight, a notable analyst, expects Shiba Inu to reach a new yearly peak at $0.00006 after the breach of a major resistance in a 17% three-day spike. 

Shiba Inu is currently showing signs of a recovery after weeks of range-bound movements beneath pivotal decisive price territories. The recent recovery push allowed SHIB to retest the $0.000029 price threshold today for the first time in nearly two months.

Shiba Inu Soars 17% in 3 Days

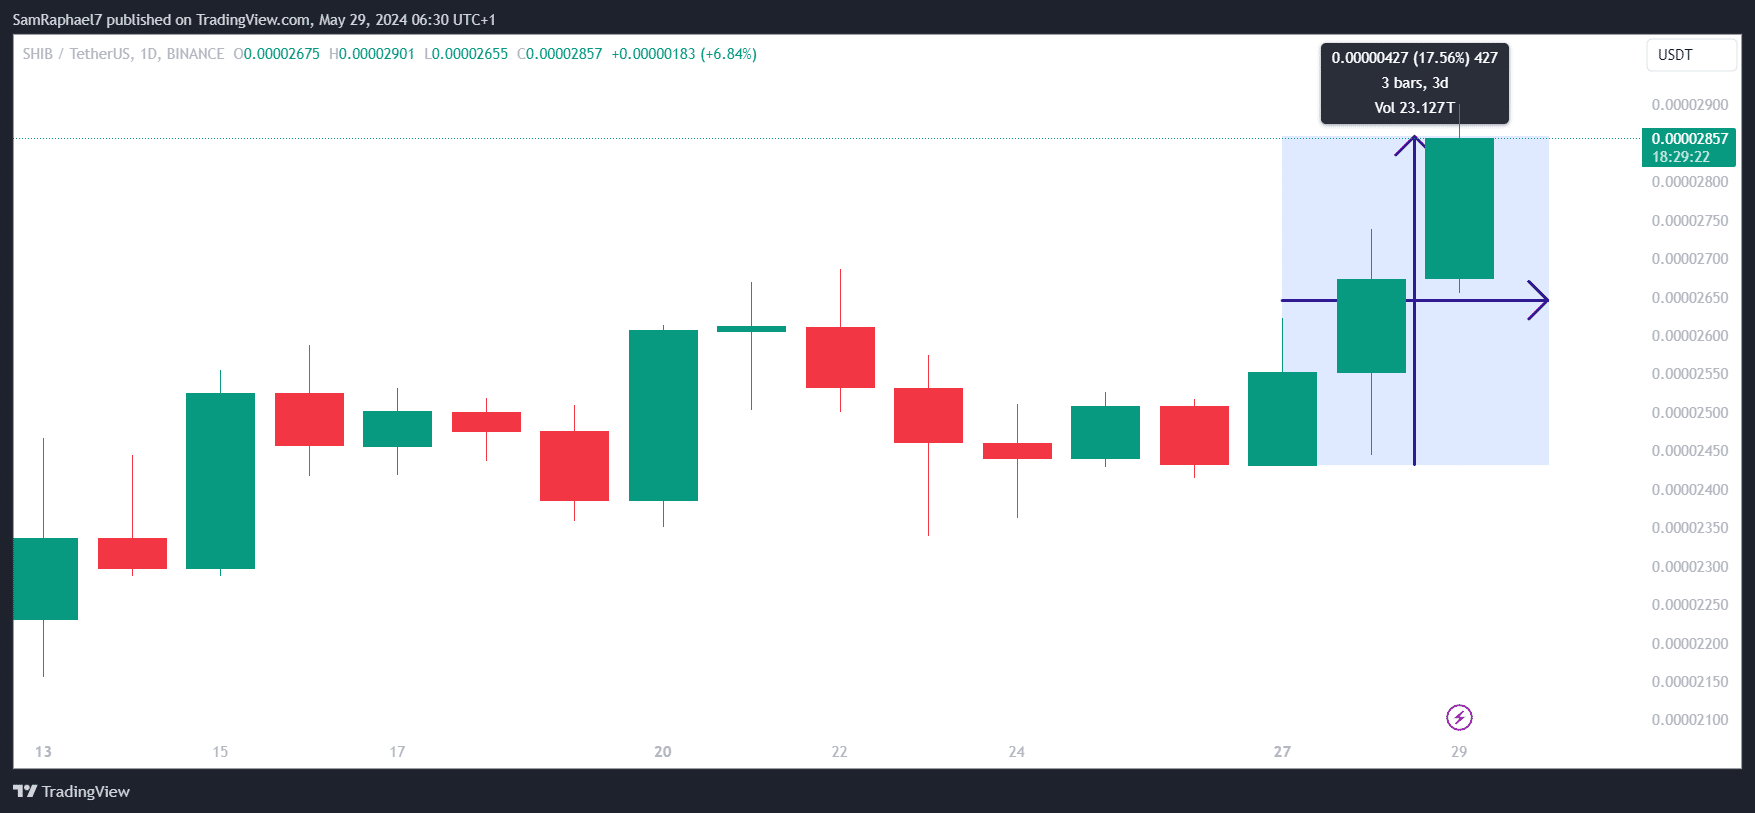
This came on the heels of a three-day winning streak that has seen Shiba Inu spike by an impressive 17.56%. This marks SHIB’s biggest gains over a three-day period since it engineered a similar price uptrend in late February. Recall that this late February upswing culminated in a 370% gain to the $0.000045 yearly high.

SHIB 3D Gain
SHIB 3D Gain

Now, SHIB Knight, who has continued to observe Shiba Inu’s price movements, believes this ongoing uptrend could end with similar price gains. In an analysis today, the market watcher confirmed that the latest price rally has sealed Shiba Inu’s breakout above a resistance trendline that plagued it for over two months.

For context, this resistance trendline formed on the back of SHIB’s collapse below the $0.00004567 high on March 5. Every attempt toward breaching it was met with fierce resistance from the bears, as the trendline continued to exert pressure on SHIB’s price action, leading to lower highs.

Market data suggests that a successful breakout occurred on May 15 when Shiba Inu recorded a massive 9.88% intraday gain to breach the $0.000025 territory. However, a battle at this territory kept SHIB grounded atop the resistance trendline, with concerns of a drop below it should the bears trigger enough selling pressure.

An Imminent Push Toward $0.00006

Now, the recent 17% three-day gain has helped Shiba Inu to record a confident push above this area, confirming the possibility of an imminent price upswing. SHIB Knight believes this upswing could potentially take Shiba Inu to a new yearly high of $0.00006. The last time SHIB saw $0.00006 was in November 2021.

The accompanying chart shows that a push toward this level would necessitate a 152% increase from Shiba Inu’s May 24 trading value of $0.00002375. Interestingly, the required gains to reach the $0.00006 level have reduced, given SHIB’s reclamation of the $0.000028 territory. 

At a current price of $0.00002876, Shiba Inu would need a 108% rise to clinch $0.00006, much lower than the 370% increase it recorded from late February to early March. In addition, despite the sudden spike, SHIB’s daily RSI sits at 65.97, well below 70. This suggests that Shiba Inu still has more room for price growth. 

Shiba Inu Daily RSI 3
Shiba Inu Daily RSI

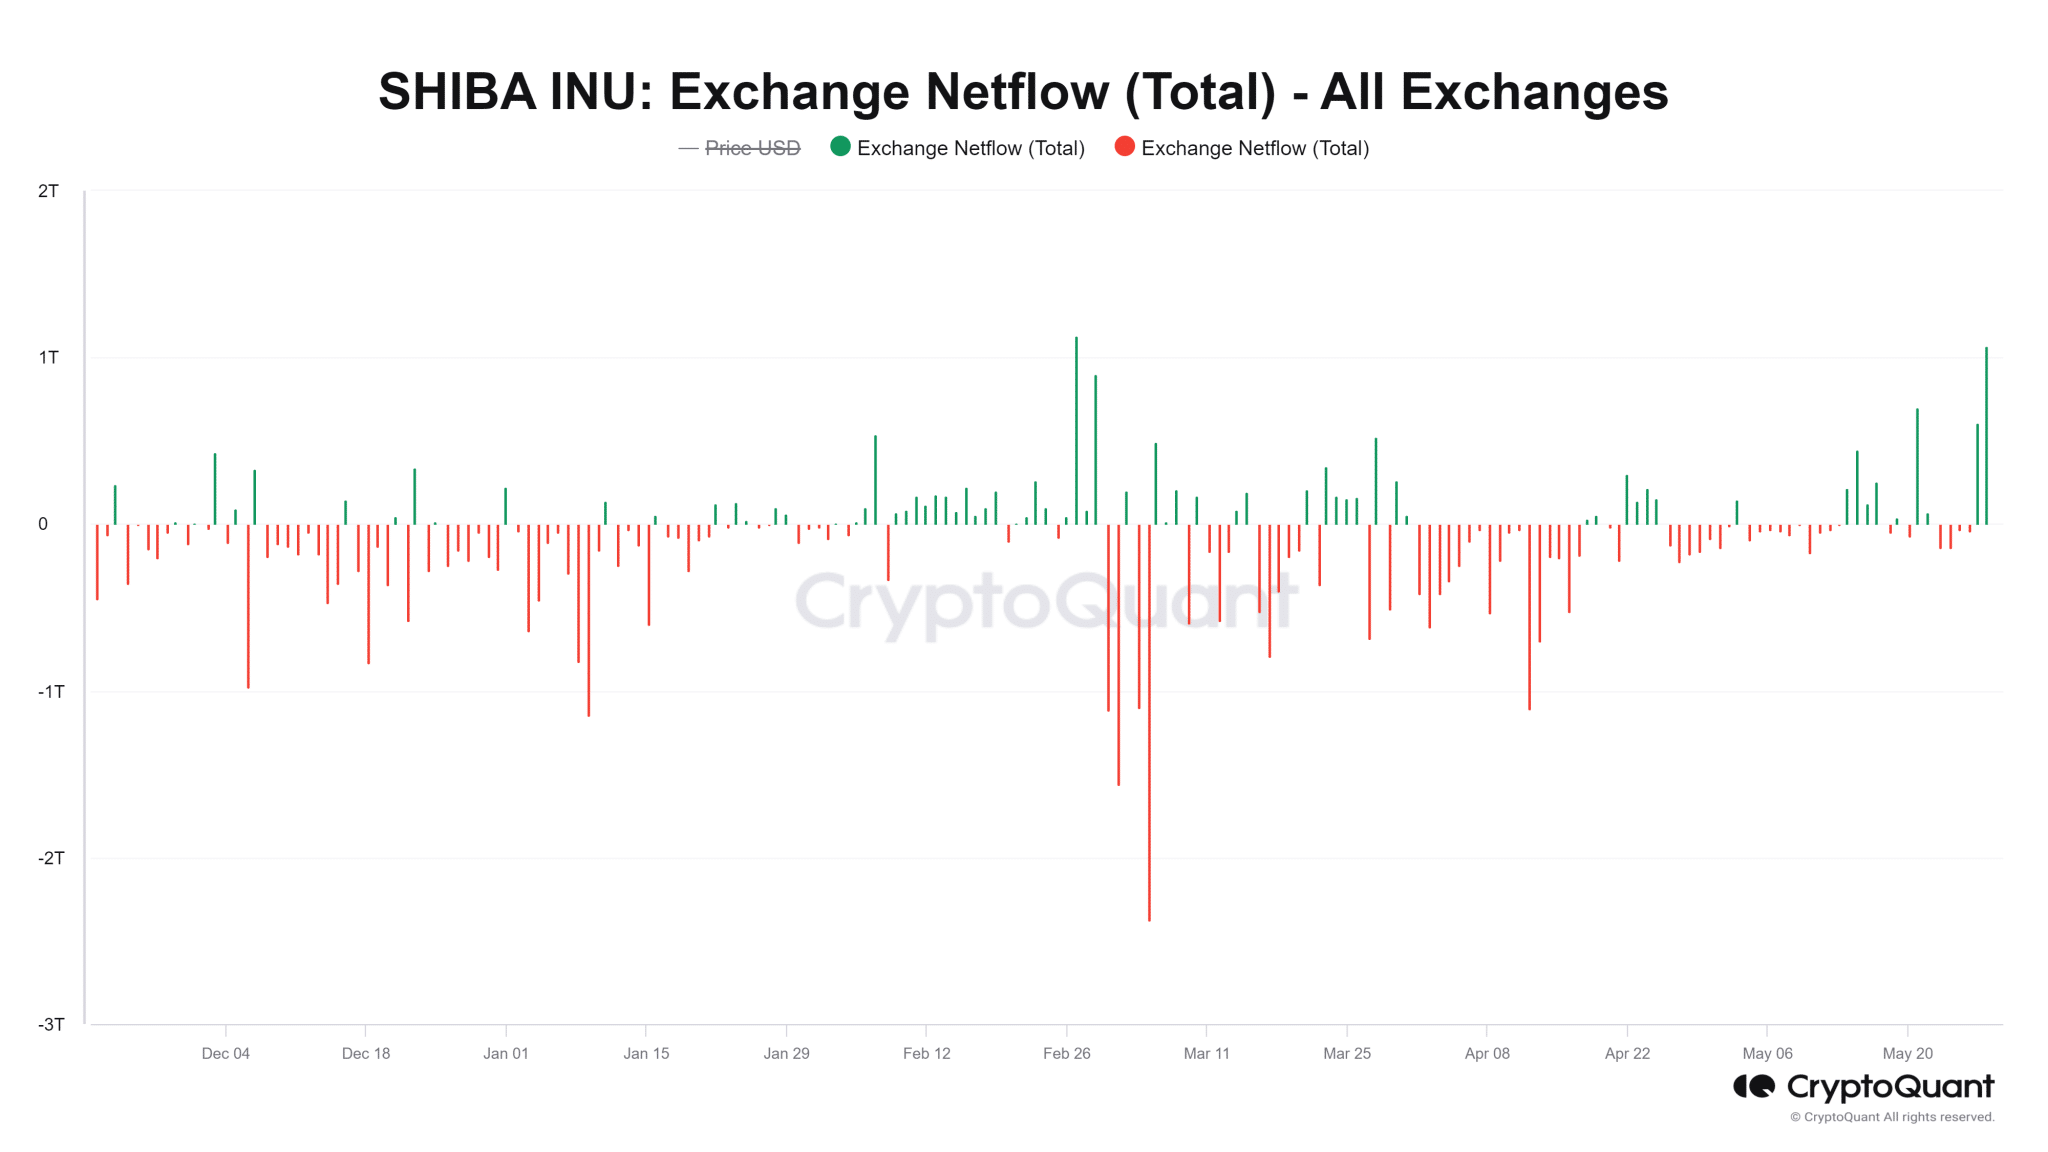
The Crypto Basic confirmed yesterday that Shiba Inu witnessed a massive transaction volume of 5.3 trillion SHIB. Latest data from CryptoQuant shows that SHIB saw over 1 trillion tokens in exchange netflow yesterday. While this could increase selling pressure, the last time such a spike occurred was in late February, right before SHIB rallied to $0.000045.

Shiba Inu Exchange Netflow CryptoQuant 2
Shiba Inu Exchange Netflow | CryptoQuant

Cardano Price at Risk of $0.40 Reverse as Ethereum Bulls Await ETF Launch

Cardano’s (ADA) price tumbled towards the $0.45 level on Tuesday, May 28, as Ethereum continues to dominate crypto investors’ short-term preferences. 

Cardano price falls further as Ethereum Dominates

Since the United States Securities and Exchange Commission (SEC) approved spot Ethereum ETFs on May 23, the global crypto markets have entered a consolidation phase as investors await the official launch of the ETH derivatives in US markets.

However, as the markets entered a consolidation phase, crucial market data trends show that many traders are redirecting capital away from Ethereum’s arch-rival Proof-of-Stake Layer-1 networks, like Solana (SOL) and Cardano (ADA) and Avalanche (AVAX).

Consequently, while the Ethereum price continues to charge towards the $4,000 milestone, Cardano’s price action has taken a negative turn.

Cardano (ADA) Price Action vs. Ethereum (ETH) 
Cardano (ADA) Price Action vs. Ethereum (ETH)

As seen in the chart above, ETH price has racked-up a  25% surge over the past week, holding firm above the $3,800 support level at the time of writing on May 28. But Cardano on the other has now decline 12% within the weekly time frame, as it fell toward the $0.45 mark.

However, digging deeper, the recent movements in the Cardano derivatives markets suggests that investors are anticapting more downsizing for ADA price in the days ahead.

Coinglass’ Liquidation Map data shows that speculative SHORT traders are now dominating the Cardano markets and deploying unusually high-leveraged bets against ADA.

Cardano (ADA) Price Action vs. Ethereum (ETH) 
Cardano (ADA) Price Action vs. Ethereum (ETH)

Looking at the chart above, Cardano SHORT traders have deployed $11.91 million leveraged short contract around the current prices. Meanwhile, the bull traders have only listed $5.9 million LONG contracts.

When the value of leveraged SHORT contracts surpasses LONGs, it suggests that more traders are betting on a decline in Cardano’s price. This could be due to the widespread sentiment that Ethereum’s growing market status due to the ETH ETF approval could lead to reduced traction for its rival L1 networks.

If the Cardano long traders continue closing out their dwindling positions rather than make covering spot purchases, ADA price could be at risk of losing the critical $0.45 support, as tumbling toward $0.40 in the days ahead.