Home Blog Page 1454

Here is When $1000 in Cardano Now Can Turn Into $1M

0

The path to turning a $1,000 investment in Cardano into $1,000,000 by 2050 receives support from various market indicators, accumulation trends, and long-term forecasts.

Many analysts are currently predicting bullish scenarios for the crypto markets, particularly for Cardano (ADA). With Cardano’s current price at $0.46, an investment of $1000 would need the price to rise to approximately $459.88 for the investment to be worth $1,000,000. 

While this target might appear farfetched to many investors, projections from various sources suggest significant growth in Cardano’s value over the coming decades. For instance, Changelly forecasts Cardano reaching $458.37 by May 2050. On the other hand, shorter term analysts are predicting over 1500% surge to price levels crossing $7.

Can ADA Can Reach $458.37

Changelly’s projection paints an optimistic picture for Cardano’s long-term growth. Analyzing historical price data, it is estimated that by 2050, the minimum price of Cardano will be around $499.68, with a maximum expected price of $567.86 and an average trading price of $524.57. 

Cardano Prediction
Cardano Price Prediction

This steady increase is projected to start in January 2050, with prices ranging from a minimum of $398.43 to a maximum of $475.51. By May 2050, the average price is expected to reach $458.37, a key milestone for reaching the $1 million valuation for an initial $1000 investment.

Shorter Term Indicators Show Promise

To comprehend how Cardano might achieve this increase, it is essential to examine recent market indicators. The Accumulation/Distribution Line (A/D Line) value is around 2.857 billion. This metric, which factors in the closing position of the price relative to its high-low range, shows an ongoing accumulation of ADA, hinting at future price increases as demand continues to build.

Cardano Monthly Price Action

The Exponential Moving Average (EMA) over the last 9 months stands at $0.484864. This figure reflects the average closing price during this period, indicating a stable yet gradually increasing trend. Moreover, recent trading volumes are bullish. Cardano’s most recent recorded volume is approximately 130.589 million ADA, showcasing active trading and investor interest. 

These trends suggest that Cardano’s price has been steadily appreciating, laying a foundation for potential growth.

Profitability Analysis of Cardano Holders

Elsewhere, the “Global In/Out of the Money” metric provided by IntoTheBlock offers additional insights. Notably, holders who acquired ADA at prices between $0.000006 and $0.467903 are “In the Money,” as they currently experience profits. Conversely, those who bought at higher prices, ranging from $0.467905 to as high as $2.97, are “Out of the Money” and currently facing losses.

Cardano GIOM IntoTheBlock
Cardano GIOM | IntoTheBlock

As more investors hold onto their ADA in anticipation of higher prices, the accumulation phase could lead to increased scarcity, thereby driving up the price as demand outstrips supply.

Future Price Predictions from Analysts

Other analysts also provide encouraging predictions for Cardano. According to The Crypto Basic, Cardano experienced a significant surge of 222% post-breakout, with analyst Javon Marks forecasting a further 1500% increase to $7.80. This highlights Cardano’s potential for robust growth.

Prediction platforms such as Telegaon anticipate that Cardano could reach a maximum value of $3.14 by next year. They project an average price of $2.55 by 2025 and a stabilization at $3.54 by 2026. These predictions align with Cardano’s past performance, where it peaked at $3.10 during the last cycle, though it is currently trading 86% below that peak. Despite this, the long-term outlook remains positive, suggesting significant gains for patient investors.


Top Analyst Says Shiba Inu is a Gold Mine Sitting in Plain Sight

Prominent analyst Davie has identified Shiba Inu as an overlooked gold mine capable of delivering impressive returns in the short and long terms.

Davie voiced this view in a recent post on X, reflecting on his previous reluctance to consider predictive signals from Shiba Inu’s price charts. According to the disclosure, he often overlooked SHIB. However, this changed on Wednesday when he decided to explore Shiba Inu’s chart pattern, which led to the discovery of a promising bullish configuration.

Shiba Inu is a Gold Mine

In particular, Davie disclosed observing a bullish pennant on Shiba Inu’s chart. At this moment, he recognized that Shiba Inu represented a potential gold mine that had been under his radar all along.

Notably, a bullish pennant formation indicates a potential continuation of an upward trend in the price of an asset. It resembles a small symmetrical triangle that appears during a strong uptrend, with the price consolidating briefly before breaking out and continuing its upward movement. 

The chart accompanying the analysis depicts Shiba Inu’s pronounced downtrend since it hit $0.000045 in March. The pattern precisely illustrates the converging candlesticks following the significant price rise for Shiba Inu. Now, it suggests Shiba Inu is primed to resume its previous bullish momentum.

SHIB Headed for $0.00005 Price Target 

Davie emphasized that the short-term upside from the observation appears promising, noting he feels underexposed with his current SHIB holding. He projected Shiba Inu surpassing $0.00005 the price level when the bulls re-emerged.

With SHIB presently at $0.00002475, the target suggests a potential 102% short-term rally in sight.

Higher Targets in Sight

However, X user Bunny Boy argued Shiba Inu may witness an even more substantial 600% in this projected second-phase rally. Moreover, this commenter proposed that the outlook could materialize within the next three weeks.

Notably, this bold forecast takes inspiration from the trajectory Shiba Inu printed in the first phase. In particular, SHIB surged by 373% in less than ten days between late February and early March.

Meanwhile, Davie is not the only analyst who has recognized the bullish pennant formation on the Shiba Inu chart. Market watcher Eunice Wong recently made similar suggestions a few weeks ago but proposed a 409% that takes SHIB to $0.000125.

At press time, Shiba Inu trades at $0.00002475, dipping by 2.5% over the past day. Conversely, SHIB preserves a 6% gain from the Bitcoin-influenced rally of the last 48 hours. 

Ethereum Price at risk as ETH 2.0 Withdrawals Spike 4,000%

0

Ethereum price prodded above $3,040 on May 17, up 6% from the 14-day low of $2,862 recorded on May 14, but spikes in ETH 2.0 staking withdrawals threatens to impede the rebound phase. 

Ethereum Price Surge Lagging behind the Crypto Market Average

ETH failed to pull its fair share of capital inflows as bullish momentum returned to the crypto markets this week.

The US Bureau of Labor Statistics latest CPI data release on May 14 and the resurgent GameStop rally have emerged as major catalysts stimulating bullish activity across the crypto markets this week.

Led by mega-cap assets like BTC (+9%), SOL (+22%) and PEPE (+70%), the total crypto market capitalization has increased by $194 billon since the start of the week on May 13.

Ethereum ETH Price Action vs. Crypto Market TOTAL Cap

At the time of writing on May 17, Ethereum price is currently hovering around the $3,042 territory, up 6% from May 13. In comparison to the trends observed in rival mega-cap Layer-1 assets like Bitcoin and Solana, Ethereum price has underperformed considerably.

ETH 2.0 Withdrawal Queue Spikes 4,000% in 5-days

Ethereum’s laggard performance is well illustrated in the TradingView chart above. However, on-chain staking data from the ETH 2.0 beacon chain reveals even more worrying signals that could spark intense volatility in Ethereum price action the days ahead.

The Validator Queue chart below provides real-time insights into the number of investors seeking to join the ETH 2.0 staking pool versus those seeking to withdraw their funds.

Ethereum records 4,000% Spike in ETH 2.0 Withdrawal Queue
Ethereum records 4000% Spike in ETH 2 Withdrawal Queue

At the start of the week, only 93 stakers moved to withdraw their staked ETH from the beacon chain May 14. But that figure has now skyrocketed to 3,868 addresses at the time of writing on May 17.

This implies that the number of ETH node validators queueing up to make withdrawals has spiked 4,000% within the last 3 days, raising concerns of imminent bearish pressure. Meanwhile, over the past week, the ETH 2.0 deposit queue has nosedived 97% from 1,842 to 61 entry addresses.

The combination of increased withdrawals and decreased deposits creates a dual catalyst of downward pressure on the Ethereum price, partly explaining why ETH price has failed to catch up to the broader market uptrend this week.

On one hand, the rapid rise in withdrawals adds to the circulating supply of ETH, potentially flooding the market. On the other hand, the sharp drop in new deposits signals a decrease in long-term confidence among investors.

These critical factors could combine to exacerbate bearish trends, leading to heightened market volatility and sustained downward pressure on Ethereum prices.

ETH Price Forecast: Another Reversal below $2,900?

Ethereum price is currently around $3,040 mark at the time of publication on May 17. However, as traders begin to react to the 4,000% spike in ETH 2.0 staking withdrawals, Ethereum price will likely slump below $2,900 in the near-term.

The Bollinger band technical indicator also support this pessimistic ETH price forecast.

Ethereum ETH Price Forecast

As seen below, the upper-limit Bollinger Band indicator shows ETH price is still some distance away from reclaiming critical resistance level at $3,200, which would put bulls in control of the market momentum.

However, if ETH price tumbles below the short-term support at the 20-day SMA price level at $3,023, it could open the doors to rapid bearish reversal towards $2,825.

Investor Makes $3.2M Profit from Shiba Inu After 2 Years

0

A whale nets $3.2M profit from Shiba Inu after 2.6 years amid ongoing SHIB accumulation by other large holders and significant market activity.

In a move reported by Spot On Chain, a crypto whale has capitalized on a profitable investment in Shiba Inu (SHIB), netting a $3.2 million gain after holding for 2.6 years.

The whale initially purchased 199 billion SHIB, valued at approximately $1.68 million, between October 2021 and September 2023. Recently, all SHIB holdings were transferred to Coinbase, marking an impressive 191% profit.

How The Whale Made Profits

Per Spot On Chain, the whale accumulated SHIB tokens from both Coinbase and decentralized exchanges at an average price of $0.000008468. This accumulation, spanning from October 10, 2021, to September 11, 2023, involved an estimated investment of $1.68 million.

In an earlier trade, the whale experienced a notable loss. Following the donation of $1 billion worth of SHIB by Ethereum co-founder Vitalik Buterin to India’s Covid relief on May 12, 2021, the whale bought 138.568 billion SHIB at an average price of $0.000008385 when the price of Shiba Inu dropped.

However, the whale miscalculated the timing of the market recovery and sold the tokens prematurely on September 26, 2021, at $0.000007117 per token, realizing a sale amount of $1.16 million. This decision resulted in a realized loss of approximately $176,000, a -15.1% return on their initial investment. Notably, this sale occurred just before SHIB’s price skyrocketed to its all-time high, making the early exit particularly costly in hindsight.

According to Spot on Chain, the whale’s earlier loss in the initial trade must have taught him the importance of patience.

Shiba Inu Accumulation and Profit Takers

The profitable exit comes amid the ongoing accumulation of Shiba Inu by other large holders. Since March, whales and sharks have added over 4.35 trillion SHIB to their balances, driven by the coin’s price surge in late February. Addresses holding between 100,000 and 1 million SHIB, as well as those with over 1 billion tokens, have seen their cumulative balances increase significantly.

It is important to note that other whales are also shifting their taken profits to other asset classes, possibly as a change of strategy. A notable investor, who made an $8.24 million profit from Shiba Inu, has reportedly shifted focus to Wrapped Bitcoin (WBTC). This investor acquired 533.6 billion SHIB in March 2024 for $7.75 million and eventually cashed out with a 106% return. Now, the same investor is accumulating WBTC.

XRP to $10,000, Experts Give Reasons Why its Inevitable

Edoardo Farina, CEO of Alpha Lions Academy, and Versan Aljarrah, Black Swan Capitalist founder, lay out their arguments about why they deeply believe a $10,000 price point is realistic or “inevitable” for XRP.

Farina and Aljarrah weighed in on the speculative subject in a recent podcast shared on their social media handles.

Central Banks and IMF “Setting XRP Price” Like IPO

Aljarrah’s perspective stemmed from the speculative view that central banks and major financial institutions like the IMF would be the ones to “set” the price of XRP. He likened it to the scenario that plays out when companies attempt to go public, wherein they set higher initial prices for their stock. 

Essentially, he asserted that these prominent institutions “will set” a high initial price for XRP, similar to setting an IPO price. According to the community pundit, this is to ensure its functionality as a settlement mechanism for large transactions. 

Aljarrah believes XRP’s unique technology and increasing adoption will drive its liquidity value even higher. He argued that XRP has to attain expensive targets like $10,000 for it to become well-suited and more universally accepted for settlement transactions.

XRP at $10,000 “Is Realistic” 

Similarly, Edoardo Farina asserted that the $10,000 outlook for XRP is realistic due to its underlying technology and the crypto market’s early stage. He pointed out that the crypto market is around $2.3 trillion, so there is plenty of room for expansion in the next five years.

Furthermore, Farina argued that XRP is a superior payment vehicle and has prospects for tokenizing assets like gold, real estate, and luxury goods. 

Combining the growth of cross-border payments and tokenization, he sees a future where XRP plays a crucial role in the financial system, leading to a significant increase in its price. 

Besides, Farina drew parallels with Bitcoin’s ascent from $500 to $10,000 over the years and now $73K. He claimed the premier asset attained lofty highs purely based on speculation without utility beyond the store of value.

Considering XRP has utilities crucial to global finance, the community commentator conveyed confidence in the $10,000 target. In his words:

“People sometimes think it’s impossible. It sounds unrealistic at first, but [not] when you fully understand the technology. In my opinion, that’s inevitable.” 

What XRP at $10,000 Mean

Presently, XRP trades at $0.5181, and the highest price it publicly traded was $3.84 in early 2018. Notably, XRP’s present value needs to grow by 1,930,029% to potentially worth $10,000. Such a surge would place XRP’s market capitalization at an extraordinary $999 trillion.

The sheer scale of this market cap under a $10,000 XRP scenario leads many to dismiss the idea as implausible. If XRP alone were to be valued at $999 trillion, it raises questions about the potential market caps of Bitcoin and the broader cryptocurrency market.

For context, the world’s wealth is around $454 trillion and is projected to reach only $629 trillion by 2027.

Shiba Inu Bollinger Bands Indicate Downtrend is Weakening, with Prices Eyeing $0.00006

The Bollinger Bands on the daily Shiba Inu chart suggest the downtrend might be weakening, with analysts setting breakout targets at $0.00006.

Shiba Inu now trades at a critical juncture following the persistent downtrend that plagued it from May 4. Recall that earlier this month, SHIB sought to recover from the price decline recorded throughout April, which led to a 27.16% monthly loss, the highest since the Terra implosion of May 2022.

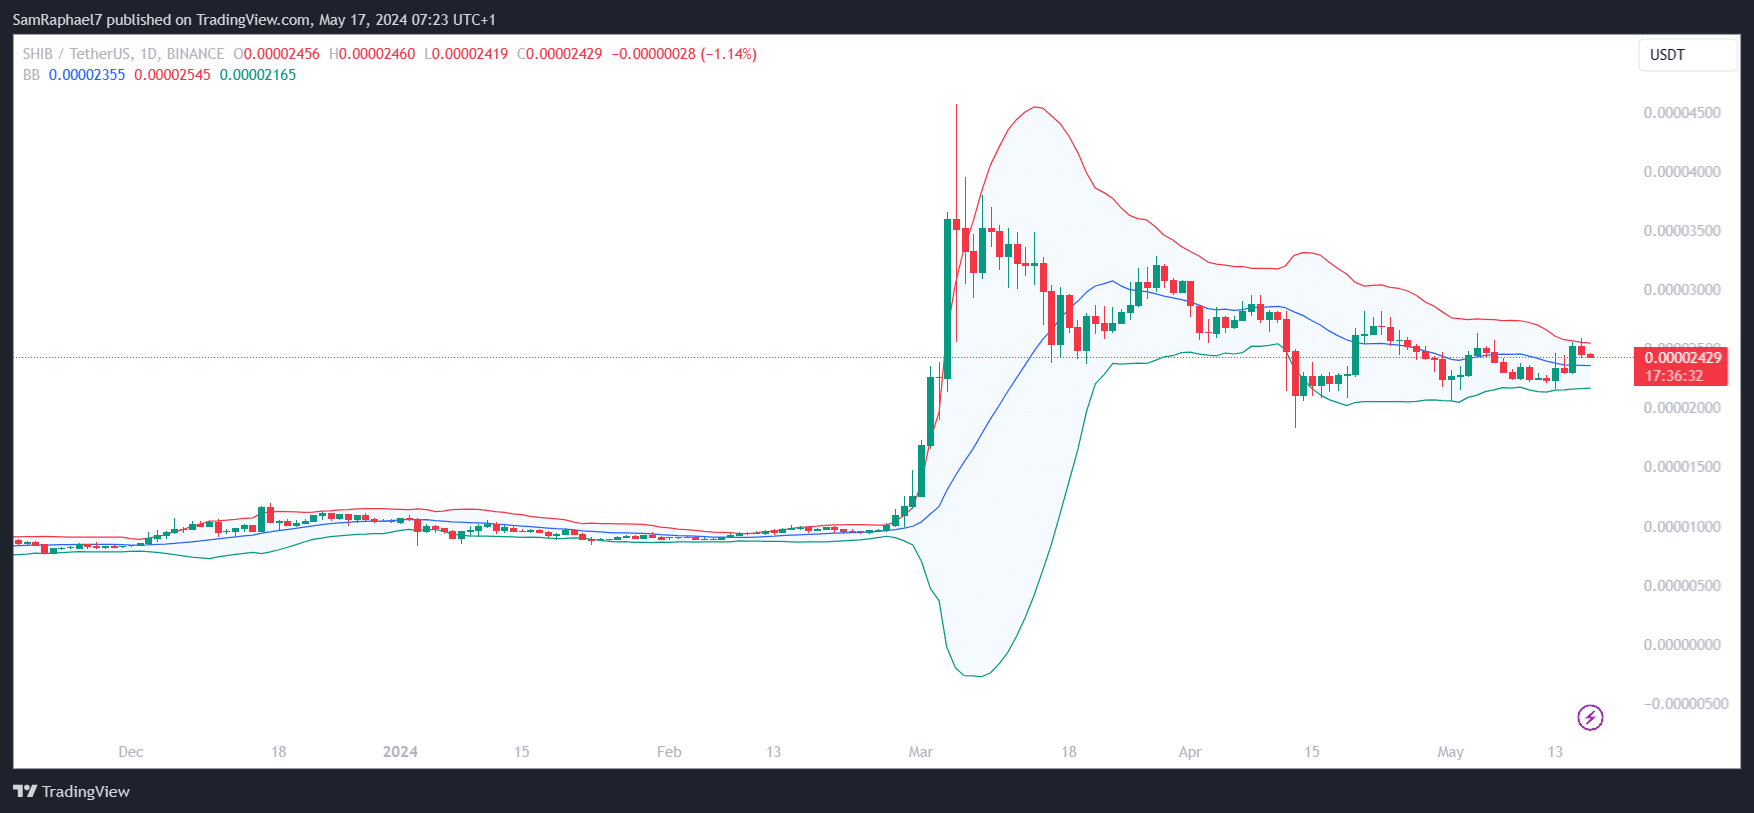
The recovery efforts from earlier this month faced a hiccup on May 4, resulting in another round of losses. However, this renewed downward push came to a halt on May 13 after Shiba Inu retested the lower Bollinger Band upon the crash to $0.00002156.

Bollinger Bands Suggest Weakening Downtrend

Now, the Bollinger Bands suggest SHIB might be gearing up to register a breakout that would eventually help eliminate this sustained downtrend. For context, traders leverage the Bollinger Bands to identify overbought or oversold regions, which could be useful in detecting an imminent trend reversal.

When a cryptocurrency’s price slumps to retest or break below the lower band during a downtrend, this typically suggests that the asset might be breaking into oversold territories. SHIB retested this lower trendline during the price collapse on May 13, signaling that the downtrend is weakening.

Shiba Inu Daily Bollinger Bands

Interestingly, the retest preceded an impressive recovery push from Shiba Inu, buoyed by Bitcoin’s (BTC) rebound. However, SHIB faced resistance when it touched the upper trendline at a high of $0.00002588 yesterday. Shiba Inu requires a further push from the bulls to retain this upward momentum and eventually breach the upper trendline.

Shiba Inu Sees Reduced Volatility 

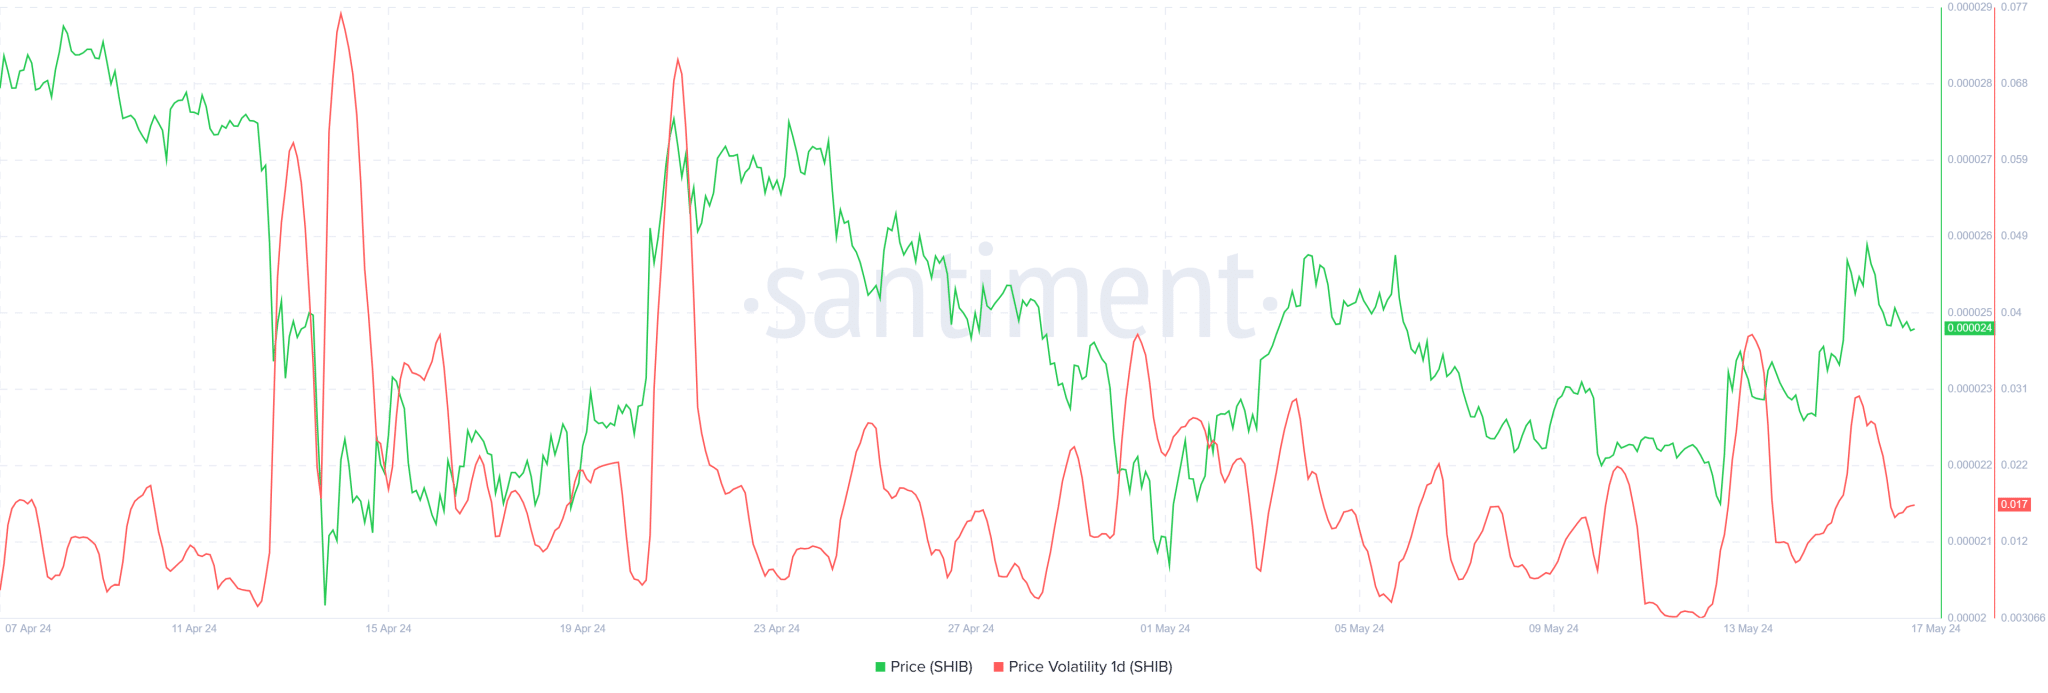
A closer look at the daily chart shows that the Bollinger Bands are currently contracting. Such a significant squeeze indicates reduced volatility, a pattern that suggests an imminent sharp price move. Data from Santiment shows that Shiba Inu did record a drop in volatility this week.

SHIB’s volatility collapsed to 0.003097 on May 12, the lowest in three months. The last time Shiba Inu saw its volatility drop to this level was on Feb. 25, when it slumped to 0.001892. This slump preceded Shiba Inu’s meteoric surge in late February, leading to a 370% spike to $0.000045 on March 5.

Shiba Inu Price Volatility Santiment
Shiba Inu Price Volatility | Santiment

Despite a mild increase in volatility over the past few days, this metric remains below the daily average. Meanwhile, market analysts have identified a symmetrical triangle on the daily chart, confirming that Shiba Inu has broken above the upper trendline. This breakout further sets the state for a significant price upswing.

A $0.00006 Target

Shiba Inu currently trades for $0.00002429, looking for another opportunity to retest the $0.000025 zone. The bulls would look to ride on the growing accumulation trend from shark and whale addresses to propel this much needed breakthrough. The Crypto Basic confirmed that these addresses have bought 4.35 trillion since March.

Amid these bullish indicators, some pundits expect Shiba Inu to reach a price of $0.00005. However, market analyst SHIB Knight believes Shiba Inu has the potential to hit the $0.00006 price level when it witnesses a trend reversal. This price would mark a 147% increase from Shiba Inu’s current value.

Here’s How Much Your 50M, 100M or 500M Shiba Inu Will be Worth if SHIB Reclaims ATH

As Shiba Inu looks to reclaim its all-time high value, investors continue to wonder how much their holdings would be worth if this goal materializes.

The crypto market downtrend has also impacted Shiba Inu, triggering a price collapse that has erased most of the gains of the previous weeks. Nonetheless, market watchers believe a recovery would ensue as the bull market matures, expecting a rally beyond price points such as $0.000045 and the ATH at $0.00008845. 

Last August, crypto analyst Javon Marks identified a triple bottom pattern on the 4-day Shiba Inu chart. According to him, this pattern suggests SHIB is on the verge of reclaiming its all-time high price. The factor behind this prediction was the formation of a similar triple bottom in 2021, right before Shiba Inu hit $0.00008845.

Worth of 50M, 100M, and 500M Shiba Inu at $0.00008845

For investors looking to start small, procuring up to 50 million Shiba Inu would require an initial investment of $1,128 at the current price of $0.00002256. Interestingly, the worth of these 50 million tokens would rise to $4,422 if Shiba Inu ever recaptured the ATH at $0.00008845. This would mark a yield of $3,294.

In addition, double this investment, amounting to 100 million tokens, would demand $2,256 if purchased at Shiba Inu’s current price. If SHIB soars toward the all-time high price, the value of the 100 million tokens could rise to $8,845, representing returns of $6,589.

Meanwhile, those seeking greater yields would need to commit more substantial initial investments. For instance, to purchase 500 million tokens, a market participant must invest $11,280 in Shiba Inu at the prevailing price. This investment would reach $44,225 at a SHIB price of $0.00008845, bringing in $32,945 in returns.

Can SHIB Reclaim Its ATH?

These projected returns paint a perfect picture, but the predominant challenge is Shiba Inu’s ability to reclaim the ATH price. The Crypto Basic revealed last month that SHIB faced four major sell walls on the path to the $0.00008845 price. Notably, these sell walls represent points where 352,190 addresses hold 63.76 trillion SHIB. 

Some Shiba Inu community figures projected that Shiba Inu could breach these roadblocks and hit $0.00008845 before the Bitcoin halving. However, this failed to materialize. Now, the alternative timeline is after the halving. Despite the optimism, there is no guarantee that these projections will play out.

Litecoin Price Forecast: $70 Reverse or $100 Breakout

0

Litecoin price remains sandwiched within the $81 – $83 narrow channel since the start of May 2024, despite bullish momentum returning to the crypto market this week. Critical on-chain metrics are flashing early signs of an imminent LTC breakout.

LTC Price Action Falls Behind Market Trend

Since the start of May 2024, Litecoin price continued to move sideways, as the bulls struggle to flip the $86 resistance cluster. Despite the bullish tailwinds from the cooler-than-expected inflation reported in the latest US CPI data, LTC price has failed to attract investors interest this week.

Consequently, LTC price action has now fallen far behind the broader crypto market average.

Litecoin LTC Price Action vs. Crypto TOTAL Cap | TradingView

As seen above, LTC opened trading on May 1 at around $79.50. However, at the time of writing on May 16, Litecoin’s price reached $83, reflecting only a 4% upswing for the month.

However, Litecoin appears to be underperforming by a large margin. Compared to LTC’s 4% bounce, the TOTAL Cap chart, which captures the real-time growth in the cumulative market capitalization of all listed crypto assets, has increased by 15.1%.

Whales Invest $80 Million to Front-run LTC Breakout

Litecoin’s underwhelming sideways price performance in the first half of May 2024 has been well-documented. However, recent on-chain data trends show crypto whale investors have been making large volume LTC purchases this week, likely to front-run a potential price breakout.

The Santiment chart below tracks real-time swings in LTC balances controlled by whale wallets holding a minimum of 10,000 LTC (~$800,000).

Litecoin price action vs. LTC Whales Balances

Looking at the chart above, the Litecoin whales held a total balance of 47.91 million LTC as of May 8. However, a week later, that figure increased significantly to reach 48 million LTC at the time of publication on May 16.

Valued at the current price, the Litecon whales have effectively spent over $80 million acquiring 90,000 LTC between May 8 and May 16.

When whales make such large purchases during periods of flat price action, as observed above, it suggests they may be looking to front-run an imminent breakout.

LTC Price Forecast: $86 Resistance Looms Large

Drawing insights from the whale’s $80 million fresh purchases in the past week, Litecoin price could be setting up for a major breakout towards $100 in the days ahead.

However, derivatives market indicators show that LTC bulls face a looming brick-wall around the $86 territory. Coinglass’ Liquidation heatmap data below shows that bear traders stand to lose over $5.8 million on leveraged SHORT contracts if Litecoin price moves above $85.9.

Litecoin LTC Price Forecast

To avoid booking such large losses, many Short traders could look to cut-down on their positions or deploy stop-loss triggers as price move towards $85.9. This inadvertent surge in sell-pressure could put downward pressure on LTC in the near-term.

But if the short traders move to hedge their positions with LONG spot purchases, Litecoin price stands a healthy chance of fipping the $85.9 resistance has heading toward $100 as predicted.

In the event of a market correction, bulls could mount a short-term support cluster around the $79 level to avoid losing over $5 million to LONG contract liquidations.

Trader Who Realized $8.2M from Shiba Inu is Now Buying this Coin

A savvy investor who secured over $8 million return from Shiba Inu has changed his focus to another high-performance asset amid the recent market frenzy.

Recently, crypto surveillance platform Spot on Chain called attention to the new buying activities of a trader who had profited $8.24 million via SHIB. Per the disclosure, the entity has now accumulated Wrapped Bitcoin (WBTC), having dumped SHIB just over a month ago with a 106% return.

How the Trader Made the $8.24M from Shiba Inu

The trader’s foray into Shiba Inu was between March 1 and 31, during which he acquired a staggering 533.6 billion SHIB tokens via 11 addresses. This investor spent $7.75 million to acquire this Shiba Inu portfolio on March 1 at an average price of $0.00001453 per SHIB.

Interestingly, the investor entered the SHIB market when SHIB was on an aggressive uptrend that commenced four days earlier. Shortly after their acquisition, Shiba Inu regained the $0.00002 threshold and continued to open further price levels last seen three years ago.

On the fifth day, SHIB hit $0.00004534. At this value, this trader’s 533 billion Shiba Inu portfolio clocked a monetary value of $24,166,220.

While the investor chose not to profit from the position immediately, the price of SHIB failed to continue the uptrend. It occasionally dropped to the $0.00002 price level but averaged above $0.00003 throughout March.

Having held on Shiba Inu for 30 days with no real sign of further upswing, the trader moved to liquidate his SHIB holdings. The investor dumped the 533.6 SHIB tokens for approximately $16 million in DAI stablecoin, realizing a profit of $8.24 million.

Shiba Inu aquistion and sale chart
The trader’s Shiba Inu acquisition and sale chart | Spot On Chain

Notably, the liquidation price was at an average price of $0.00003 per SHIB. Considering the entry price of $0.00001453, the investor witnessed a return of over 106% within 30 days of holding Shiba Inu.

In the subsequent days, the crypto market recorded painful price performances, wherein SHIB revisited $0.00001453. Overall, the trader’s exit from SHIB was perfectly timed.

Now Buying WBTC

Meanwhile, the crypto market bulls have led the narrative in the last 24 hours as Bitcoin reclaims the $66,000 price level. Bitcoin’s surge has notably impacted altcoins like Shiba Inu. However, the trader preferred to test new territories rather than reinvest in Shiba Inu. 

In particular, the investor committed $16.22 million to acquire WBTC at an average price of $64,449 per token. Spot On Chain observed that this wallet has already registered a profit of $380K in the last few hours amid Bitcoin’s surge.

Analyst Van de Poppe Identifies Polkadot Bottom, Projects Rally to $25 in Next Upswing

Veteran analyst Michaël van de Poppe believes Polkadot (DOT) has bottomed amid the latest market downtrend, projecting a price surge to $25.

Michaël van de Poppe made this commentary today during his latest analysis on Polkadot. In a post on X, the celebrated market veteran confirmed that Polkadot has been recording a massive correction since mid March, trailing the broader crypto market in the downtrend.

Polkadot Faces Correction

Market data confirms this disclosure, indicating that DOT soared from a low of $5.979 on Jan. 23 to a 22-month high of $11.889 on March 14. Interestingly, this marked the first time Polkadot traded above the $10 price territory since May 2022, when it collapsed below this level due to the Terra ecosystem collapse.

The spike from $5.979 to $11.889 earlier this year marked an impressive 98% increase, demonstrating DOT’s potential for substantial price surges. However, as Bitcoin (BTC) and the rest of the market faced a massive retracement, DOT got caught up in the bloodbath, eventually giving up its early gains.

Van de Poppe emphasized that, with Polkadot currently changing hands at the $6 price threshold, this correction has brought it to the levels it traded at before the impressive rally earlier this year. The last line of defense above this pre-rally level was the $8 territory, which gave in to bearish pressure early last month.

DOT Has Bottomed

Remarkably, van de Poppe asserted that DOT might have reached its bottom price for the cycle amid the correction. According to the market analyst, the release of the JAM Graypaper further solidifies his belief that Polkadot might not trade any lower than its current price position.

Recall that Gavin Wood, the founder of Polkadot, released the JAM Graypaper earlier this month. The Join Accumulate Machine (JAM) introduces a new structure for the Polkadot network. The protocol looks to extend Polkadot’s chain capabilities beyond the crypto scene and bolster its scalability. 

Immediately after the release of the JAM Graypaper, van de Poppe touted Polkadot as one of the promising layer-1 blockchains outside of Ethereum. According to him, the launch of the Graypaper effectively enabled Polkadot 2.0. This development is one of the most potent catalysts for a possible Polkadot surge.

A $25 Price Target

In his latest analysis, van de Poppe identified the $9.295 price as a crucial resistance level for Polkadot. The last time it saw this price point was on April 1 amid a price dump. Breaching this level could set the stage for a rally toward the $17, which represents another pivotal roadblock to break for a more substantial uptrend.

Van de Poppe predicts that this uptrend would help Polkadot achieve a price range between $20 and $25. While a $25 price would mark a massive 267% increase from DOT’s current price of $6.8, it still represents a 54.5% drop from the all-time high price of $55 attained in November 2021.